Update to coastal hazard maps
In April 2021 we released a new update to Northland’s coastal erosion and coastal flooding maps, to help us all understand the risks and plan better for the future.
How to access the hazard maps
The updated coastal hazard maps are all available on our ‘Natural Hazards’ map viewer. You will need to select the layers on the side to see each one.
We recommend using Firefox or Google Chrome to view these maps.
Find your way around the maps
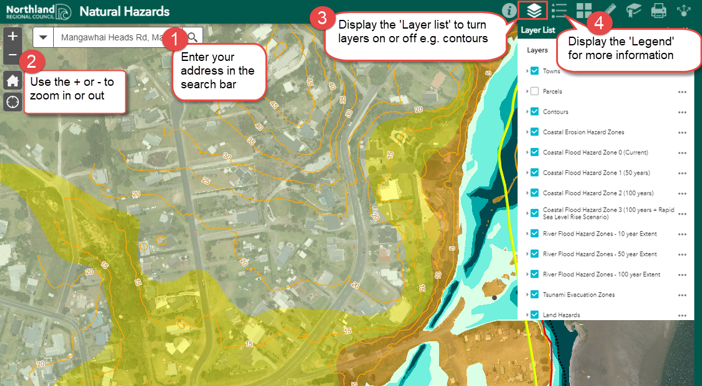
About the maps
Using new aerial survey data, we have updated our existing coastal hazard maps plus extended the mapping into other areas. This means new properties have been identified as at risk.
The maps show areas that may be prone to coastal erosion and coastal flooding over 50- and 100-year timeframes.
They are used to inform decision-making to minimise the risks of coastal hazards – for example, district councils are required to use them to manage where and how development occurs.
The maps are developed in line with best practice and modern techniques, using the best information available.
Disclaimer
Northland Regional Council’s coastal hazard maps have been compiled using best practice, and in accordance with policy #24 of the New Zealand Coastal Policy Statement (2010). These maps have been created from analysis of information using modern techniques and based on the best information currently available. However, they do not necessarily show the greatest extent of coastal flooding or erosion suffered in the past, or likely to be suffered in the future.
Full disclaimer
Frequently asked questions
These questions and answers explain what the coastal hazard maps contain, how they were developed and what they might mean for you.
What is coastal erosion and coastal flooding?
Coastal erosion means land being worn away (suddenly or over time) by coastal processes such as waves, tidal currents and storm events. Coastal flooding happens when low-lying areas become submerged under sea water, often due to storm surge generated by large storms.
Both are natural processes which are projected to worsen in future with ongoing sea level rise and more severe coastal storms due to climate change. You can find out more about these coastal hazards on our website: www.nrc.govt.nz/coastalhazards
Is mapping coastal hazards a new thing?
No, we’ve been working for many years to understand and manage coastal erosion and coastal flooding hazards in Northland.
Government policy requires councils to identify areas that are potentially affected by coastal hazards. We’ve had coastal hazard assessments for Northland coastal areas since the 1980’s, with the previous coastal hazard map updates released in 2017. We periodically update the maps as we get new information, and this is an ongoing process of improving our understanding and using new technologies.
Thanks to latest aerial survey data, we have now updated our existing coastal hazard maps with new data and calculations, plus extended the mapping into other areas. For coastal erosion, mapping is available for 11 new sites (for a total of 41 local site assessments across the region). For coastal flooding, mapping has been extended along the entire regional coastline.
How are the maps used?
The maps are used as part of decision-making to minimise the risks of coastal hazards.
For example, district councils will use the maps to manage where and how development occurs in areas at risk, through updated rules in district plans. This must be in line with Northland Regional Council’s Regional Policy Statement (RPS), which sets the direction on how natural hazards are to be managed in district plans (and gives effect to central government policy) – see section 7 of the RPS on our website: www.nrc.govt.nz/rps
District councils can also use the maps in resource consent and building consent processes to manage risk in relation to specific projects.
These maps are also used by Northland Regional Council to plan for emergencies and adapt to climate change risks.
What do the coastal flooding maps show?
The coastal flooding maps show four different scenarios:
- Current day (CFHZ 0): areas currently susceptible to coastal flooding in a 1-in-100-year storm event with no allowance for sea level rise.
- 50-year projection (CFHZ 1): areas susceptible to coastal flooding in a 1-in-50-year storm event, with a projected sea-level rise of 0.6m by 2080.
- 100-year projection (CFHZ2): areas susceptible to coastal flooding in a 1-in-100-year storm event, with a projected sea-level rise of 1.2m by 2130.
- 100-year ‘rapid sea level rise’ projection (CFHZ 3): areas susceptible to coastal flooding in a 1-in-100-year storm event, with a sea-level rise scenario of 1.5m by 2130. This is representative of a high-emissions scenario where more rapid rates of sea level rise occur due to dynamic ice sheet instabilities.
Two major variables influence the coastal flood hazard zones: the size of a given storm event, and the amount of sea level rise. The severity of a coastal storm can be described in terms of its likelihood (e.g. a ‘one in one-hundred-year storm’). How quickly sea level rise happens is related to global greenhouse gas emissions, and the levels we use are based on recommendations from the Ministry for the Environment.
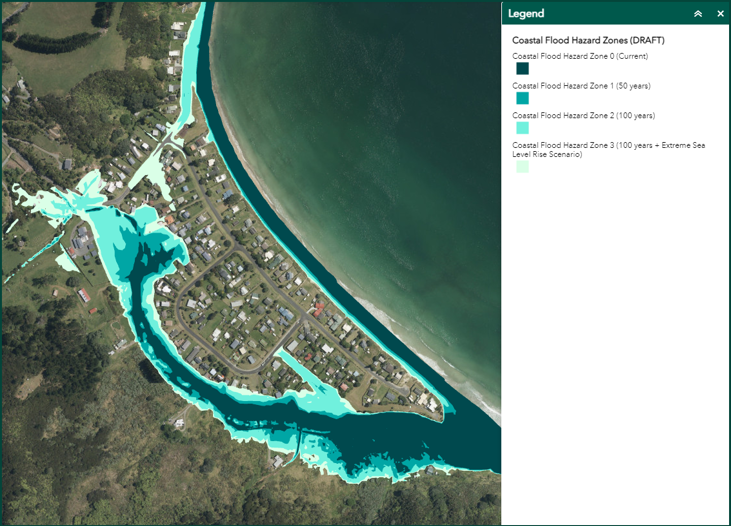
Figure 1: Example screenshot of coastal flood hazard zones on the web viewer.
What do the coastal erosion maps show?
The coastal erosion maps contain four different scenarios:
- Current day (CEHZ 0): areas currently susceptible to coastal erosion following the failure of an erosion protection structure, with no allowance for sea level rise; this zone is only mapped where erosion protection structures are in place.
- 50-year projection (CEHZ 1): areas ‘likely’ at risk of coastal erosion over the next 50 years, with a projected sea-level rise of 0.6m by 2080.
- 100-year projection (CEHZ 2): areas ‘potentially' at risk of coastal erosion over the next 100 years, with a projected sea-level rise of 1.2m by 2130.
- 100-year ‘rapid sea level rise’ projection (CEHZ 3): areas 'potentially' at risk of coastal erosion over the next 100 years with a sea-level rise scenario of 1.5m by 2130. This is representative of a high-emissions scenario where more rapid rates of sea level rise occur due to dynamic ice sheet instabilities.
Major influences on coastal erosion zones include the rate of long-term shoreline change and sea level rise. Our maps use scenarios based on the likelihood that erosion will extend landward to a given point (e.g. 66% likelihood of exceedance), and different sea level rise values.
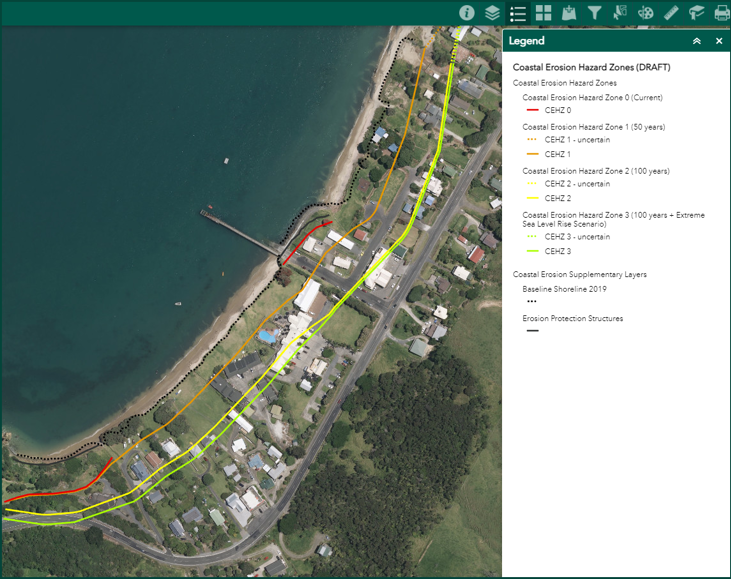
Figure 2: Example screenshot of coastal erosion hazard zones on the web viewer.
How were the maps developed?
The maps were developed with the best available information using the latest in coastal hazard assessment methodology. We are confident that the maps show a representative picture of coastal hazards where the assessments have been made. However, the maps should not be used in place of detailed local assessments when considering property-level risk. The coastal hazard map disclaimer outlines how these maps should be used.
How many properties are in the mapped areas?
For coastal flooding, the total number of parcels in mapped areas is now around 20,000 (roughly 7,500 of which are newly included). For coastal erosion it’s about 2,500 in total (roughly 500 of which are newly included). Note that there can be more than one parcel in a property.
When were the maps finalised?
The maps were finalised in mid-July, following a three month feedback period. District councils will now go through a process to incorporate the maps into district plans along with rules to manage development.
How do the maps affect peoples’ properties?
District councils are required to use the finalised maps to develop rules and policies for managing coastal hazard risks. So for properties that were already in mapped areas, that’s nothing new.
If you have questions about how the maps might affect your ability to use or develop your property, get in touch with your district council. Bear in mind they won’t be able to give property-specific advice until these hazard maps are added to their district plans. When that happens, district councils will give people the opportunity to have a say on the rules that apply in coastal hazard areas.
Note that the maps are not designed to be used as a replacement for site-specific advice or as a replacement for an engineering assessment.
In coming years, Northland Regional Council will partner with district councils to develop targeted adaptation plans to help guide how we build community resilience in a changing climate. We’ll need to work closely with communities and Tangata whenua to develop flexible plans so we can adapt and prepare for the challenges and opportunities to come.
Will this information go on my property file?
Like regional council, district councils are legally obliged to make hazard information available, so it will become part of the property information record including LIMs and PIMs.
Will this affect my property value or insurance?
We can’t advise you about any effect this information may have on your property values or insurance. You can seek professional advice from a property valuation or insurance expert about any concerns you may have.
What if I don’t agree with the maps?
If you have questions about how the maps were developed, or you have information that you think may not have been taken into account, get in touch with Northland Regional Council.
Who can I contact for more information?
For queries about the maps themselves (for example, how the maps were developed, how to interpret them, what the different zones mean) and regional policy, contact the regional council.
- Northland Regional Council: P 0800 002 004 | E info@nrc.govt.nz
For general enquiries about rules in hazard zones contact your district council (bearing in mind the new maps are yet to be included in district plans – see above).
- Far North District Council - P: 0800 920 029 | E: ask.us@fndc.govt.nz
- Whangarei District Council - P: 0800 932 463 | E: mailroom@wdc.govt.nz
- Kaipara District Council - P: 0800 727 059 | E: council@kaipara.govt.nz