4.2 What are the pressures and state of solids waste management in Northland?
This chapter on solid waste management differs slightly from other chapters in this State of the Environment Report, in that obviously solid waste management is not an environment like air, land and coastal are but it is a potential pressure on our environment. Therefore it is clearer to present the pressures and state of solid waste management together in this section.
Waste disposal facilities
There are currently three relatively small waste disposal sites operating in the Northland Region at Ahipara and Russell in the Far North District, and Hakaru (near Mangawhai) in the Kaipara District.
Within the Far North District, the closure of the Kaikohe (1999) and Whangae (2000) sites leaves only two operational sites, at Russell and Ahipara. It is likely that the Ahipara landfill will have reached full capacity by mid 2008. The balance of refuse generated within the Far North District is transported to Redvale landfill in Auckland for disposal.
The Kaipara District landfill site at Hakaru accepts refuse from the Mangawhai, Kaiwaka, and Maungaturoto areas, but is expected to close this year after which all refuse will be transported to Redvale landfill in Auckland. The balance of the refuse collected from the Dargaville area is also transported to Redvale.
The Pohe Island landfill in Whangarei ceased accepting refuse in October 2005. Concurrent with the closure of Pohe Island, the Re:Sort transfer station and recovery park commenced operation, accepting solid waste from the Whangarei District for compaction and transfer to Redvale Landfill in Auckland. The cost of transporting this rubbish outside the region is increasing as fuel prices continue to rise.
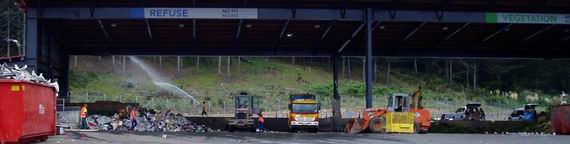
Re:Sort, the resource recovery park for the Whangarei District.
Northland Regional Council (NRC) has granted resource consent to Whangarei District Council for construction and operation of a new landfill site at Puwera, 10km south of Whangarei. It is anticipated that this will not be operational for at least three years.
There is also an unknown number of small farm disposal sites scattered throughout the region. There has also been an increase in the amount of unapproved cleanfill sites operating. While there is no regulatory requirement for formal approval of cleanfill sites, they must comply with the rules in the Regional Water and Soil Plan (RWSP) for Northland (NRC 2007).
Environmental incidents
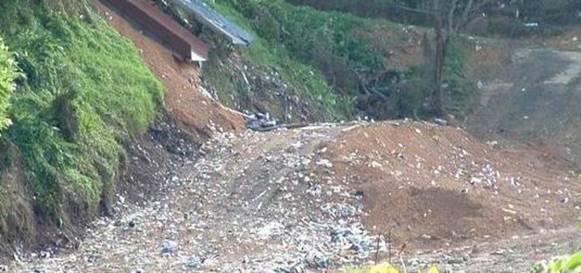
A total of 524 incidents of illegally dumped refuse were reported to the NRC between January 1994 and December 2006, including demolition material and offal, as shown in figure 1 (below).
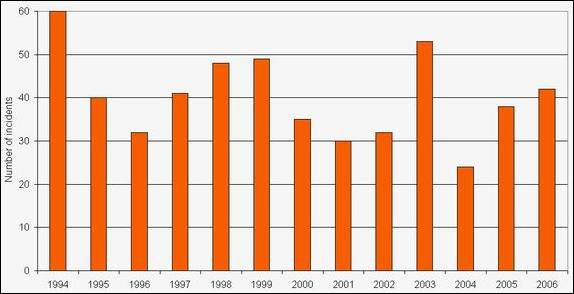
Figure 1: Graph showing number of illegal rubbish and offal dumping incidents in Northland reported to the Council from 1994 to 2006.
A decline in the number of illegal dumping incidents up to 2002 was reported in the last report (NRC 2002b). However there were about 20 more incidents of illegal dumpings recorded in 2003 and there has been a slight increase in incidents between 2004 and 2006. These increases could be associated with the implementation of user pays disposal fees. The majority of these incidents are reported from areas with major urban centres such as Kaitaia, Whangarei and Dargaville.
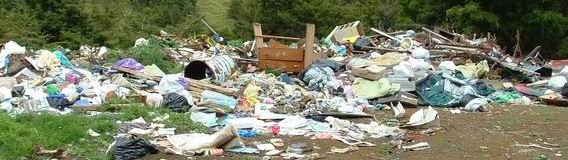
Illegal refuse dumping incident reported to the Regional Council.
There has also been a significant increase in the number of incidents of smoke nuisance from backyard waste burning reported to the Council from 2003 to 2006. Some of the offenders have claimed to be burning waste to avoid paying disposal fees. For more information refer to the air quality chapter of this report.
Quantity of waste produced
A summary of waste and recycling quantities from Far North and Whangarei Districts are presented below. Kaipara District Council (KDC) did not have a recycling programme and could not provide accurate data of waste entering landfills at the time this report was compiled. It is difficult to provide an accurate measure of the total volumes of solid waste produced in the region and therefore caution should be taken when interpreting these results.
Landfill waste
A summary of the amounts of waste being disposed of to landfill for the Far North and Whangarei Districts for the last two years is presented in figure 2 (below). KDC could not provide accurate data.
Based on the best estimate figures provided by the Whangarei District Council as shown in the graph below, the total amount of refuse waste that went to landfill in the Whangarei District in the 2005/2006 year was 47,851 tonnes, which is a slight increase from the 1999/2000 figure of 43,843 tonnes (NRC 2002b). However, if you compare this figure to the increase of population in the Whangarei District over this time, the amount of waste to landfill per person per year is the same in 2005/2006 as 1999/2000, at approximately 640 Kg/person.
The total amount of waste to landfill for the Far North District in 2005/2006 was 10,156 tonnes, which equates to 180 Kg/person for the year. This much lower figure per person in the Far North District suggests that a significant proportion of the waste produced in this District is not being disposed of in the main waste stream. It is most likely being disposed of in private sites in rural areas or through incineration.
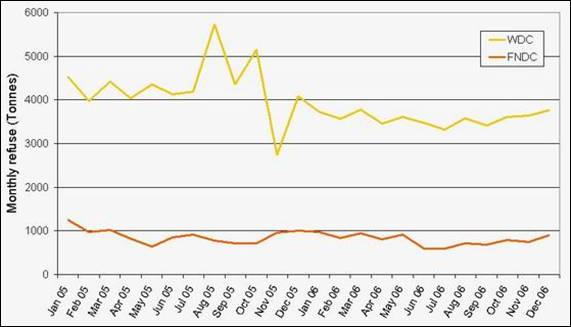
Figure 2: Monthly weight of refuse to landfill for Whangarei and Far North Districts for 2005 and 2006.
There has been a decrease in the total refuse quantities from Whangarei District at the time that user pays was introduced in October 2005. This can be attributed to a number of reasons, and is likely to be a combination of all of the following:
· Increased recycling (although the increase in recycling accounts for only 20% of the decrease in refuse quantities).
· Slight increase in the number of illegal dumping.
· A reduction in the amount of non-regional waste being disposed of in Northland. Due to disposal fees being considerably less in Northland to neighbouring regions in the past, there have been reports of transportation and disposal of non-regional waste.
· Burning or incineration of domestic rubbish.
· Increased separation of cleanfill material from general refuse and disposal of this cleanfill in situ or locally through privately operated cleanfills. Anecdotal evidence suggests a marked increase in private cleanfill operations.
· Increased on-site disposal in rural areas, as this is a permitted activity (within certain conditions) in the RWSP.
Recycled waste
A summary of the amounts of waste being recycled for the Far North and Whangarei Districts for the last two years is presented in figure 3 (below). The amount of waste recycled in 2005/2006 was 5,407 tonnes for the Whangarei District and 6,669 tonnes for the Far North District.
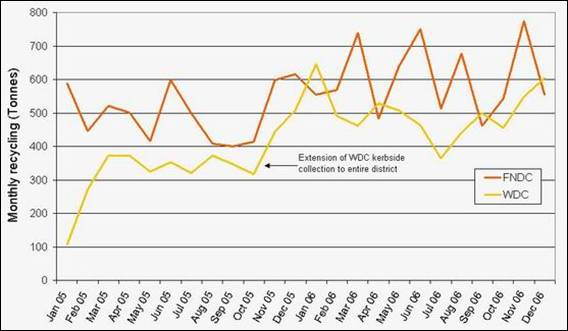
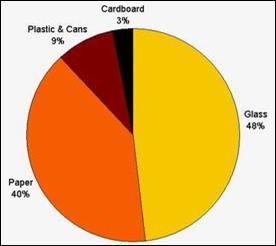 Figure 3: Monthly weight of recycled waste for Far North and Whangarei Districts for 2005 and 2006.
The extension of the kerbside recycling scheme to the entire Whangarei District led to (on average) a 43% increase in monthly tonnages compared to the previous figures.
The greatest proportion of the recycled waste by weight in the Whangarei District is glass at 48% followed by paper at 40% as shown in figure 4 (right).
Figure 4: Proportion of recyclables for Whangarei District for Feb 05 to Jun 07 (right).
Landfill monitoring
The effects that a landfill can have on the environment are not easy to detect. Leachate is produced when water filters downward through a landfill, picking up dissolved materials from the decomposing wastes. Depending on characteristics of the landfill and the wastes it contains, the leachate may be relatively harmless or extremely toxic. Generally leachate has a high biochemical oxygen demand (BOD) and high concentrations of organic carbon, nitrogen, chloride, iron, manganese and phenols. Many other chemicals may be present, including pesticides, solvents and heavy metals.
Modern, sanitary landfills are constructed to prevent leachate contamination of groundwater or surface waters. The bottom of the landfill is lined with impermeable layers, and the leachate is collected and treated before being released to the environment. On the other hand older landfills were constructed without liners, and have high potential for contamination of both surface and groundwater. Comprehensive monitoring programmes are needed so that many of these risks can be identified and action taken to prevent any off-site effects.
Both operational and closed landfills are monitored on a regular basis by the Regional Council. This monitoring shows that both closed and open landfills are having minimal adverse effect on downstream receiving water quality. The samples from landfills monitored over the past five years were all within specified resource consent limits and were not shown to have contributed to any significant contamination of nearby waterways.
Russell landfill.