New regional flood maps released
1 Dec 2021, 8:59 AM
Newly-released regional maps aim to help Northlanders better understand areas at risk of flooding and the potential impacts it could have on communities.
Amy Macdonald, Chair of the Climate Change Working Party, says river flooding is the most common natural hazard in Te Taitokerau.
“Climate change impacts likely mean we’ll see flooding events become more frequent and more intense.”
In 2016 council published river flood hazard maps for 28 Northland river catchments (‘Priority Rivers’) that were identified as having the highest level of potential flood risk; the latest maps identify flood hazards for the region’s remaining rivers.
“Our latest maps will replace the flood susceptible maps which were used for flood hazard and risk assessment purposes. The new maps are more comprehensive, accurate and cover the whole of the river catchments which were not displayed in the flood susceptible maps.”
There are 22,830 affected properties identified in the flood susceptible maps; 9995 in the Far North District, 8070 in the Whangarei District and 4765 in Kaipara.
The new maps have identified an additional 17,178 affected properties in total; 6538 in the Far North District, 7787 the Whangarei District and 2853 in the Kaipara.
“Affected properties (flood susceptible and new maps) include 99 marae locations and 3694 Māori land parcels. In many cases people living in potentially affected areas are very likely to be aware of, or have experienced, flood events.”
Councillor Macdonald says with implications for district council plans, a strongly growing community focus on climate change, and cross-council work underway to develop a region-wide adaptation strategy, “these maps are one of the cornerstones to develop a more resilient community”.
The maps were developed using computer models taking into consideration historic flood levels, topography, rainfall and river flows to provide an indication of areas potentially exposed to flood hazards and subsequent potential risk.
“These maps are more accurate, include climate change impact elements and show the likely extent of river flooding during significant flood event scenarios.
“For example an area showing a ‘one-in-10-year flood extent’ has a 10% chance (Annual Exceedance Probability or AEP) of flooding annually, whilst the more conservative ‘one-in-100-year flood extent’ has a 1% chance (AEP) of flooding annually.”
The different storm/flood scenarios modelled and shown on the new maps include a one in 10-year, one in 50-year and one in 100-year event.
Studies have found that flood behaviour in the region can be complex and vary significantly between locations depending on topography, infrastructure and rainfall pattern.
“There are obviously different types of floods. Very intense rainfall can occur suddenly and the resultant quickly rising flood waters are known as flash floods.”
In contrast, in larger catchment areas, rainfall can build up over hours or days.
“The runoff from this rainfall flows across land and may create significant inundation of large areas of land for long periods of time.”
These types of flooding can occur separately or together and therefore have varying impacts on properties.
Councillor Macdonald says the regional council works with communities – through and in collaboration with district councils – in flood-prone areas to reduce risks, including several large flood protection infrastructure projects.
“These new maps – which replace the previous flood susceptible layers on our website – allow the council, hapū, iwi and community to better understand risk areas and the potential impact on Northland communities.”
Northland’s three district councils are also required to use these to manage where and how development occurs.
More information on flooding is available at www.nrc.govt.nz/floodmaps
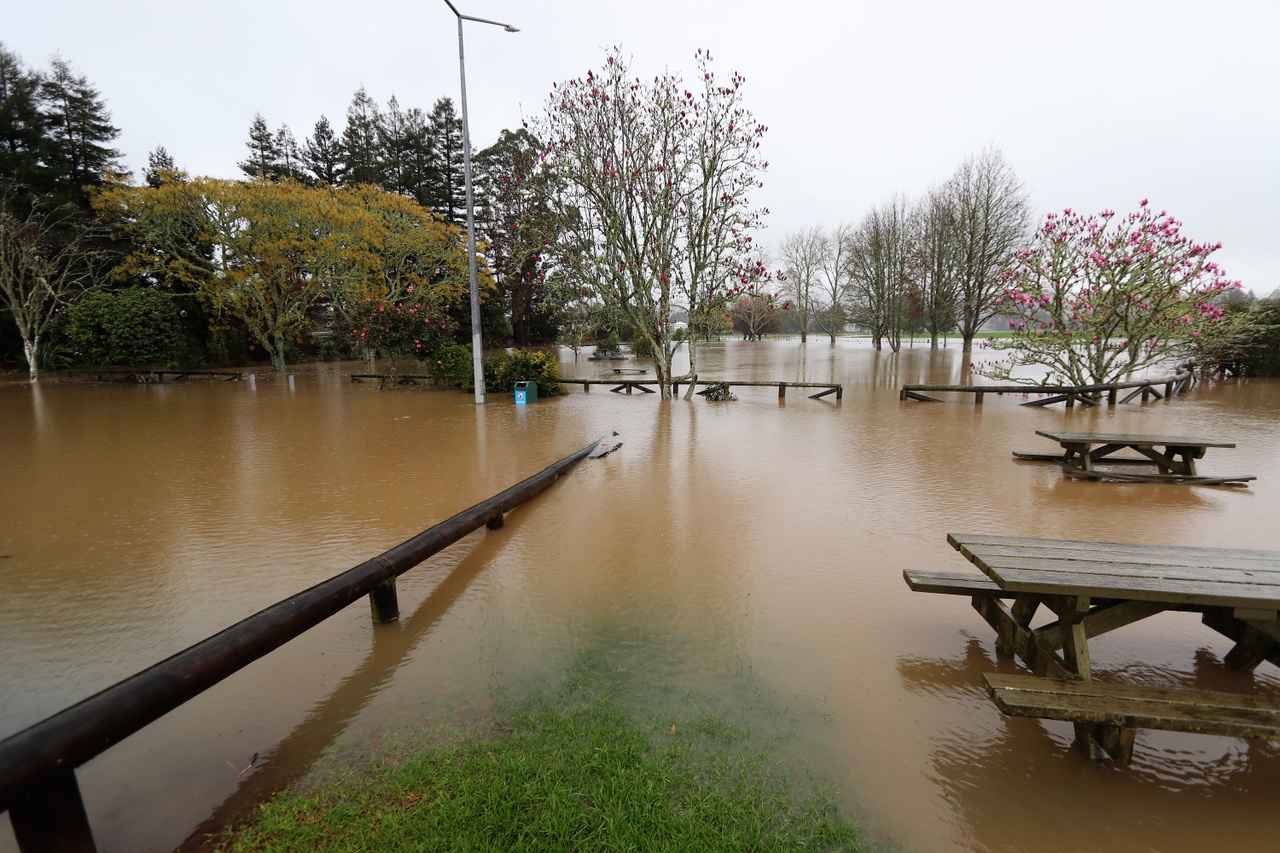
Flooding in Rawiri Taiwhanga Park - Kaikohe, 2020.