March climate report 2019
18 Mar 2019, 4:05 PM
Summary
Some reprieve from the dry conditions occurred with the rain events on the 3rd (mostly isolated to the Bay of Islands area), 9th (isolated to Whangārei/eastern hills) and 22/23 February (throughout the region, but mainly in the Kaipara). However, February rainfall overall in the region was below that expected for the month (except in parts of the Bay of Islands and Kaipara), due to the dominant highs remaining stationary over the Northland. The rain in the Bay of Islands area had very minor impact on river flows and was not enough reduce the existing rainfall deficit, with rain in the scale of 300mm still required to break the dry spell here, and around 150 mm in Kaitaia and Kaikohe catchments. River flows around Kaitaia and Hikurangi also remain very low with much of the rainfall received soaked up by dry ground.
NRC SPI indexing for the previous 8-month period, July 2018 to February 2019, categorises parts of Kaitaia, the Bay of Islands, Eastern Hills and Tutamoe Ranges as 'severely dry'. Soil moisture deficits are following suit, with all areas except Dargaville below the normal deficit expected for this time of year. These deficits are likely exacerbated by some very high temperatures throughout the region. Notably, Cape Reinga recorded the 3rd highest February temperatures since records began in 1951.
High pressure systems are likely dominant for first three weeks of March, but this is likely to break down in the week 18-24 March 2019, with the possibility of higher rainfall accumulations. However, with NIWA predicting a drier than average Autumn, further reductions in surface water and groundwater levels are possible in the following months.
Outlook
March:
MetService predicts that the Southern Annular Mode (SAM) will be strongly positive for the first half of March, with dominant high pressure systems, warm weather and little rainfall. However, models show a break in the high pressure in the week 18-24 March with the possibility of some higher rainfall accumulations. Overall, MetService predict that there is likely to be more rainfall during this month than there has been for the previous two months, but will likely drier than long term average March rainfall (Figure 1).
Autumn:
NIWA predicts that the continuation of warmer than average sea surface temperatures in the Tasman (Figure 2) and a Central Pacific based El Niño may lead to higher than average temperatures, with an increased risk of heavy falls. Though, dry spells are predicted, and for the Autumn period overall, rainfall, soil moisture and river flows in Northland are predicted to be below average (Table 1).
Figure 1: Metservice March 2019 rainfall prediction
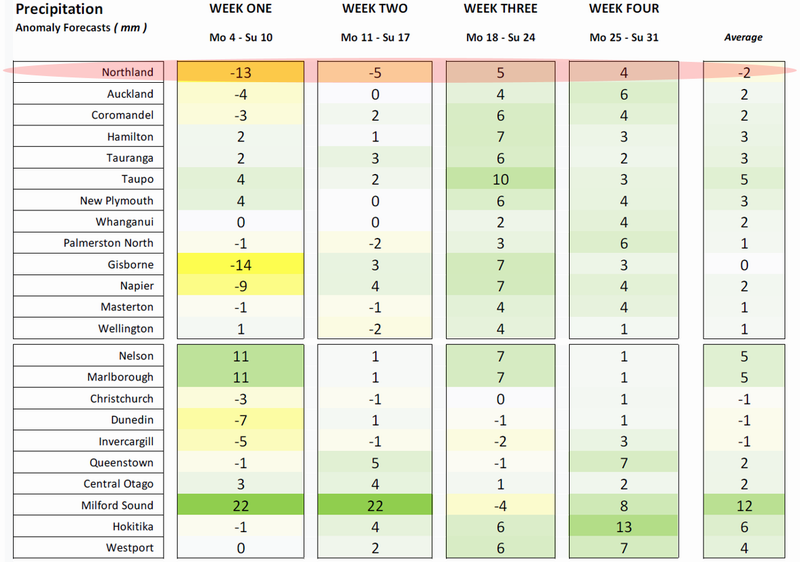
Figure 2: Recent sea surface temperature anomalies
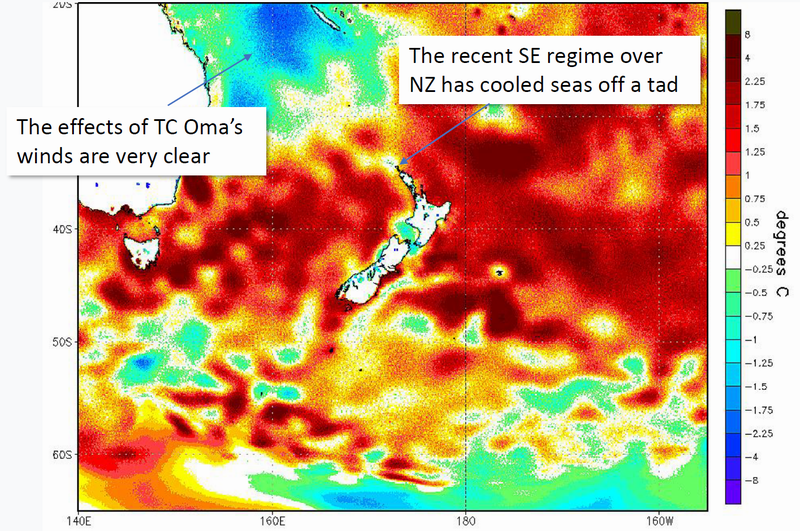
Table 1: NIWA Temperature, Rainfall, Soil Moisture and River Flows probabilities for March to May 2019
| Temperature | Rainfall | Soil moisture | River flows | |
| Above average | 60• | 25 | 25 | 25 |
| Near average | 30 | 35 | 35 | 35 |
| Below average | 10 | 40• | 40• | 40• |
Rainfall
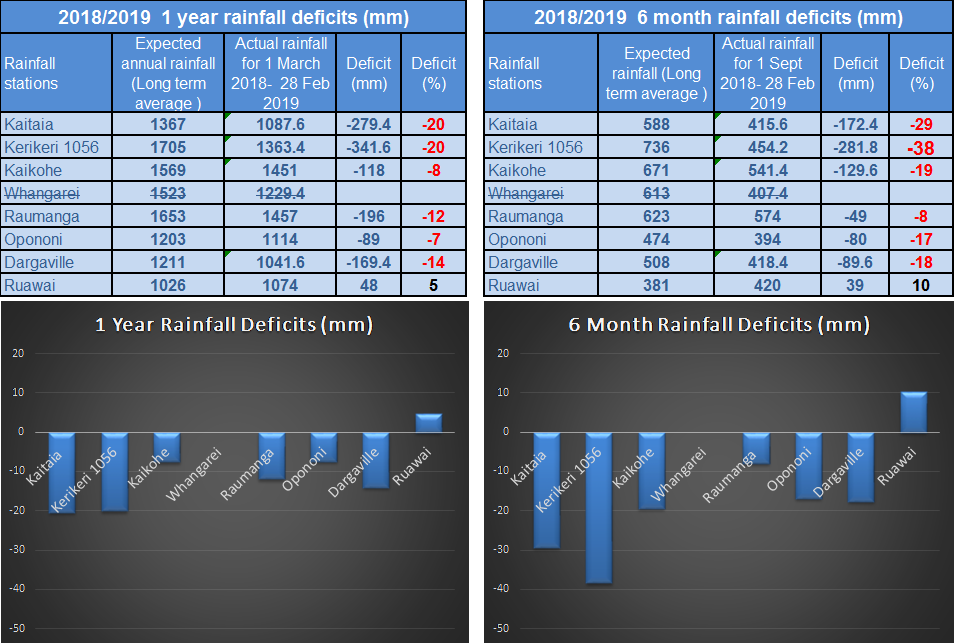
February 2019 rainfall was a mixed bag throughout the region, with Cape Reinga, the Bay of Islands and Ruawai receiving near normal monthly rain due to three isolated weather events over February 2019. Looking back at the 2018/2019 Summer, rainfall totals were below the long-term medians in all areas except Rauwai and Cape Reinga, with the driest areas being the Bay of Islands and Hikurangi (Figure 3/4). NRC SPI index figures rate these areas as moderately dry for the summer period. However, the best indication of current conditions comes from the rainfall figures for the dry period so far (July 2018 to Feb 2019). NRC SPI indexing over this period rates parts of Kaitaia, the Bay of Islands, Eastern Hills and Tutamoe Ranges as Severely Dry (Figure 5). Rainfall deficit figures for the previous 1 year and previous 6 months paint a similar picture, with significant deficits in Kaitaia and Kerikeri of -170 mm and -280 mm, respectively for the previous 6 months (Table 2).
Figure 3/4: NRC SPI Index map and Median Rainfall map for Summer 2018/2019
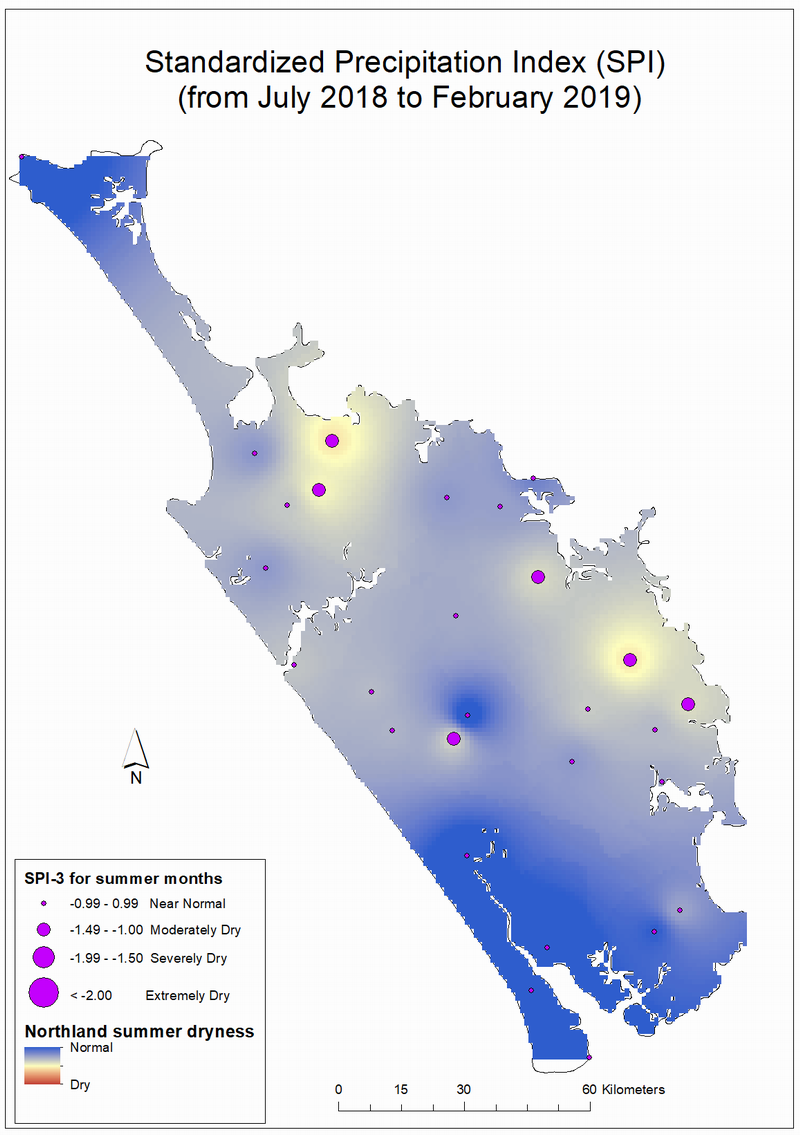
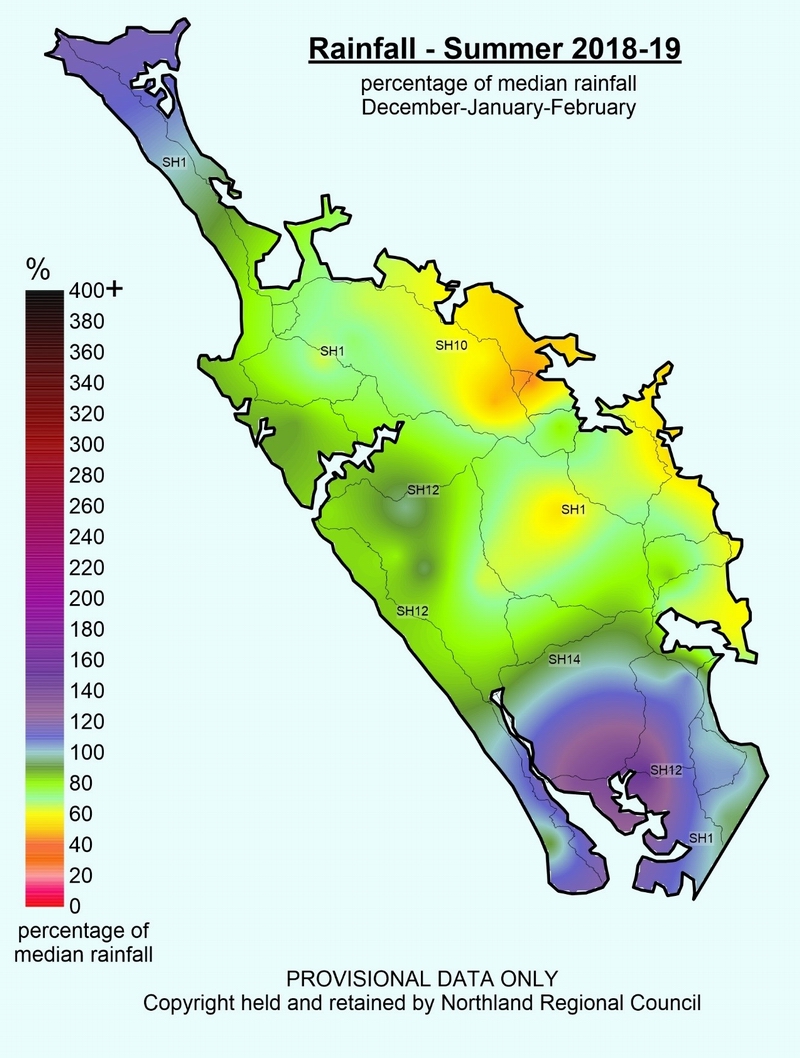
Figure 5: SPI Index map for the dry period, July 2018 to February 2019
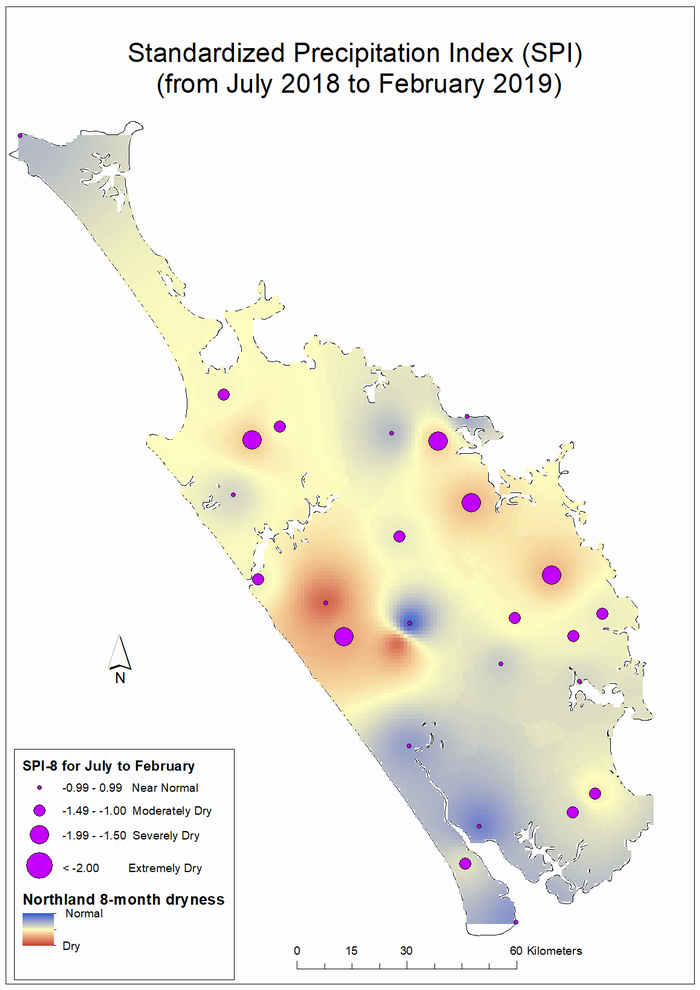
Table 2: One year and six-month rainfall deficit values
River flows
River flows for much of Northland are now really showing the effects of very low rainfall over the previous eight months. Rivers in the Far North, Bay of Islands and Hikurangi remain very low for the month of February, with many of these recording flows in the range 0-20% of their long term average flows for the February (Figure 6). The moderate rainfall received in the Bay of Islands in February had very little effect on the river flows. In fact, a comparison of current river flows to those over previous dry summers shows that river in the Bay of Islands are approaching the low flows experienced during the 2009/2010 drought. Many of the NRC river stations recorded flows below “Mean Annual Low Flow” for over half of the month (Table 3). (Table 4) below shows that “1:5 year low flow” has been reached at the Maungaparerua River and could be reached within the next month at Ngunguru, Kaihu and Awanui Rivers, if minimal rainfall occurs over this period. The Raumanaga, Wairua, Mangere and Waipapa Rivers have all recorded flows below “1:5 year low flow” for the month of March (between 5 and 13 days).
Figure 6: Flow Map February 2019
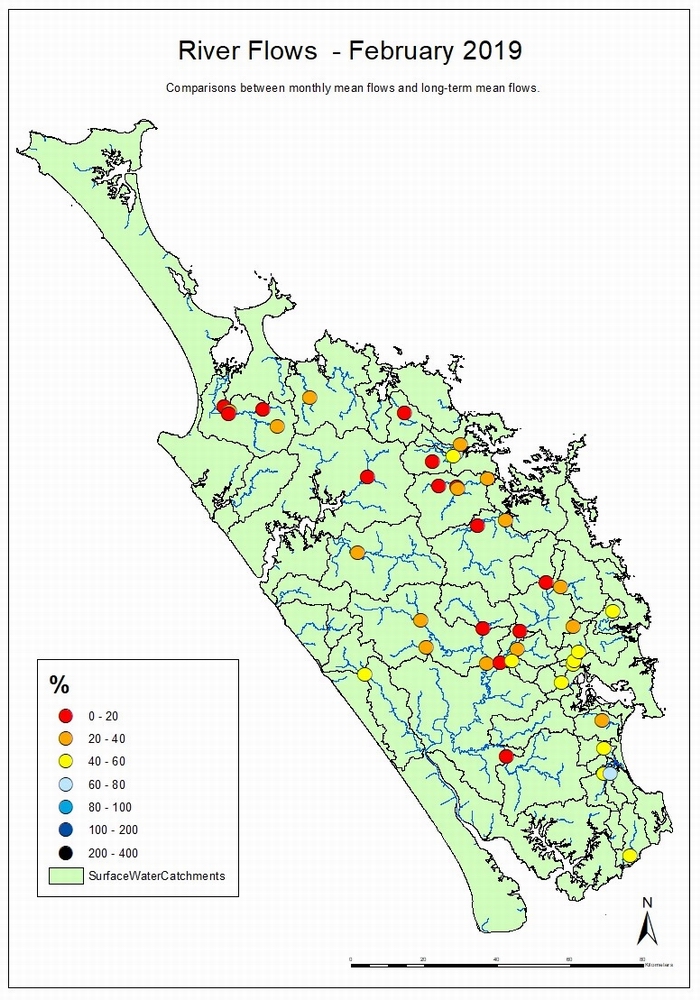
Table 3: Days below 7 day MALF at river recorders Nov 18-Jan 19
| Site | Dec-18 | Jan-19 | Feb-19 |
| Awanui at School Cut | 0 | 0 | 13 |
| Oruru at Saleyards | 0 | 0 | 0 |
| Punakitere at Taheke | 0 | 4 | 16 |
| Waipapa at Forest Ranger | 0 | 23 | 24 |
| Maungaparerua at Tyrees Ford | 0 | 17 | 23 |
| Rangitane at Stirling | 0 | 9 | 12 |
| Waitangi at Wakelins | 0 | 20 | 20 |
| Opouteke at Suspension Br | 0 | 0 | 12 |
| Kaihu at Gorge | 0 | 0 | 13 |
| Mangahahuru at County Weir | 0 | 1 | 17 |
| Mangakahia at Gorge | 0 | 0 | 0 |
| Mangakahia at Titoki Br | 0 | 0 | 8 |
| Manganui at Permanent Station | 0 | 0 | 17 |
| Hikurangi at Moengawahine | 0 | 0 | 15 |
| Wairua at Purua | 3 | 25 | 26 |
| Waiotu at SH1 Br | 0 | 0 | 0 |
| Ngunguru at Dugmores Rock | 0 | 0 | 6 |
| Waipao at Draffins Rd | 0 | 14 | 28 |
| Mangere at Knights Rd | 0 | 4 | 12 |
| Hatea at Whareora Rd | 0 | 0 | 0 |
| Raumanga at Bernard St | 0 | 0 | 12 |
| Waiarohia at Lovers Lane | 0 | 9 | 20 |
| Waihoihoi at St Marys Rd | 0 | 3 | 0 |
| North at Applecross Rd | 0 | 0 | 0 |
| Ahuroa at Braigh Flats | 0 | 0 | 0 |
Table 4: Predicted River Flows for Northland from 14 March 2019 estimated from recession curves (assuming no rainfall from this point onwards):
| Water level recorder | Days to reach Mean Annual Low Flow (MALF) |
Days to reach 1-in-5 year low flow |
| Awanui at School cut | 10 | 23 |
| Kaihu at Gorge | 4 | 8 |
| Maungaparerua at Tyrees Ford | 0 | 0 |
| Ngunguru at Dugmores Rock | 0 | 15 |
Groundwater
Water level reading indicates that the Russell, Kaikohe and Whangarei aquifers are below average for January 2019. The systems at Aupouri, Taipa, Poroti and Mangawhai appear OK (Table 5).
Table 5: Northland aquifer status
| Groundwater systems | Status for February 2019 |
| Aupouri | OK |
| Taipa | OK |
| Russell | BELOW AVERAGE |
| Kaikohe | BELOW AVERAGE |
| Whangārei | AT BELOW AVERAGE |
| Marsden-Ruakaka | BELOW AVERAGE |
| Mangawhai | OK |
| Poroti | OK |
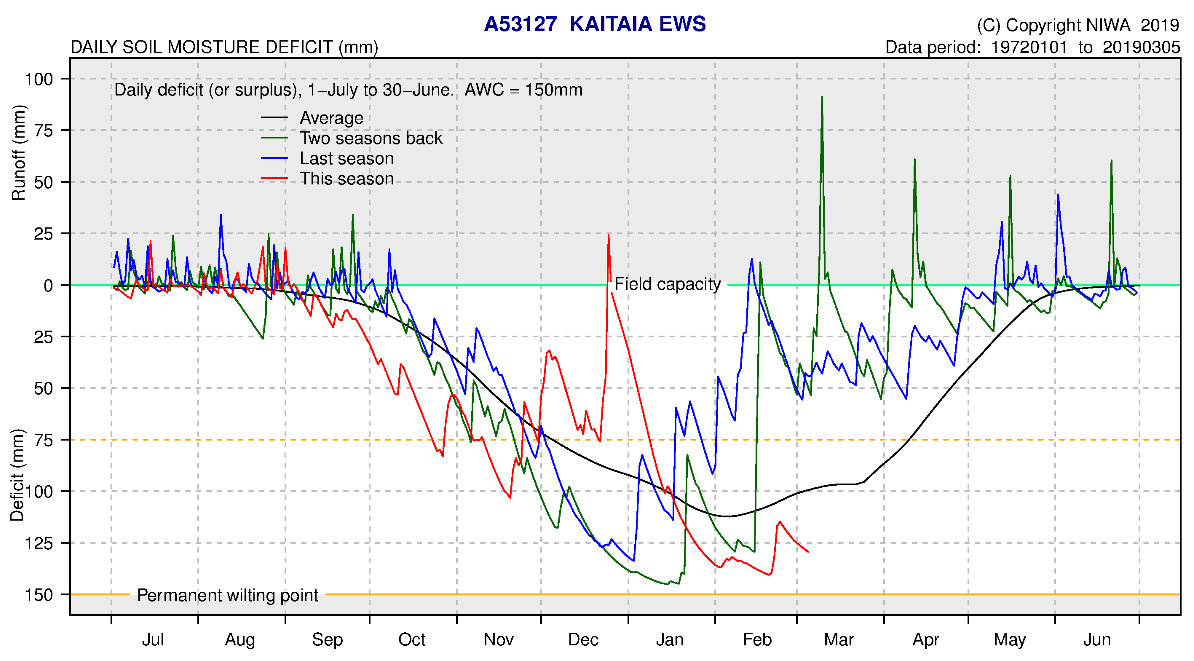
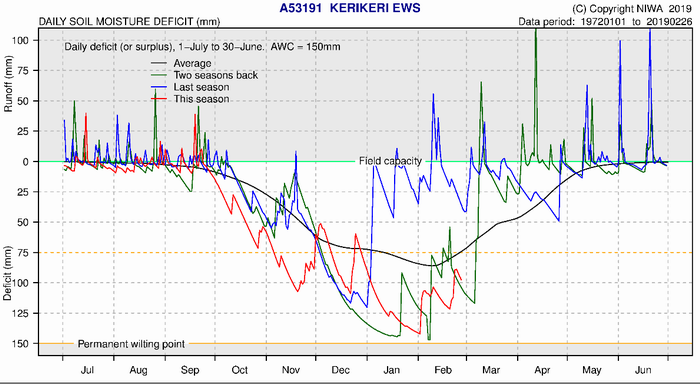
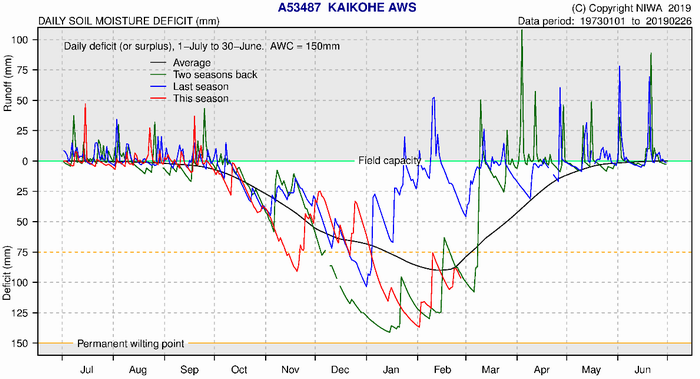
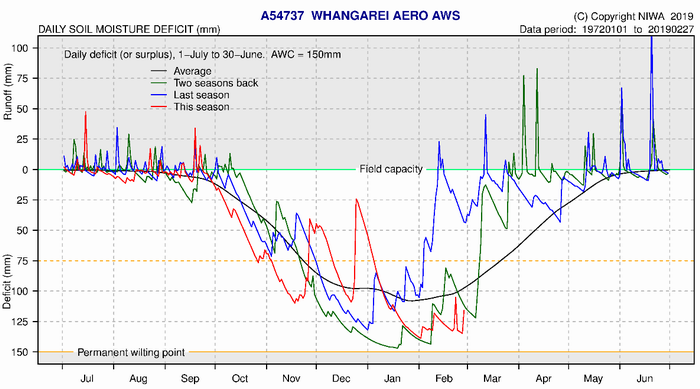
Soil moisture deficits
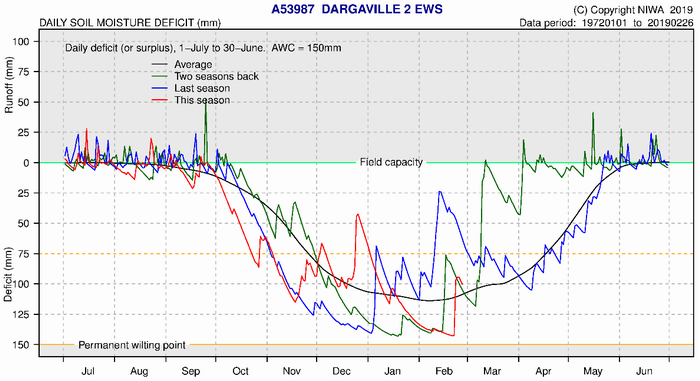
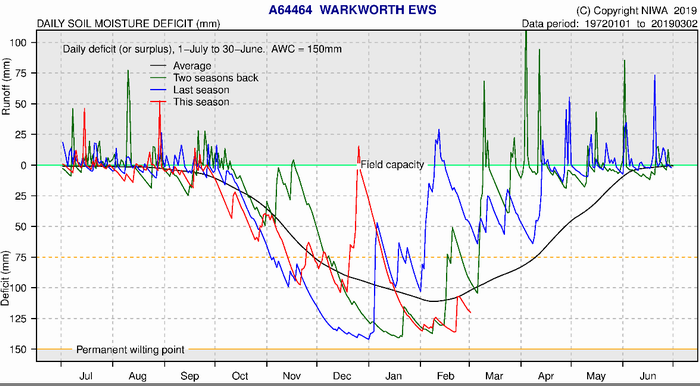
NIWA water balance modelling indicates soil moisture deficit is below average at Kaitaia, Kerikeri, Kaikohe, Whangārei and Warkworth (Table 6). NIWA report that severely dry soils were present across Northland for this month.
Table 6: Soil moisture deficit at NIWA climate stations
| NIWA Climate station | Soil moisture deficit as of 02/03/2019 | Normal soil moisture deficit |
| Kaitaia | -125mm | -100mm |
| Kerikeri | -100mm | -75mm |
| Kaikohe | -100mm | -90mm |
| Whangārei | -115mm | -100mm |
| Dargaville | -100mm | -110mm |
| Warkworth | -120mm | -100mm |
Figure 7-12 NIWA Soil Moisture Deficit Plots