Results
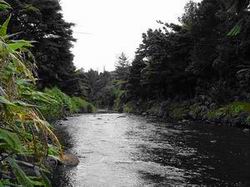
Waipoua River
The Waipoua River originates in and flows through Waipoua Forest, on the West Coast of Northland. The river cuts through volcanic soils and has a predominantly native forest catchment. The Waipoua River site is the only site in the network that is classified as "hill elevation" by the ‘River Environment Classification' (NIWA & MfE 2004) and therefore the results have been compared to the trigger values for an upland river. The Waipoua River is the closest to pristine condition of all the rivers in the network.
Results for 2008-09 for the Waipoua River site are summarised in the table below. These include the median, range and percentage of sampling occasions that complied with relevant guidelines for the 12 sampling occasions.
An asterisk in the table below denotes a median value outside the recommended guideline.
| Parameter | Median | Range | % compliance with guideline |
| Temperature (deg. cel.) | 12.9 | 9.8 - 19.3 | |
| Dissolved oxygen (% Sat.) | 99.4 | 91 - 104.9 | 50 |
| Conductivity (mSm) | 8.7 | 6.2 - 10.8 | |
| Water clarity (m) | 2.54 | 1.54 - 3.2 | 100 |
| Turbidity (NTU) | 2.2 | 1 - 5.8 | 67 |
| E. coli (n/100mL) | 57.5 | 5 - 134 | 83 |
| Dissolved reactive phosphorus (mg/L) | 0.005 | 0.005 | 67 |
| Total phosphorus (mg/L) | 0.005 | 0.005 - 0.02 | 67 |
| Ammoniacal nitrogen (mg/L) | 0.005 | 0.005 | 92 |
| Total nitrogen (mg/L) | 0.173 | 0.052 - 0.301 | 83 |
| pH | 7.4 | 6.9 - 7.6 | 50 |
The Waipoua River has been ranked as the best river in Northland based on the eleven parameters in the above table. The medians of all parameters were within the relevant guideline for an upland river. However, compliance with trigger values for single samples has been an issue this year, with half of the parameters not complying on four or more sampling occasions. Water clarity was the only parameter to comply with the trigger value of >0.8 cm on all sampling occasions. The range for total nitrogen is within the range typically found in New Zealand rivers in catchments dominated by indigenous forestry (Ballantine et al, 2010).
As the Waipoua River is classified as an upland river, the trigger values are stricter than the lowland trigger values, which is why compliance is poorer when comparing it to other Northland Rivers.
Trend analysis for this site shows that there is a decreasing trend in dissolved oxygen (mg/l). Further sampling and analysis is required to determine the reason for this trend.
Waipapa River
The Waipapa River originates in and flows through Puketi forest in central Northland, meandering through farmland until it reaches the upper Hokianga Harbour. The sampling site is in the upper reaches and therefore the catchment above it is predominantly indigenous forest, with some small areas of exotic forest in the headwaters. The geology of the Waipapa River is soft sedimentary (siltstones and mudstones). Similarly to the Waipoua River site, this site is in near pristine condition. The Waipapa site is one of four sites in Northland that are part of the National River Water Quality Network administered by NIWA.
Results from 2008-09 for the Waipapa River are summarised in the table below. These include the median, range and percentage of sampling occasions that complied with relevant guidelines. Note: Dissolved reactive phosphorus and ammoniacal nitrogen results were only available for six sampling occasions (July 2008 – December 2008). An asterisk in the table below denotes a median value outside the recommended guideline.
| Parameter | Median | Range | % comply with guideline |
| Temperature (deg. cel.) | 14.3 | 10.4 - 20.3 | |
| Dissolved oxygen (% Sat.) | 97.1* | 90.3 - 99.4 | 25 |
| Conductivity (mSm) | 11.7 | 10.38 - 13.4 | |
| Water clarity (m) | 2.78 | 0.19 - 7.48 | 83 |
| Turbidity (NTU) | 2.4 | 0.92 - 5 | 83 |
| E. coli (n/100mL) | 85.4 | 21.61 - 203.31 | 92 |
| Dissolved reactive phosphorus (mg/L) | 0.005 | 0.003 - 0.007 | 100 |
| Total phosphorus (mg/L) | 0.008 | 0.005 - 0.035 | 90 |
| Ammoniacal nitrogen (mg/L) | 0.005 | 0.001 - 0.006 | 100 |
| Total nitrogen (mg/L) | 0.085 | 0.066 - 0.298 | 100 |
| pH | 7.5 | 7.4 - 7.68 | 100 |
Results for 2008-09 show that the Waipapa River remains in a relatively pristine state as dissolved reactive phosphorus, ammoniacal nitrogen, total nitrogen and pH complied with their relevant trigger values on all sampling occasions. Water clarity and turbidity values exceeded their trigger values on two sampling occasions.
Dissolved oxygen appears to be an issue as values fell outside the trigger value range of 98 to 105% on nine sampling occasions.
Long-term trends indicate improvements in the Waipapa River. Trend analysis shows increasing water clarity and decreasing nitrite/nitrate nitrogen, ammoniacal nitrogen and total phosphorus concentrations. Further investigation is required to determine what is causing these trends.
Kaihu River
The Kaihu River originates in native forest to the west of Trounson Kauri Park and drains into the Wairoa River in Dargaville. The catchment is a mix of exotic and indigenous forestry, agriculture and horticulture but dairy farming is the predominant land-use. Kaihu River is one of six sites in the network that have volcanic acidic geology.
The results from 2008-09 for the Kaihu River site are summarised in the table below. These include the median, range and percentage of sampling occasions that complied with relevant guidelines. An asterisk in the table below denotes a median value outside the recommended guideline.
| Parameter | Median | Range | % comply with guideline |
| Temperature (deg. cel.) | 14.5 | 11 - 20.5 | |
| Dissolved oxygen (% Sat.) | 101.1 | 91.1 - 108.2 | 67 |
| Conductivity (mSm) | 11.4 | 9 - 12.3 | |
| Water clarity (m) | 2.14 | 0.68 - 2.7 | 100 |
| Turbidity (NTU) | 3.0 | 1 - 14.6 | 75 |
| E. coli (n/100mL) | 86.5 | 41 - 638 | 92 |
| Dissolved reactive phosphorus (mg/L) | 0.005 | 0.005 - 0.02 | 73 |
| Total phosphorus (mg/L) | 0.011 | 0.005 - 0.036 | 92 |
| Ammoniacal nitrogen (mg/L) | 0.005 | 0.005 - 0.04 | 92 |
| Total nitrogen (mg/L) | 0.307 | 0.147 - 1.224 | 67 |
| pH | 7.5 | 7.1 - 7.7 | 75 |
The results from 2008-09 are very similar to the previous year with most water quality parameters falling outside the trigger values on some sampling occasions. However, all medians were within their trigger values.
Water clarity exceeded the trigger value of 1.6 m on all sampling occasions. The yearly median was 2.14 m which is above the National Rivers Network median of 2.01 m (MfE, 2009). Trend analysis on six years of water quality data collected for the Kaihu River shows that there is an improving trend in water clarity.
Dissolved oxygen (mg/l) is decreasing however it is not yet known if decreasing dissolved oxygen is a positive or negative trend.
Mangakahia River at Twin Bridges
The Mangakahia River originates from Matarua Forest and flows southwest until it reaches the Wairua River. There are two sites on the Mangakahia River in the network; one at Twin Bridges and the other at Titoki Bridge, in the lower reaches. The Twin Bridges lie at the confluence of the Awaroa and Mangakahia Rivers. The sampling site is directly downstream of this confluence. The upstream catchment is a mixture of plantation forestry, and beef and sheep farming, with an acidic, volcanic underlying geology.
Results for 2008-09 for Twin Bridges on the Mangakahia River are summarised in the table below. These include the median, range and percentage of sampling occasions that complied with relevant guidelines. An asterisk in the table below denotes a median value outside the recommended guideline.
| Parameter | Median | Range | % comply with guideline |
| Temperature (deg. cel.) | 16.5 | 10.9 - 22.6 | |
| Dissolved oxygen (% Sat.) | 105.6* | 91.9 - 121 | 8 |
| Conductivity (mSm) | 11.3 | 8.2 - 14 | |
| Water clarity (m) | 1.82 | 0.46 - 3.26 | 91 |
| Turbidity (NTU) | 3.3 | 1 - 36 | 67 |
| E. coli (n/100mL) | 109.0 | 20 - 880 | 75 |
| Dissolved reactive phosphorus (mg/L) | 0.005 | 0.005 - 0.012 | 91 |
| Total phosphorus (mg/L) | 0.010 | 0.005 - 0.049 | 83 |
| Ammoniacal nitrogen (mg/L) | 0.005 | 0.005 - 0.02 | 100 |
| Total nitrogen (mg/L) | 0.209 | 0.076 - 0.492 | 100 |
| pH | 7.9* | 7.2 - 8.5 | 50 |
Results from 2008-09 indicate that nitrogen levels are excellent with total nitrogen and ammoniacal nitrogen concentrations well below their trigger values of 0.021 and 0.614 mg/l respectively on all sampling occasions. Phosphorus levels in the Mangakahia River were also good with the median for total and dissolved reactive phosphorus complying with their trigger values. Trend analysis shows that there is a significant decreasing trend in total phosphorus in this river.
The median of dissolved oxygen and pH were above their trigger values. The high dissolved oxygen levels occur in summer during lower flows, when photosynthesis rates by plants are greater.
Waimamaku River
The Waimamaku River begins north of the Waipoua forest and flows west through Waimamaku township, eventually reaching the West Coast south of the Hokianga Harbour. The catchment is dominated by indigenous forest in the upper reaches and is mainly pastoral in the lower catchment. The sampling site is located in the lower reaches of the river, after it passes through Waimamaku.
The results for 2008-09 are summarised in the table below. These include the median, range and percentage of sampling occasions that complied with relevant guidelines. An asterisk in the table below denotes a median value outside the recommended guideline.
| Parameter | Median | Range | % comply with guideline |
| Temperature (deg. cel.) | 15.2 | 10.1 - 22.6 | |
| Dissolved oxygen (% Sat.) | 100.5 | 90.8 - 109.5 | 50 |
| Conductivity (mSm) | 11.0 | 8.4 - 14.1 | |
| Water clarity (m) | 1.78 | 0.86 - 2.75 | 100 |
| Turbidity (NTU) | 3.1 | 1 - 12.2 | 83 |
| E. coli (n/100mL) | 237.5 | 74 - 2755 | 92 |
| Dissolved reactive phosphorus (mg/L) | 0.005 | 0.005 | 100 |
| Total phosphorus (mg/L) | 0.011 | 0.005 - 0.026 | 100 |
| Ammoniacal nitrogen (mg/L) | 0.005 | 0.005 - 0.02 | 100 |
| Total nitrogen (mg/L) | 0.289 | 0.058 - 0.782 | 92 |
| pH | 7.7 | 7.2 - 7.8 | 100 |
The results from 2008-09 for the Waimamaku River indicate that water quality is good as water clarity is high and nutrient and bacteria levels are low. Water clarity, dissolved reactive phosphorus, total phosphorus, total nitrogen and pH concentrations were all within their trigger values on all sampling occasions. The dissolved reactive phosphorus median of 0.005 mg/l was just above the National Rivers Network median of 0.004 mg/l (MfE, 2009).
There is not yet sufficient data to undertake trend analysis for this site.
Opouteke River
The Opouteke River drains from predominantly exotic forestry (pine forest), through a small area of pasture, before reaching the Mangakahia River. The only pastoral land use upstream of the sampling site is a sheep and beef farm, although dairy farms do occur further downstream. Acidic volcanic rocks make up the underlying geology.
Results for 2008-09 for the Opouteke River are summarised in the table below. These include the median, range and percentage of sampling occasions that complied with relevant guidelines. An asterisk in the table below denotes a median value outside the recommended guideline.
| Parameter | Median | Range | % comply with guideline |
| Temperature (deg. cel.) | 16.6 | 10.6 - 23.2 | |
| Dissolved oxygen (% Sat.) | 105.3* | 90.4 - 119.1 | 33 |
| Conductivity (mSm) | 13.0 | 10.4 - 14.8 | |
| Water clarity (m) | 2.00 | 0.73 - 3.25 | 100 |
| Turbidity (NTU) | 2.5 | 1 - 11.6 | 75 |
| E. coli (n/100mL) | 145 | 10 - 3873 | 75 |
| Dissolved reactive phosphorus (mg/L) | 0.005 | 0.005 - 0.011 | 91 |
| Total phosphorus (mg/L) | 0.012 | 0.005 - 0.027 | 100 |
| Ammoniacal nitrogen (mg/L) | 0.005 | 0.005 - 0.01 | 100 |
| Total nitrogen (mg/L) | 0.233 | 0.059 - 0.432 | 100 |
| pH | 8.0* | 7.3 - 8.8 | 25 |
Nutrient and water clarity results for the Opouteke River are good this year with three nutrient parameters and water clarity complying with their respective trigger values on all sampling occasions. The total nitrogen median of 0.233 is below the National Rivers Network median of 0.264 (MfE, 2009).
As in previous years, dissolved oxygen concentrations are often elevated in Opouteke River which is most likely due to high algae growth in the river. Like other RWQMN sites, pH compliance is poor with 75% of samples falling above the trigger value range for aquatic life. Further investigations are needed to determine what is causing this increase in pH.
Over the last two years phosphorus compliance has improved with 11 or more samples falling below their trigger values each year. In previous years, they exceeded guideline trigger values on 5 or more occasions. Trend analysis on the 14 years data available for Opouteke River shows that total phosphorus levels are decreasing. There is also a significant decreasing trend in nitrite/nitrate nitrogen.
Victoria River
The Victoria River begins in native forest in the Mangamuka Ranges, and runs north through pasture before joining the Awanui River near Kaitāia. The site is located approximately two kilometres downstream of the forest, in pastoral land use; however the upstream catchment is dominated by indigenous forest. The geology of this site is classified as volcanic acidic.
The results for 2008-09 for the Victoria River site are summarised in the table below. These include the median, range and percentage of sampling occasions that complied with relevant guidelines. An asterisk in the table below denotes a median value outside the recommended guideline.
| Parameter | Median | Range | % comply with guideline |
| Temperature (deg. cel.) | 13.6 | 10.7 - 19.5 | |
| Dissolved oxygen (% Sat.) | 92.5* | 83.9 - 103.1 | 17 |
| Conductivity (mSm) | 16.2 | 12.6 - 17.8 | |
| Water clarity (m) | 1.25 | 0.9 - 1.6 | 100 |
| Turbidity (NTU) | 1 | 1 - 7.2 | 92 |
| E. coli (n/100mL) | 140 | 86 - 246 | 100 |
| Dissolved reactive phosphorus (mg/L) | 0.017* | 0.01 - 0.02 | 9 |
| Total phosphorus (mg/L) | 0.021 | 0.014 - 0.05 | 83 |
| Ammoniacal nitrogen (mg/L) | 0.005 | 0.005 | 100 |
| Total nitrogen (mg/L) | 0.107 | 0.007 - 0.335 | 100 |
| pH | 7.6 | 7.3 - 7.8 | 100 |
Results for 2008-09 for the Victoria River indicate that water clarity, bacterial and nitrogen levels are good. The medians for the majority of parameters comply with their trigger values. Dissolved oxygen (%) and dissolved reactive phosphorus are the parameters of most concern as trigger values were not met on 10 or more sampling occasions.
Long-term trend analysis of data for the Victoria River site shows an increasing trend in dissolved oxygen and decreasing trends in both dissolved reactive and total phosphorus levels. It is likely that the increased trend in dissolved oxygen is positive as current values are often below the acceptable range for aquatic life.
There are significant long term trends indicating that water clarity is decreasing. Further investigation is required to identify the cause of this negative trend.
Waitangi River at Watea
The Waitangi River originates in the middle of Northland and flows east, where it joins the coast at Waitangi. There are two sites on the Waitangi River that form part of the RWQMN; one at Waimate North and the other at Watea near Waitangi. The catchments of both sites are dominated by pastoral farming. However, the geology of the upstream site at Waimate North is predominantly volcanic acidic, while the site at Watea is dominated by hard sediments.
Unlike many of Northland's rivers, a buffer strip of riparian vegetation exists along the banks of the majority of the Waitangi River. The Watea site on the Waitangi River is one of four sites in Northland that are part of the National River Water Quality Network administered by NIWA.
The results from 2008-09 for this site are summarised in the table below. These include the median, range and percentage of sampling occasions that complied with relevant guidelines. Note: Dissolved reactive phosphorus and ammoniacal nitrogen results were only available for six sampling occasions (July 2008 – December 2008). An asterisk in the table below denotes a median value outside the recommended guideline.
| Parameter | Median | Range | % comply with guideline |
| Temperature (deg. cel.) | 16.6 | 11.2 - 23.6 | |
| Dissolved oxygen (% Sat.) | 104.3 | 96.5 - 112.7 | 42 |
| Conductivity (mSm) | 11.9 | 10.6 - 13.3 | |
| Water clarity (m) | 1.74 | 0.24 - 3.85 | 83 |
| Turbidity (NTU) | 3.0 | 1.71 - 25.1 | 75 |
| E. coli (n/100mL) | 127 | 59.1 - 1986.28 | 92 |
| Dissolved reactive phosphorus (mg/L) | 0.006 | 0.004 - 0.011 | 83 |
| Total phosphorus (mg/L) | 0.021 | 0.009 - 0.062 | 90 |
| Ammoniacal nitrogen (mg/L) | 0.006 | 0.002 - 0.026 | 83 |
| Total nitrogen (mg/L) | 0.385 | 0.183 - 0.847 | 70 |
| pH | 7.6 | 7.3 - 7.95 | 75 |
This year results for the Waitangi River (Watea site) shows that all medians complied with their relevant trigger values, however, single sample compliance was average for some parameters. Like other rivers in the network, dissolved oxygen (percentage) compliance was poor with only five samples falling inside the trigger value range of 98 to 105 percent saturation.
E. coli compliance levels have improved this year with only one sample exceeding the trigger value of 550 E. coli/100ml. Last year four out of 12 samples exceeded the trigger value.
Based on 13 years of data, trend analysis shows that is a significant increasing trend in total kjeldahl nitrogen (the sum of organic nitrogen, ammonia and ammonium) but not ammoniacal and total nitrogen. More information on land use changes in the catchment is required to understand why this is occurring.
Kerikeri River, Stone Store Bridge
The Kerikeri River originates to the east of the Puketi Forest, and flows east into the Kerikeri Inlet. The catchment contains a range of land use, including pastoral, horticulture (orchards), agriculture (crops) and forestry (pine plantations). There are small areas of indigenous forest in the headwaters.
The results from 2008-09 are summarised in the table below. These include the median, range and percentage of sampling occasions that complied with relevant guidelines. An asterisk in the table below denotes a median value outside the recommended guideline.
| Parameter | Median | Range | % comply with guideline |
| Temperature (deg. cel.) | 15.6 | 11 - 22.2 | |
| Dissolved oxygen (% Sat.) | 103.5 | 70.1 - 203 | 25 |
| Conductivity (mSm) | 8.2 | 2.5 - 98.1 | |
| Water clarity (m) | 1.52 | 0.45 - 2.43 | 91 |
| Turbidity (NTU) | 2.6 | 2 - 25 | 75 |
| E. coli (n/100mL) | 280.5 | 86 - 2382 | 75 |
| Dissolved reactive phosphorus (mg/L) | 0.005 | 0.005 - 0.02 | 55 |
| Total phosphorus (mg/L) | 0.032 | 0.005 - 0.59 | 58 |
| Ammoniacal nitrogen (mg/L) | 0.015 | 0.005 - 0.04 | 92 |
| Total nitrogen (mg/L) | 0.717* | 0.392 - 1.084 | 42 |
| pH | 7.2 | 6.8 - 7.4 | 67 |
Water quality results for the Kerikeri River indicate that single sample compliance was poor for the majority of parameters. Dissolved reactive and total phosphorus compliance was poor with both failing to meet their trigger values on five sampling occasions. Dissolved oxygen levels are an issue at this site as only three samples fell within the trigger value range. Further sampling is required to investigate this issue.
Bacterial levels (E. coli) exceeded the trigger value for recreational bathing of 550/100ml on three out of the 12 sampling occasions which is an improvement on last years results.
This is the second year this river has been monitored as part of the RWQMN. There is not yet sufficient data to undertake trend analysis for this site.
Waipapa Stream at Kerikeri Inlet
The Waipapa Stream is fed by Lake Manuwai and flows east out into the Kerikeri Inlet. The stream passes through a mixture of land use types, including pastoral, horticulture (orchards) and lifestyle blocks. The underlying geology is predominantly acidic volcanic.
The results from 2008-09 are summarised in the table below. These include the median, range and percentage of sampling occasions that comply with relevant guidelines. An asterisk in the table below denotes a median value outside the recommended guideline.
| Parameter | Median | Range | % comply with guideline |
| Temperature (deg. cel.) | 16.5 | 11.3 - 23.1 | |
| Dissolved oxygen (% Sat.) | 95* | 70.1 - 108.3 | 25 |
| Conductivity (mSm) | 7.9 | 7.2 - 8.3 | |
| Water clarity (m) | 1.68 | 0.49 - 2.62 | 91 |
| Turbidity (NTU) | 2.7 | 1 - 28 | 92 |
| E. coli (n/100mL) | 181 | 41 - 884 | 83 |
| Dissolved reactive phosphorus (mg/L) | 0.005 | 0.005 - 0.012 | 91 |
| Total phosphorus (mg/L) | 0.019 | 0.005 - 0.111 | 58 |
| Ammoniacal nitrogen (mg/L) | 0.008 | 0.005 - 0.03 | 92 |
| Total nitrogen (mg/L) | 0.477 | 0.312 - 0.855 | 58 |
| pH | 7.0* | 6.8 - 7.1 | 0 |
Results for the Waipapa Stream site indicate that most of the parameters meet their trigger values during normal river flows. Total nutrients and E. coli generally exceed their trigger values in times of high flows. pH fell below its trigger value range of 7.2 to 7.8 on all sampling occasions. Water clarity and turbidity results were good with both exceeding their trigger values on only one sampling occasion.
There is not yet sufficient data to undertake trend analysis for this site.
Mangamuka River
The Mangamuka River begins in the Mangamuka Forest. The river then flows south into the upper reaches of the Hokianga Harbour. In the lower reaches, the river passes through pastoral land however the upper catchment is dominated by indigenous forest. The sampling site is located upstream of the confluence between the Mangamuka and Iwitaua Stream.
Results for 2008-09 are summarised in the table below. These include the median, range and percentage of sampling occasions that complied with relevant guidelines. An asterisk in the table below denotes a median value outside the recommended guideline.
| Parameter | Median | Range | % comply with guideline |
| Temperature (deg. cel.) | 13.6 | 10.7 - 19.7 | |
| Dissolved oxygen (% Sat.) | 92* | 74 - 98.6 | 8 |
| Conductivity (mSm) | 16.9 | 13.1 - 22 | |
| Water clarity (m) | 1.25 | 0.7 - 1.7 | 100 |
| Turbidity (NTU) | 2.0 | 1 - 7.6 | 83 |
| E. coli (n/100mL) | 159 | 41 - 3873 | 92 |
| Dissolved reactive phosphorus (mg/L) | 0.029* | 0.02 - 0.03 | 0 |
| Total phosphorus (mg/L) | 0.035* | 0.028 - 0.053 | 50 |
| Ammoniacal nitrogen (mg/L) | 0.005 | 0.005 - 0.01 | 100 |
| Total nitrogen (mg/L) | 0.115 | 0.052 - 0.429 | 100 |
| pH | 7.5 | 7.1 - 7.7 | 92 |
Water quality results for 2008-09 are very similar to last years with only three parameters meeting their relevant trigger values on all sampling occasions (water clarity, ammoniacal and total nitrogen). Dissolved reactive phosphorus did not meet its trigger value of <0.01 mg/l on any occasion, which is very concerning as the majority of the catchment is native forest. This may be a result of land use changes in the catchment which needs to be investigated. Dissolved oxygen is also often below the trigger value range for lowland rivers.
This is the second year this river has been monitored as part of the RWQMN. There is not yet sufficient data to undertake trend analysis for this site.
Mangahahuru Stream at Main Road
The Mangahahuru Stream, which begins in Pinus radiata forest to the southeast of Hikurangi, is a small tributary of the Wairua River. The sampling site is located in the upper catchment and therefore the predominant land use in this area is exotic forestry. The site was added to the RWQMN in 2005-06 as a representative of a river system on hard, sedimentary rock surrounded by exotic forestry. It provides a good comparison to the Mangahahuru Stream site at Apotu Road.
Results from 2008-09 are summarised in the table below. These include the median, range and percentage of sampling occasions that complied with the relevant guidelines. An asterisk in the table below denotes a median value outside the recommended guideline.
| Parameter | Median | Range | % comply with guideline |
| Temperature (deg. cel.) | 14.3 | 10.7 - 20.4 | |
| Dissolved oxygen (% Sat.) | 96.3* | 66.3 - 108.9 | 33 |
| Conductivity (mSm) | 9.8 | 9.1 - 12.4 | |
| Water clarity (m) | 1.11 | 0.92 - 1.6 | 100 |
| Turbidity (NTU) | 6.0* | 3.6 - 14.6 | 25 |
| E. coli (n/100mL) | 213.5 | 52 - 862 | 83 |
| Dissolved reactive phosphorus (mg/L) | 0.005 | 0.005 - 0.014 | 73 |
| Total phosphorus (mg/L) | 0.079* | 0.014 - 0.204 | 33 |
| Ammoniacal nitrogen (mg/L) | 0.015 | 0.005 - 0.04 | 75 |
| Total nitrogen (mg/L) | 0.250 | 0.097 - 0.442 | 100 |
| pH | 7.0* | 6.8 - 7.2 | 33 |
Water clarity and total nitrogen levels are good at the Mangahahuru Stream at Main Road site as they both complied with trigger values on all sampling occasions. Total phosphorus levels are an issue again this year with concentrations exceeding the trigger value on eight out of 12 sampling occasions. Last year, total phosphorus concentrations exceeded the guideline value of 0.033 mg/l only four times during the season. Turbidity compliance was also poor this year with only three samples falling below the trigger value of 5.6 NTU. Higher total phosphorus and turbidity levels may be due to erosion caused by harvesting pine plantations in the catchment.
Macroinvertebrate community index data indicates that the Mangahahuru Stream (Main Rd) is mildly polluted (Pohe, 2009).
There is not yet sufficient data to undertake trend analysis for this site.
Waiarohia Stream at Second Ave
Waiarohia Stream is a small stream originating from Pukenui Forest and the Western Hills in Whāngārei. The upper catchment is mainly indigenous forest with some exotic forestry. The stream flows through a small area of low intensity farmland and lifestyles block, before it reaches residential housing and the central business area of Whāngārei. This site is located in the central business area and was added to the RWQMN in 2005-06 to look at urban influences on water quality. Results for this site can be compared to the upstream site in Whau Valley.
The results from 2008-09 for the Waiarohia Stream site at Second Ave are summarised in the table below. These include the median, range and percentage of sampling occasions that complied with relevant guidelines. An asterisk in the table below denotes a median value outside the recommended guideline.
| Parameter | Median | Range | % comply with guideline |
| Temperature (deg. cel.) | 18.1 | 12.5 - 24.9 | |
| Dissolved oxygen (% Sat.) | 101.2 | 73.5 - 135.4 | 33 |
| Conductivity (mSm) | 24.3 | 17.6 - 30.7 | |
| Water clarity (m) | 2.08 | 0.85 - 3.1 | 100 |
| Turbidity (NTU) | 2.5 | 1 - 12.2 | 92 |
| E. coli (n/100mL) | 520.5 | 143 - 1095 | 58 |
| Dissolved reactive phosphorus (mg/L) | 0.005 | 0.005 - 0.015 | 64 |
| Total phosphorus (mg/L) | 0.019 | 0.005 - 0.03 | 100 |
| Ammoniacal nitrogen (mg/L) | 0.010 | 0.005 - 0.02 | 100 |
| Total nitrogen (mg/L) | 0.658* | 0.079 - 1.122 | 42 |
| pH | 7.5 | 7.2 - 7.8 | 100 |
All medians, except total nitrogen, met their respective trigger values for lowland rivers at this site. Bacteria levels are often elevated at this site with levels higher than the recreational bathing guideline of 550 E. coli/100 ml on five occasions. Dissolved reactive phosphorus and total nitrogen are often elevated and did not meet their relevant trigger values on four or more sampling occasions. The source of nutrient and bacterial contamination in this stream is likely to be from surrounding, small scale pastoral farming and is probably related to stock access to the stream. The overuse of fertiliser in residential gardens could also contribute to the increase in nitrogen.
The highest temperature of all the RWQMN sites was recorded at this site during summer (24.9°C). It is commonly accepted that water temperatures of greater then 25°C are potentially harmful or even lethal for aquatic life.
There is not yet sufficient data to undertake trend analysis for this site.
Waitangi River at Waimate North
The Waitangi River originates just east of Lake Omapere, and flows into the Bay of Islands. There are two sites on Waitangi River in the RWQMN; one in the upper to mid reaches at Waimate North and the other in the lower reaches at Watea. At the Waimate North site, the catchment is a mix of beef, sheep and dairy farming, with significant areas of indigenous forest in the headwaters. The underlying geology is predominantly acidic volcanic.
The results for 2008-09 for the Waitangi River at Waimate North are summarised in the table below. These include the median, range and percentage of sampling occasions that complied with relevant guidelines. An asterisk in the table below denotes a median value outside the recommended guideline.
| Parameter | Median | Range | % comply with guideline |
| Temperature (deg. cel.) | 14.7 | 10.8 - 21.1 | |
| Dissolved oxygen (% Sat.) | 97.2* | 69.7 - 108.6 | 17 |
| Conductivity (mSm) | 10.0 | 9.2 - 11 | |
| Water clarity (m) | 0.87 | 0.51 - 2.15 | 91 |
| Turbidity (NTU) | 6.1* | 3 - 21 | 50 |
| E. coli (n/100mL) | 359.5 | 175 - 2359 | 67 |
| Dissolved reactive phosphorus (mg/L) | 0.005 | 0.005 - 0.012 | 91 |
| Total phosphorus (mg/L) | 0.023 | 0.005 - 0.179 | 75 |
| Ammoniacal nitrogen (mg/L) | 0.015 | 0.005 - 0.04 | 92 |
| Total nitrogen (mg/L) | 0.622* | 0.372 - 1.004 | 50 |
| pH | 7.0* | 6.3 - 7.1 | 0 |
Results from 2008-09 indicate that water quality in the Waitangi River at Waimate North has deteriorated as nutrient and turbidity levels are higher than previous years.
This year median for turbidity is double what it was three years ago (3.05 NTU in 2005-06) and compliance has dropped to only half of the samples falling below the trigger value of <5.6.
Trend analysis on 10 years of data for this site shows that there is a significant decrease in dissolved reactive phosphorus. However, there are significant increasing trends in total kjeldahl nitrogen, nitrate nitrogen and total nitrogen. The increase in nitrogen species may be a result of further intensification of land use in the catchment.
Kaeo River
The Kaeo River begins north of Waipapa and flows north into the Whangaroa Harbour. Approximately half of the catchment is indigenous forest and scrub, with the remainder in pine forestry or pastoral farming. The underlying geology of the river is soft sediments. The site is located below the township of Kaeo, just before the influence of salt water.
The results from 2008-09 for the Kaeo River are summarised in the table below. These include the median, range and percentage of sampling occasions that complied with relevant guidelines. An asterisk in the table below denotes a median value outside the recommended guideline.
| Parameter | Median | Range | % comply with guideline |
| Temperature (deg. cel.) | 17.6 | 10.5 - 24.6 | |
| Dissolved oxygen (% Sat.) | 96.4* | 78.2 - 109.6 | 25 |
| Conductivity (mSm) | 13.8 | 11.7 - 14.9 | |
| Water clarity (m) | 0.90 | 0.5 - 1.5 | 75 |
| Turbidity (NTU) | 6.1* | 2.6 - 16.4 | 50 |
| E. coli (n/100mL) | 538.5 | 86 - 2613 | 50 |
| Dissolved reactive phosphorus (mg/L) | 0.005 | 0.005 | 100 |
| Total phosphorus (mg/L) | 0.016 | 0.01 - 0.025 | 100 |
| Ammoniacal nitrogen (mg/L) | 0.005 | 0.005 - 0.02 | 100 |
| Total nitrogen (mg/L) | 0.254 | 0.064 - 0.502 | 100 |
| pH | 7.2 | 6.9 - 7.3 | 67 |
The results from 2008-09 indicate that water quality in the Kaeo River is better than the previous year with all nutrient parameters meeting their trigger values on all sampling occasions. However, like last year E.coli and turbidity compliance is still poor with only half the samples meeting the trigger value of 550 E. coli/100ml.
pH compliance has improved with levels falling within the trigger range of 7.2 -7.8 on eight out of 12 sampling events. In 2007-08, only three samples fell within this range.
Trend analysis cannot yet be undertaken for this site as there is insufficient data.
Hātea River
The Hātea River begins as the Waitaua River which originates from Springs Flat area just north of Kamo and flows southeast through Tikipunga and Mair park then out into the Whāngārei Harbour. There is a mix of urban, native forest and pastoral land in the catchment.
The results for 2008-09 for the Hātea River site are summarised in the table below. These include the median, range and percentage of sampling occasions that complied with relevant guidelines. An asterisk in the table below denotes a median value outside the recommended guideline.
| Parameter | Median | Range | % comply with guideline |
| Temperature (deg. cel.) | 15.5 | 11.3 - 23.4 | |
| Dissolved oxygen (% Sat.) | 102.6 | 73.5 - 112.8 | 27 |
| Conductivity (mSm) | 52.4 | 15.4 - 2339.4 | |
| Water clarity (m) | 1.21 | 0.87 - 2.6 | 100 |
| Turbidity (NTU) | 4.0 | 2.6 - 11.2 | 73 |
| E. coli (n/100mL) | 464 | 145 - 677 | 64 |
| Dissolved reactive phosphorus (mg/L) | 0.005 | 0.005 - 0.068 | 64 |
| Total phosphorus (mg/L) | 0.023 | 0.01 - 0.25 | 73 |
| Ammoniacal nitrogen (mg/L) | 0.010 | 0.005 - 0.57 | 82 |
| Total nitrogen (mg/L) | 0.633* | 0.392 - 0.884 | 36 |
| pH | 7.7 | 7.4 - 8 | 73 |
The first year of results indicate that there are moderately high nutrient and bacterial levels in the Hātea River. Water clarity was the only parameter to meet the trigger value on all sampling occasions. Total nitrogen compliance was poor with only 36% of the samples meeting the lowland trigger value of <0.614 mg/l. Like many other RWQMN sites, dissolved oxygen compliance was also poor with only three samples falling within the trigger value range during the season.
As this is the first year of monitoring at this site, trend analysis cannot yet be undertaken.
Punakitere River at Taheke
The Punakitere River originates from a wetland to the southwest of Kaikohe and is a major tributary of the Waima River (which flows into the Hokianga Harbour). The catchment is predominantly agricultural land use with an underlying geology of soft sediments.
The results from 2008-09 for the Punakitere River are summarised in the table below. These include the median, range and percentage of sampling occasions that complied with relevant guidelines. An asterisk in the table below denotes a median value outside the recommended guideline.
| Parameter | Median | Range | % comply with guideline |
| Temperature (deg. cel.) | 15.4 | 10.9 - 22.4 | |
| Dissolved oxygen (% Sat.) | 100.6 | 85.7 - 119 | 33 |
| Conductivity (mSm) | 12.7 | 10.9 - 15.4 | |
| Water clarity (m) | 1.38 | 0.41 - 2.37 | 82 |
| Turbidity (NTU) | 6.4* | 2 - 62 | 42 |
| E. coli (n/100mL) | 320 | 160 - 1723 | 83 |
| Dissolved reactive phosphorus (mg/L) | 0.017* | 0.005 - 0.038 | 36 |
| Total phosphorus (mg/L) | 0.033 | 0.015 - 0.082 | 50 |
| Ammoniacal nitrogen (mg/L) | 0.01 | 0.005 - 0.04 | 92 |
| Total nitrogen (mg/L) | 0.826* | 0.112 - 1.134 | 25 |
| pH | 7.8 | 7 - 8.4 | 50 |
The results from 2008-09 indicate that the Punakitere River suffers from significant nutrient overloading, with medians for turbidity, dissolved reactive phosphorus and total nitrogen all exceeding their respective trigger values. Run-off from surrounding land-use is the most likely source of nutrient and bacterial contamination in the Punakitere River.
However, phosphorus compliance is better than the previous year with dissolved reactive and total phosphorus meeting their respective guideline values on four or more sampling occasions. Last year both dissolved reactive and total phosphorus only met their recommended guideline on one occasion.
Trend analysis on eight years data shows that there is an increasing trend in water clarity and decreasing trends in total nitrogen and total phosphorus. The increasing water clarity trend is consistent with national findings (Ballantine & Davies-Colley, 2009).
Whakapara River
The Whakapara River originates from the ranges east of Hikurangi and Whakapara, eventually joining the Waiotu River, forming the headwaters of the greater Wairua River. The river cuts through hard sediments formed from faulted greywacke, along a relatively low gradient. The site is located in a beef and sheep farm near State Highway one, with an upstream catchment dominated by forested hills and pastoral farming.
The results for 2008-09 for the Whakapara River site are summarised in the table below. These include the median, range and percentage of sampling occasions that complied with relevant guidelines. An asterisk in the table below denotes a median value outside the recommended guideline.
| Parameter | Median | Range | % comply with guideline |
| Temperature (deg. cel.) | 15.4 | 11 - 21.6 | |
| Dissolved oxygen (% Sat.) | 98.1 | 69.1 - 124.2 | 25 |
| Conductivity (mSm) | 9.0 | 8.3 - 10.2 | |
| Water clarity (m) | 0.79 | 0.48 - 2.62 | 73 |
| Turbidity (NTU) | 6.5* | 3.1 - 35 | 42 |
| E. coli (n/100mL) | 148.5 | 30 - 2098 | 92 |
| Dissolved reactive phosphorus (mg/L) | 0.021* | 0.01 - 0.032 | 18 |
| Total phosphorus (mg/L) | 0.044* | 0.032 - 0.154 | 17 |
| Ammoniacal nitrogen (mg/L) | 0.015 | 0.005 - 0.12 | 83 |
| Total nitrogen (mg/L) | 0.497 | 0.112 - 1.197 | 50 |
| pH | 7.1* | 6.5 - 7.9 | 42 |
Results for 2008-09 indicate that water quality in the Whakapara River is poor with high nutrient and turbidity levels. Both total phosphorus and dissolved reactive phosphorus compliance was poor with only two samples meeting their respective guideline values during the sampling season. Turbidity, dissolved oxygen (%) and pH also failed to meet their respective guidelines on most sampling occasions.
Significant long term trends in Whakapara River include decreasing nitrate nitrogen, dissolved reactive phosphorus and total phosphorus concentrations, which are all seen as positive trends. Improved land management practices in the catchment are the likely cause of these positive changes. However, there is an increasing trend in total kjeldahl nitrogen.
Waipao Stream, Draffin Road Bridge
The Waipao Stream was added to the RWQMN in 2007-08. The Waipao Stream begins as the Kauritutahi Stream to the west of Mangatapere (the Kauritutahi Stream becomes Waipao as it flows west towards Poroti). At Poroti, a number of springs feed into the stream and the stream itself eventually feeds into the Wairua River. The catchment of the stream is largely agricultural and includes high production farmland, orchards, crops and some small lifestyle blocks.
The 2008-09 results for Waipao Stream are summarised in the table below. These include the median, range and percentage of sampling occasions that complied with relevant guidelines. An asterisk in the table below denotes a median value outside the recommended guideline.
| Parameter | Median | Range | % comply with guideline |
| Temperature (deg. cel.) | 15.9 | 12.4 - 19.2 | |
| Dissolved oxygen (% Sat.) | 109.4* | 90.1 - 119.6 | 17 |
| Conductivity (mSm) | 18.5 | 16.5 - 20.1 | |
| Water clarity (m) | 1.76 | 0.87 -3 | 100 |
| Turbidity (NTU) | 2.9 | 1 - 9.7 | 83 |
| E. coli (n/100mL) | 337 | 122 - 2014 | 67 |
| Dissolved reactive phosphorus (mg/L) | 0.03* | 0.005 - 0.07 | 9 |
| Total phosphorus (mg/L) | 0.045* | 0.025 - 0.074 | 17 |
| Ammoniacal nitrogen (mg/L) | 0.008 | 0.005 - 0.03 | 92 |
| Total nitrogen (mg/L) | 3.287* | 0.477 - 3.815 | 8 |
| pH | 7.5 | 7 - 7.7 | 83 |
Results for the Waipao Stream indicate that phosphorus, nitrogen, and E. coli levels are elevated. The median for total nitrogen is extremely high and well over the lowland river trigger value of 0.614 mg/l. Nitrogen could be entering the stream through runoff from surrounding agricultural land or could be naturally occurring, leaching from volcanic soils in the catchment. Further sampling is required to investigate this.
Both dissolved reactive and total phosphorus had poor compliance with only one and two samples, respectively, meeting their trigger values. Like other RWQMN sites dissolved oxygen also failed to meet the trigger value range on ten out of 12 sampling events.
As the site was only added to the network in 2007, there is not yet sufficient data for the site to undertake trend analysis.
Mangakahia River at Titoki
The Mangakahia River originates in native bush near Waipoua Forest and flows southwest until it reaches the Wairua River. There are two sites on the Mangakahia River; one mid catchment at Twin Bridges and the other at Titoki Bridge in the lower reaches. By the time the Mangakahia River reaches the settlement of Titoki, surrounding land use is predominantly beef and dairy farming, with an underlying geology of acidic volcanic rock. This site is one of four sites in Northland that are part of the National River Water Quality Network, administered by NIWA.
The results from 2008-09 for the Mangakahia River site at Titoki Bridge are summarised in the table below. These include the median, range and percentage of sampling occasions that complied with relevant guidelines. Note: Dissolved reactive phosphorus and ammoniacal nitrogen results were only available for six sampling occasions (July 2008 – December 2008). An asterisk in the table below denotes a median value outside the recommended guideline.
| Parameter | Median | Range | % comply with guideline |
| Temperature (deg. cel.) | 16.6 | 11.8 - 23.3 | |
| Dissolved oxygen (% Sat.) | 96.2* | 90.6 - 100.8 | 17 |
| Conductivity (mSm) | 14.6 | 12 - 17.1 | |
| Water clarity (m) | 0.73 | 0.03 - 2 | 75 |
| Turbidity (NTU) | 5.9* | 2.5 - 62.5 | 50 |
| E. coli (n/100mL) | 216.5 | 125.9 - 1732.9 | 92 |
| Dissolved reactive phosphorus (mg/L) | 0.007 | 0.005 - 0.012 | 83 |
| Total phosphorus (mg/L) | 0.022 | 0.013 - 0.149 | 70 |
| Ammoniacal nitrogen (mg/L) | 0.014 | 0.01 - 0.03 | 83 |
| Total nitrogen (mg/L) | 0.211 | 0.166 - 0.721 | 90 |
| pH | 7.4 | 7.1 - 7.8 | 92 |
The results from 2008-09 indicate that the water quality in the lower Mangakahia River (Titoki site) is worse than the upper Mangakahia River (Twin bridges site), which ranked 4th this year. Water clarity results for the two sites appear to be the main difference with the median for the lower site significantly lower compared to the upper site, 0.73 and 1.82cm, respectively. Nutrient and turbidity compliance is also better at the upper Mangakahia River site. Nutrient concentrations tend to be higher and water clarity tends to be lower in pastoral catchments (Ballantine et al, 2010).
Bacterial levels at this site are lower than the upper Mangakahia River site. E. coli levels only complied with the trigger value on nine sampling occasions at the upper site compared to 11 at the lower site. This is probably a result of dilution in the river.
Trend analysis on data from for the Mangakahia River indicates there is decreasing trends in ammoniacal nitrogen, nitrite/nitrate nitrogen and total phosphorus. There is also a decreasing ammoniacal nitrogen trend national (Ballantine et al, 2010).
Waiarohia Stream at Whau Valley Road
Waiarohia Stream is a small stream originating from Pukenui Forest and the Western Hills in Whāngārei. The upper catchment is mainly indigenous forest with some exotic forestry. The stream flows through a small area of low intensity farm land (mostly lifestyle blocks), before it reaches residential housing and the central business area of Whāngārei. This site is located upstream of the majority of residential housing in the upper catchment of the Waiarohia Stream.
The results from 2008-09 for the Waiarohia Stream site at Whau Valley Road are summarised in the table below. These include the median, range and percentage of sampling occasions that complied with relevant guidelines. An asterisk in the table below denotes a median value outside the recommended guideline.
| Parameter | Median | Range | % comply with guideline |
| Temperature (deg. cel.) | 16.1 | 11.4 - 21 | |
| Dissolved oxygen (% Sat.) | 98.3 | 85 - 101.4 | 25 |
| Conductivity (mSm) | 28.4 | 16.6 - 40.3 | |
| Water clarity (m) | 1.40 | 0.63 - 2.56 | 83 |
| Turbidity (NTU) | 4.7 | 2.9 - 18.3 | 42 |
| E. coli (n/100mL) | 367 | 110 - 1850 | 8 |
| Dissolved reactive phosphorus (mg/L) | 0.005 | 0.005 - 0.016 | 25 |
| Total phosphorus (mg/L) | 0.026 | 0.016 - 0.047 | 33 |
| Ammoniacal nitrogen (mg/L) | 0.015 | 0.005 - 0.04 | 92 |
| Total nitrogen (mg/L) | 0.612 | 0.332 - 1.012 | 58 |
| pH | 7.3 | 7 - 7.6 | 67 |
Results from 2008-09 highlight several areas of concern in the Waiarohia Stream. Even though all medians met their respective trigger values, single sample compliance was an issue this year with most parameters failing to meet trigger values on four or more sampling occasions. The source of nutrient and bacterial contamination is likely to be surrounding, small-scale pastoral farming and could be related to stock access to the stream. NRC needs to encourage the surrounding landowners to exclude stock from the stream before this stream deteriorates further.
There is not yet sufficient data to undertake trend analysis for this site.
Ngunguru River
The Ngunguru River originates in Waipaipai to the west of the Tutukaka Coast and flows through the Glenbervie forest out into the Ngunguru Estuary. Half of the catchment is pastoral, with the rest a mixture of Pinus radiata forest and indigenous forest. The site is situated in the lower reaches of the river just before the river becomes saline.
The 2008-09 results for the Ngunguru River are summarised in the table below. These include the median, range and percentage of sampling occasions that complied with relevant guidelines. An asterisk in the table below denotes a median value outside the recommended guideline.
| Parameter | Median | Range | % comply with guideline |
| Temperature (deg. cel.) | 15.6 | 11.3 - 22.4 | |
| Dissolved oxygen (% Sat.) | 92.2* | 68.5 - 101.4 | 42 |
| Conductivity (mSm) | 15.2 | 9.3 - 296 | |
| Water clarity (m) | 1.02 | 0.61 - 2.55 | 100 |
| Turbidity (NTU) | 6.5* | 2.9 - 24 | 42 |
| E. coli (n/100mL) | 285 | 122 - 556 | 92 |
| Dissolved reactive phosphorus (mg/L) | 0.005 | 0.005 - 0.013 | 64 |
| Total phosphorus (mg/L) | 0.025 | 0.013 - 0.077 | 58 |
| Ammoniacal nitrogen (mg/L) | 0.020 | 0.005 - 0.04 | 83 |
| Total nitrogen (mg/L) | 0.268 | 0.172 - 0.452 | 100 |
| pH | 6.9* | 4.6 - 7.1 | 0 |
The second year of results suggests that turbidity and nutrient levels often exceed trigger values; however, single sample compliance for most parameters is much better than the previous year. E. coli compliance has improved significantly this year with only one sample exceeding the recreational bathing trigger value of 550 per/100ml. Last year, four samples exceeded the trigger value. Water clarity and total nitrogen were the only parameter to comply with their trigger values on all sampling occasions.
Trend analysis cannot yet be undertaken for this site as there is insufficient data.
Hakaru River
The Hakaru River originates in native bush and pine forestry in the Brynderwyn hills and flows south through farmland until it reaches the Topuni River. The Topuni River feeds into an arm of the Kaipara harbour. The underlying geology in the catchment is a mixture of volcanic acidic, and hard and soft sedimentary rock. The site is located at the bottom of the catchment, above the saline influence.
The results for 2008-09 for Hakaru River are summarised in the table below. These include the median, range and percentage of sampling occasions that complied with relevant guidelines. An asterisk in the table below denotes a median value outside the recommended guideline.
| Parameter | Median | Range | % comply with guideline |
| Temperature (deg. cel.) | 14.6 | 11.1 - 20.4 | |
| Dissolved oxygen (% Sat.) | 106.1* | 87.6 - 112.9 | 25 |
| Conductivity (mSm) | 17.9 | 16.3 - 18.9 | |
| Water clarity (m) | 0.87 | 0.5 - 1.2 | 92 |
| Turbidity (NTU) | 11* | 7.6 - 35 | 0 |
| E. coli (n/100mL) | 224 | 52 - 480 | 100 |
| Dissolved reactive phosphorus (mg/L) | 0.051* | 0.03 - 0.077 | 0 |
| Total phosphorus (mg/L) | 0.096* | 0.059 - 0.129 | 0 |
| Ammoniacal nitrogen (mg/L) | 0.015 | 0.005 - 0.03 | 75 |
| Total nitrogen (mg/L) | 0.683* | 0.411 - 1.306 | 30 |
| pH | 7.75 | 7.4 - 8 | 58 |
The results for 2008-09 indicate that water quality in the Hakaru River is moderately impacted, with high turbidity and nutrient levels. The 2009 macroinvertebrate community scores also indicate that the water in the Hakaru River is moderately polluted (Pohe, 2009).
Results are similar to the previous year with the medians for more than half of the parameters exceeded their respect guideline values. Turbidity, dissolved reactive and total phosphorus all exceeded their trigger values on all sampling occasions. This relatively poor water quality can be linked to runoff from surrounding agricultural land use. Excluding stock access and reducing fertiliser use will reduce nutrient levels in the Hakaru River
Trend analysis cannot yet be undertaken for this site as there is insufficient data.
Wairua River at Purua
The Wairua River above Whāngārei flows west into the Kaipara Harbour. It is one of the major tributaries of the greater Wairoa River. The catchment upstream of the sampling site is predominantly pastoral. The river cuts through hard sediments along a low gradient. The Wairua River site at Purua is one of four sites in Northland that are part of the National River Water Quality Network administered by NIWA.
The results for 2008-09 for the Wairua River at Purua are summarised in the table below. These include the median, range and percentage of sampling occasions that complied with the relevant guidelines. Note: Dissolved reactive phosphorus and ammoniacal nitrogen results are only available for July 2008 to December 2008. An asterisk in the table below denotes a median value outside the recommended guideline.
| Parameter | Median | Range | % comply with guideline |
| Temperature (deg. cel.) | 16.7 | 11.7 - 22.6 | |
| Dissolved oxygen (% Sat.) | 94.5* | 76.6 - 118 | 8 |
| Conductivity (mSm) | 12.9 | 10.8 - 14.1 | |
| Water clarity (m) | 0.8 | 0.16 - 2.34 | 83 |
| Turbidity (NTU) | 8* | 3 - 39.5 | 17 |
| E. coli (n/100mL) | 68.6 | 29.5 - 2419.2 | 83 |
| Dissolved reactive phosphorus (mg/L) | 0.019* | 0.017 - 0.029 | 0 |
| Total phosphorus (mg/L) | 0.06* | 0.033 - 0.14 | 10 |
| Ammoniacal nitrogen (mg/L) | 0.026* | 0.004 - 0.146 | 50 |
| Total nitrogen (mg/L) | 0.528 | 0.226 - 1.29 | 60 |
| pH | 7.0* | 6.6 - 7.7 | 42 |
Elevated turbidity, phosphorus and nitrogen results for this year indicate that the Wairua River is polluted. Medians for six of the nine parameters did not meet their respective trigger values. Dissolved oxygen compliance was poor again this year with only one sample falling within the trigger value range for lowland rivers. The extreme range in oxygen levels found in this river is a likely result of large macrophyte beds in the river which is a result of high nutrient concentrations.
Trend analysis on data from October 1996 to December 2008 indicates several positive trends, including decreasing ammoniacal nitrogen, nitrate nitrogen and total nitrogen. However nitrogen levels are still high and compliance with trigger values is poor. Excluding stock from waterways and reducing fertiliser use in the catchment will further reduce nutrient levels in the river.
There is also a trend suggesting that pH is increasing. This is likely to be a beneficial trend for this site as pH is often below the optimum range for the protection of aquatic ecosystems.
Waiharakeke River at Stringer Road
The Waiharakeke River is a major tributary of the Kawakawa River, which flows into the Waikare Inlet in the Bay of Islands. The Waiharakeke River originates in the Motatau Forest and flows North through a mixture of pine forestry, pastoral land and indigenous forest, before reaching Moerewa. The underlying geology is hard sedimentary.
The results from 2008-09 for the Waiharakeke River are summarised in the table below. These include the median, range and percentage of sampling occasions that complied with the relevant guidelines. An asterisk in the table below denotes a median value outside the recommended guideline.
| Parameter | Median | Range | % comply with guideline |
| Temperature (deg. cel.) | 15.3 | 10.7 - 21.8 | |
| Dissolved oxygen (% Sat.) | 93* | 70.4 - 101.1 | 18 |
| Conductivity (mSm) | 15.7 | 10.2 - 18.6 | |
| Water clarity (m) | 0.67 | 0.4 - 1.21 | 55 |
| Turbidity (NTU) | 10.3* | 4.1 - 25 | 8 |
| E. coli (n/100mL) | 273.5 | 121 - 1565 | 83 |
| Dissolved reactive phosphorus (mg/L) | 0.016* | 0.005 - 0.052 | 27 |
| Total phosphorus (mg/L) | 0.042* | 0.025 - 0.078 | 25 |
| Ammoniacal nitrogen (mg/L) | 0.020 | 0.005 - 0.07 | 67 |
| Total nitrogen (mg/L) | 0.522 | 0.212 - 0.822 | 67 |
| pH | 7.4 | 6.2 - 7.5 | 75 |
This year's results for the Waiharakeke Stream indicate nutrient and turbidity levels often exceed trigger values. Dissolved reactive and total phosphorus compliance was particularly poor with only three samples complying with their trigger values of 0.01 and 0.033 mg/l, respectively. Turbidity compliance is the same as last year's results with only one sample meeting the trigger value. Bacterial levels are lower than the previous year's with 83% of samples complying this year compared with 50% last year.
Trend analysis cannot yet be undertaken for this site as there is insufficient data.
Waiotu River at SH1
The Waiotu River is a hard sediment bottomed river derived from a predominantly agricultural catchment. The river originates from the hills to the northeast of State Highway one, between Kawakawa and Whāngārei, and runs into the Whakapara River to form the greater Wairua River.
The results from 2008-09 for the Waiotu River site are summarised in the table below. These include the median, range and percentage of sampling occasions that complied with the relevant guidelines. An asterisk in the table below denotes a median value outside the recommended guideline.
| Parameter | Median | Range | % comply with guideline |
| Temperature (deg. cel.) | 15.2 | 10.6 - 21.2 | |
| Dissolved oxygen (% Sat.) | 92* | 67.1 - 105.9 | 8 |
| Conductivity (mSm) | 9.6 | 8.9 - 10.9 | |
| Water clarity (m) | 0.71 | 0.39 - 1.6 | 82 |
| Turbidity (NTU) | 9.7* | 4.6 - 34 | 25 |
| E. coli (n/100mL) | 283.5 | 134 - 1850 | 75 |
| Dissolved reactive phosphorus (mg/L) | 0.022* | 0.01 - 0.031 | 18 |
| Total phosphorus (mg/L) | 0.067* | 0.024 - 0.212 | 8 |
| Ammoniacal nitrogen (mg/L) | 0.03* | 0.005 - 0.1 | 42 |
| Total nitrogen (mg/L) | 0.665* | 0.172 - 1.207 | 50 |
| pH | 7.1* | 6.6 - 7.3 | 42 |
This year's water quality results for the Waiotu River are similar to previous years with the medians for the majority of parameters not meeting their respective trigger values. Total phosphorus and dissolved oxygen compliance was significantly poor with only one sample out of 12 meeting their respective trigger values.
Trend analysis on data collected for this site suggests that there is a positive decreasing trend in nitrate nitrogen. This suggests that there has been a reduction in fertiliser use in the catchment. There is however, a negative increasing trend in turbidity. This increasing trend in turbidity indicates increased erosion in the catchment. Excluding stock from waterways and planting riparian margins will improve stream bank stability which will reduce sediment loading into waterways.
Oruru River
The Oruru River originates from the Otangaroa forest and flows north through indigenous forest and scrub. In the lower catchment, the river meanders through pastoral dominated land eventually flowing out into the Taipa River. Underlying geology is dominated by volcanic acidic rock, with some areas of soft sediments.
The results for 2008-09 for the Oruru River are summarised in the table below. These include the median, range and percentage of sampling occasions that complied with relevant guidelines. An asterisk in the table below denotes a median value outside the recommended guideline.
| Parameter | Median | Range | % comply with guideline |
| Temperature (deg. cel.) | 15.8 | 11.9 - 22.1 | |
| Dissolved oxygen (% Sat.) | 75.4* | 58.6 - 87.3 | 0 |
| Conductivity (mSm) | 16.8 | 13.1 - 18.4 | |
| Water clarity (m) | 0.6 | 0.5 - 0.8 | 67 |
| Turbidity (NTU) | 9.7* | 4 - 26 | 25 |
| E. coli (n/100mL) | 258 | 109 - 776 | 92 |
| Dissolved reactive phosphorus (mg/L) | 0.021* | 0.01 - 0.025 | 9 |
| Total phosphorus (mg/L) | 0.041* | 0.025 - 0.074 | 25 |
| Ammoniacal nitrogen (mg/L) | 0.010 | 0.005 - 0.03 | 92 |
| Total nitrogen (mg/L) | 0.193 | 0.052 - 0.313 | 100 |
| pH | 7.5 | 7 - 7.6 | 83 |
Water quality results for the Oruru River indicate that there are high turbidity and phosphorus levels. Dissolved oxygen concentrations are also poor as levels fell outside the trigger value range of 98 to 105% on all sampling occasions. The median of 0.021 mg/l for dissolved reactive phosphorus is well above the national river network median of 0.004 mg/l. Overall compliance is up slightly on last years results for E. coli, ammoniacal nitrogen and total nitrogen. This is probably due to a drier season.
Trend analysis cannot yet be undertaken for this site as there is insufficient data.
Awanui River at FNDC water take
The Awanui River originates from Raetea Forest (Mangamuka's) and meanders north for a significant distance through pasture and the Kaitāia Township, eventually flowing into the Rangunu Harbour. There are 3 sites in the network on the Awanui River system; one in the upper reaches on Victoria River, one in the mid reaches at the FNDC water take and one in the lower reaches directly above Waihue channel.
The FNDC water take from the Awanui River is adjacent to State Highway 1, just south of Kaitāia. Land use in the upstream catchment is predominantly pastoral, with some semi-forested tributaries, for example, the Victoria River. The river's geology is soft sediments.
The results from 2008-09 for the Awanui River at the FNDC water take are summarised in the table below. These include the median, range and percentage of sampling occasions that complied with relevant guidelines. An asterisk in the table below denotes a median value outside the recommended guideline.
| Parameter | Median | Range | % comply with guideline |
| Temperature (deg. cel.) | 15.2 | 11.4 - 21.7 | |
| Dissolved oxygen (% Sat.) | 83.4* | 70.8 - 91.6 | 0 |
| Conductivity (mSm) | 19.2 | 15 - 21.9 | |
| Water clarity (m) | 0.7 | 0.5 - 1 | 75 |
| Turbidity (NTU) | 8.8* | 3.4 - 29 | 25 |
| E. coli (n/100mL) | 283.5 | 84 - 2382 | 83 |
| Dissolved reactive phosphorus (mg/L) | 0.018* | 0.01 - 0.02 | 9 |
| Total phosphorus (mg/L) | 0.04* | 0.022 - 0.068 | 33 |
| Ammoniacal nitrogen (mg/L) | 0.02 | 0.01 - 0.03 | 88 |
| Total nitrogen (mg/L) | 0.291 | 0.072 - 0.462 | 100 |
| pH | 7.6 | 7.1 - 7.8 | 92 |
As for the previous two years, results from 2007-08 indicate that nitrogen concentrations at this site are satisfactory on most occasions, however dissolved oxygen, phosphorus and turbidity failed to meet their trigger values on eight or more sampling occasions. Some of these elevated results coincided with high flows and therefore are most likely the result of surface run-off from surrounding land during rainfall events.
Improved riparian management, for example, restricting stock access to waterways in this catchment will assist in improving water quality. Better maintenance of septic tanks in the catchment may also reduce contamination.
Trend analysis for 12 years of water quality data shows that there is a decreasing trend in dissolved reactive and total phosphorus at this site. These are all beneficial trends and may be the result of improved land management practices in the catchment.
Utakura River
The Utakura River is fed by Lake Omapere, to the north of Kaikohe, and flows west into the Waihou River arm of the Hokianga Harbour. The catchment is dominated by farmland with areas of native forest, pine forest and manuka scrub.
The results from 2008-09 for the Utakura River are summarised in the table below. These include the median, range and percentage of sampling occasions that complied with relevant guidelines. An asterisk in the table below denotes a median value outside the recommended guideline.
| Parameter | Median | Range | % comply with guideline |
| Temperature (deg. cel.) | 15.6 | 10.9 - 21.9 | |
| Dissolved oxygen (% Sat.) | 88.2* | 76.5 - 95.1 | 0 |
| Conductivity (mSm) | 10.9 | 9.4 - 12.2 | |
| Water clarity (m) | 0.66 | 0.45 - 0.08 | 55 |
| Turbidity (NTU) | 27.2* | 1 - 34 | 8 |
| E. coli (n/100mL) | 309 | 146 - 1106 | 92 |
| Dissolved reactive phosphorus (mg/L) | 0.011* | 0.005 - 0.026 | 45 |
| Total phosphorus (mg/L) | 0.058* | 0.045 - 0.092 | 0 |
| Ammoniacal nitrogen (mg/L) | 0.02 | 0.005 - 0.03 | 92 |
| Total nitrogen (mg/L) | 0.587 | 0.261 - 0.912 | 58 |
| pH | 7.1* | 6.8 - 7.3 | 17 |
The second year of results indicates that there are low oxygen and high turbidity and nutrient levels. Dissolved oxygen and total phosphorus results are similar to the previous year with all values failing to meet their trigger values on all sampling occasions. E. coli compliance is better than the previous year with only one sample exceeding the trigger value of 550 per/100ml, compared to four samples last year. This is consistent with bacterial results from other river network sites this year and is due to less rainfall this year.
Trend analysis cannot yet be undertaken for this site as there is insufficient data.
Mangahahuru Stream at Apotu Road
The Mangahahuru Stream, which begins in Pinus radiata forestry southeast of Hikurangi, is a small tributary of the Wairua River. Other than the exotic forestry in the headwaters, the catchment is predominantly agricultural land use, with an increasing number of lifestyle blocks. The underlying geology is hard sedimentary.
The results for 2008-09 for the Mangahahuru Stream at Apotu Road are summarised in the table below. These include the median, range and percentage of sampling occasions that complied with the relevant guidelines. An asterisk in the table below denotes a median value outside the recommended guideline.
| Parameter | Median | Range | % comply with guideline |
| Temperature (deg. cel.) | 15.9 | 10.9 - 22.1 | |
| Dissolved oxygen (% Sat.) | 96.5* | 70.2 - 117 | 8 |
| Conductivity (mSm) | 12.8 | 11.5 - 18.1 | |
| Water clarity (m) | 0.8 | 0.38 - 2.18 | 82 |
| Turbidity (NTU) | 7.4* | 4 - 17.7 | 25 |
| E. coli (n/100mL) | 619.5* | 175 - 1789 | 50 |
| Dissolved reactive phosphorus (mg/L) | 0.021* | 0.01 - 0.088 | 9 |
| Total phosphorus (mg/L) | 0.069* | 0.04 - 0.22 | 0 |
| Ammoniacal nitrogen (mg/L) | 0.025* | 0.005 - 0.07 | 50 |
| Total nitrogen (mg/L) | 0.692* | 0.107 - 0.934 | 33 |
| pH | 7.0* | 5.9 - 7.2 | 25 |
The medians for all parameters except one (water clarity) exceeded their trigger values this year which suggests water quality is poor in the Mangahahuru Stream. Single sample compliance was significantly poor for total phosphorus with all samples exceeding the trigger value of 0.033 mg/l. Dissolved oxygen levels are of particular concern, as there are large variations with the lowest observed reading being 70.2 mg/l and the highest being 117 mg/l. It is likely these variations are due to the dense oxygen weed beds.
The most likely source of contamination at this site is surface run-off from surrounding land, as spikes in contamination are associated with high river flows after rainfall events. Poorly maintained septic tanks, stock access to the stream and point source consented discharges, such as the Hikurangi Oxidation Pond, may also contribute. Further sampling is required to investigate this.
Trend analysis on data for the site indicates positive (improving) trends for dissolved reactive and total phosphorus in the Mangahahuru Stream. As phosphorus is associated with sediment particles, this indicates there is less erosion occurring in the catchment. However, there is a negative (increasing) trend in nitrate nitrogen but not in ammoniacal or total nitrogen which suggests fertiliser use is increasing.
Paparoa Stream
The Paparoa Stream is a soft sediment-bottomed stream, which is set in a catchment dominated by high production farmland, with pockets of pine forestry and native bush. The stream flows west into an arm of the Kaipara harbour. The site is located in the park in Paparoa Township.
The results from 2008-09 for Paparoa Stream are summarised in the table below. These include the median, range and percentage of sampling occasions that complied with relevant guidelines. An asterisk in the table below denotes a median value outside the recommended guideline.
| Parameter | Median | Range | % comply with guideline |
| Temperature (deg. cel.) | 15.3 | 11.1 - 21.3 | |
| Dissolved oxygen (% Sat.) | 91.6* | 65.1 - 108.9 | 25 |
| Conductivity (mSm) | 30.6 | 20.9 - 1114.7 | |
| Water clarity (m) | 0.72 | 0.58 - 1.38 | 75 |
| Turbidity (NTU) | 9.0* | 5.1 - 28 | 8 |
| E. coli (n/100mL) | 422.5 | 132 - 663 | 58 |
| Dissolved reactive phosphorus (mg/L) | 0.02* | 0.005 - 0.04 | 18 |
| Total phosphorus (mg/L) | 0.062* | 0.024 - 0.098 | 8 |
| Ammoniacal nitrogen (mg/L) | 0.02 | 0.005 - 0.04 | 67 |
| Total nitrogen (mg/L) | 0.647* | 0.193 - 1.095 | 42 |
| pH | 7.3 | 6.9 - 7.6 | 75 |
The results from 2008-09 indicate that the Paparoa Stream is affected by high turbidity, nutrient and E.coli concentrations. Dissolved oxygen is also an issue with levels exceeding the trigger value on nine sampling occasions. High algal biomass in the stream during the summer months is the most likely cause of low oxygen levels.
Total phosphorus and dissolved reactive phosphorus only complied one and two times, respectively, through the year. High phosphorus and turbidity levels indicate erosion is occurring in the catchment. Erosion control measures, such as fencing and planting riparian margins, need to be implemented to reduce sediment from entering the waterways.
Trend analysis cannot yet be undertaken for this site as there is insufficient data.
Mangere River at Knights Road
The Mangere River is a low-lying, sluggish tributary to the Wairua River, which flows through a mostly intensive agricultural catchment. The river begins as the Mangere Stream, which flows east out of the Pukenui forest near Whāngārei. It becomes a river on the flats before joining the Wairoa River just west of Kokopu. For the most part, soft sedimentary rocks make up the underlying geology.
The results from 2008-09 for the Mangere River are summarised in the table below. These include the median, range and percentage of sampling occasions that complied with the relevant guidelines. An asterisk in the table below denotes a median value outside the recommended guideline.
| Parameter | Median | Range | % comply with guideline |
| Temperature (deg. cel.) | 14.3 | 11 - 20 | |
| Dissolved oxygen (% Sat.) | 87.3* | 72.6 - 97.1 | 0 |
| Conductivity (mSm) | 16.6 | 15.7 - 17.5 | |
| Water clarity (m) | 1.1 | 0.56 - 1.78 | 92 |
| Turbidity (NTU) | 7* | 4.5 - 18 | 25 |
| E. coli (n/100mL) | 452 | 185 - 1046 | 67 |
| Dissolved reactive phosphorus (mg/L) | 0.058* | 0.005 - 0.143 | 9 |
| Total phosphorus (mg/L) | 0.104* | 0.044 - 0.219 | 0 |
| Ammoniacal nitrogen (mg/L) | 0.045* | 0.005 - 0.18 | 33 |
| Total nitrogen (mg/L) | 0.927* | 0.617 - 2.042 | 0 |
| pH | 7.2* | 6.6 - 7.4 | 50 |
Results from 2008-09 indicate that nutrient, turbidity and bacterial levels are often elevated in the Mangere River. Both total phosphorus and total nitrogen failed to meet their trigger values on all sampling occasions. Turbidity compliance is similar to the previous year with only three samples meeting the lowland river trigger value of <5.6 NTU. Like many RWQMN sites, dissolved oxygen levels are consistently below the trigger range.
On a positive note, E. coli levels are significantly lower than previous years with 67% of the samples complying with the trigger value, compared to only 17% last year. This is probably due to work been done in the catchment to reduce point source discharges from dairy farms.
Long term trend analysis for this site indicates some positive trends. These include decreasing ammoniacal nitrogen, nitrate/nitrite nitrogen, total nitrogen and total phosphorus and increasing water clarity. Again, reducing point source discharges and stream fencing has contributed to these trends.
Manganui River at Mitaitai Road
The Manganui is a major tributary into the Wairoa River, flowing from the western fringes of the Marertu forest to join the Wairoa just east of Dargaville. The river runs through extremely low gradient, predominantly pastoral land, with some exotic forestry blocks scattered through the catchment. The underlying geology at the site is soft sediments.
The results from 2008-09 for the Manganui River are summarised in the table below. These include the median, range and percentage of sampling occasions that complied with the relevant guidelines. An asterisk in the table below denotes a median value outside the recommended guideline.
| Parameter | Median | Range | % comply with guideline |
| Temperature (deg. cel.) | 16.2 | 11.6 - 23.9 | |
| Dissolved oxygen (% Sat.) | 81.7* | 57.8 - 118.1 | 8 |
| Conductivity (mSm) | 20.2 | 17.2 - 22.8 | |
| Water clarity (m) | 0.81 | 0.54 - 1.58 | 92 |
| Turbidity (NTU) | 13.1* | 6.2 - 21 | 0 |
| E. coli (n/100mL) | 74 | 20 - 669 | 92 |
| Dissolved reactive phosphorus (mg/L) | 0.039* | 0.005 - 0.073 | 9 |
| Total phosphorus (mg/L) | 0.083* | 0.036 - 0.144 | 0 |
| Ammoniacal nitrogen (mg/L) | 0.02 | 0.005 - 0.05 | 58 |
| Total nitrogen (mg/L) | 0.708* | 0.348 - 1.197 | 42 |
| pH | 7.4 | 6.9 - 8.5 | 67 |
This year's results indicate that the water quality in the Manganui River has been heavily impacted by surrounding land use. High levels of all nutrients, in particular dissolved reactive and total phosphorus, indicate that agricultural run-off is the source of contamination in the Manganui catchment.
Elevated levels of phosphorus are usually a sign that fertiliser, which has been applied to land, is not being absorbed by the soil but is being washing off the land during rainfall events and entering waterways. Another possible source of phosphorus is soil erosion in the riparian management zone. Better riparian management and more efficient fertiliser application would reduce the amount of phosphorus in waterways.
The median for E. coli was significantly lower this year compared with the previous year, 74 and 833, respectively.
Trend analysis on eight years of data for this site shows that there are no significant trends in any of the parameters.
Awanui River at Waihue Channel
This site is the lowest of three sites on the Awanui River system and is located directly downstream of the discharge from the Kaitāia oxidation ponds and upstream of the Waihue Channel. At this point, the Awanui River has flowed through more than 30km of agricultural land and the Kaitāia Township. The ‘River Environment Classification' identifies this site as a low elevation river with soft sediment geology and pastoral land use.
The results from 2008-09 for the Awanui River site at Waihue Channel are summarised in the table below. These include the median, range and percentage of sampling occasions that complied with the relevant guidelines. An asterisk in the table below denotes a median value outside the recommended guideline.
| Parameter | Median | Range | % comply with guideline |
| Temperature (deg. cel.) | 15.8 | 11.6 - 22.8 | |
| Dissolved oxygen (% Sat.) | 77.1 | 55.3 - 88.3 | 0 |
| Conductivity (mSm) | 20.3 | 15.5 - 23.1 | |
| Water clarity (m) | 0.6 | 0.4 - 0.8 | 58 |
| Turbidity (NTU) | 12.9 | 5. - 50 | 8 |
| E. coli (n/100mL) | 271 | 122 - 1317 | 75 |
| Dissolved reactive phosphorus (mg/L) | 0.037 | 0.02 - 0.059 | 0 |
| Total phosphorus (mg/L) | 0.083 | 0.045 - 0.156 | 0 |
| Ammoniacal nitrogen (mg/L) | 0.04 | 0.005 - 0.37 | 42 |
| Total nitrogen (mg/L) | 0.46 | 0.173 - 1.172 | 67 |
| pH | 7.6 | 7.1 - 8 | 67 |
The results from 2008-09 indicate that water quality at this site on the Awanui River is severely impacted. The medians for dissolved oxygen (% saturation), water clarity, turbidity, total nitrogen, and dissolved reactive and total phosphorus did not meet their respective guidelines.
Consistently high phosphorus levels at this site are of particular concern. The source of this phosphorus is likely to be run-off from pastoral land use within the catchment but the Kaitāia oxidation pond discharge directly upstream could also be a source.
Long term trend analysis at this site indicates that turbidity, dissolved reactive phosphorus, total phosphorus and ammoniacal nitrogen are all declining. However, there is a significant increasing trend in conductivity.
Ruakaka River at Flyger Road
The Ruakaka River catchment is relatively small and runs east from Ruakaka forest to Bream Bay. The catchment is dominated by pastoral land with areas of the upper catchment native bush. The underlying geology at the site is mainly soft sediments.
The results from 2008-09 for the Ruakaka River are summarised in the table below. These include the median, range and percentage of sampling occasions that complied with the relevant guidelines. An asterisk in the table below denotes a median value outside the recommended guideline.
| Parameter | Median | Range | % comply with guideline |
| Temperature (deg. cel.) | 13.9 | 11 - 19.1 | |
| Dissolved oxygen (% Sat.) | 83.8* | 71.2 - 88.7 | 0 |
| Conductivity (mSm) | 21.8 | 19.5 - 23.5 | |
| Water clarity (m) | 0.5 | 0.37 - 0.78 | 17 |
| Turbidity (NTU) | 24* | 14 - 29 | 0 |
| E. coli (n/100mL) | 341 | 148 - 1539 | 83 |
| Dissolved reactive phosphorus (mg/L) | 0.09* | 0.056 - 0.123 | 0 |
| Total phosphorus (mg/L) | 0.162* | 0.116 - 0.216 | 0 |
| Ammoniacal nitrogen (mg/L) | 0.04* | 0.02 - 0.2 | 25 |
| Total nitrogen (mg/L) | 0.912* | 0.622 - 1.828 | 0 |
| pH | 7.3 | 6.9 - 7.5 | 75 |
This year the Ruakaka River has been ranked as the worse river in the network as it is a highly impacted river, with poor water clarity and high nutrient levels. Results from 2008-09 indicate that dissolved oxygen (%), turbidity, water clarity, nitrogen and phosphorus levels are above their recommended guideline values on most sampling occasions.
Trend analysis cannot yet be undertaken for this site as there is insufficient data.