Results
Results from 2008
Pfankuch Stability Index
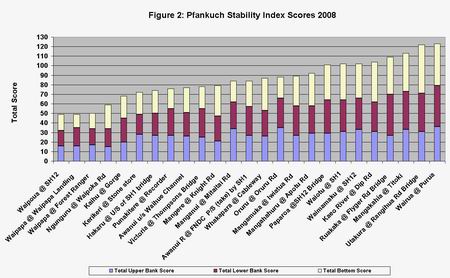
Figure 2 shows the total Pfankuch Stability Score, broken down into upper bank, lower bank and bottom scores, for all sites assessed in 2008. Sites are ranked from lowest score (most stable habitat) to highest score (least stable habitat).
Of the 25 sites assessed in 2008, none had excellent stability (a score of less than 38); eight sites had good stability (39-76), 15 sites had fair stability (77-114) and two sites had poor stability (>115).
The three most stable sites were Waipoua (49), Waipapa at Waipapa Landing (49) and Waipapa at Forest Ranger (50). The two least stable sites were Utakura (122) and Wairua (123).
Habitat Quality
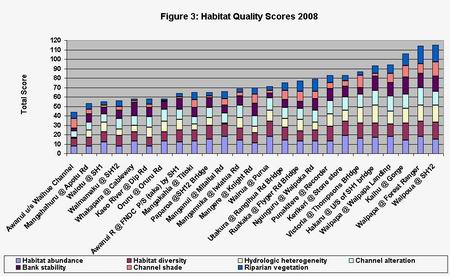
Figure 3 shows total habitat quality scores, broken down into component parts, for all sites assessed in 2008. Sites are ranked from lowest score (poorest habitat) to highest score (best habitat).
Of the 25 sites assessed in 2008, none had a poor habitat (a score of less than 38), 14 sites had a marginal habitat (39-73), nine sites had a sub-optimal habitat (74-108) and two sites, Waipapa at Forest Ranger and Waipoua, had an optimal habitat (109-140).
Results from 2010
Pfankuch Stability Index
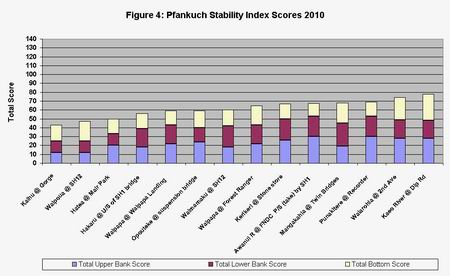
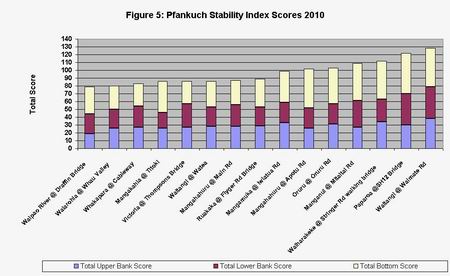
Figures 4 and 5 show the total Pfankuch Stability Score, broken down into upper bank, lower bank and bottom scores, for all sites assessed in 2010. Sites are ranked from lowest score (most stable habitat) to highest score (least stable habitat).
Six sites – Utakura, Ngunguru, Awanui at Waihue channel, Waiotu, Mangere and Wairua - could not be waded due to depth. These sites do not have bottom data and it was therefore not possible to calculate a stability score for these sites in 2010.
Of the sites assessed, no sites had excellent stability; 13 sites had good stability, 14 sites had fair stability and two sites had poor stability.
The two most stable sites in 2010 were Kaihu (43) and Waipoua (47). In comparison, the two most stable sites in 2008 were Waipoua (49) and Waipapa at Waipapa Landing (49). Kaihu was the fifth most stable site in 2008 with a score of 68 and so appears to have become more stable over the past two years. Waipapa at Waipapa Landing was fifth most stable in 2010 with a score of 59 and so appears to be slightly less stable in 2010.
The two least stable sites in 2010 were Waitangi at Waimate (128), followed by Paparoa (122). In comparison, the two least stable sites in 2008 were Wairua and Utakura. Neither of these sites could be graded in 2010 and so a comparison between years cannot be made.
Habitat Quality
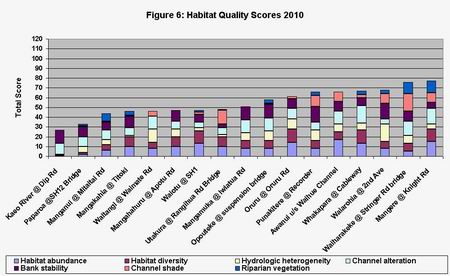
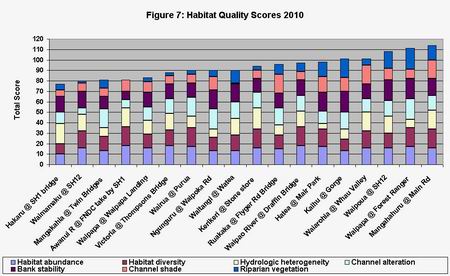
Figures 6 and 7 show total habitat quality scores, broken down into component parts, for all sites assessed in 2010. Sites are ranked from lowest score (poorest habitat) to highest score (best habitat).
Of the 35 sites assessed in 2010, two had poor habitat quality, 13 sites had a marginal habitat, 18 sites had a sub-optimal habitat and two sites had an optimal habitat.
The two sites with optimal habitat in 2010 were Mangahahuru at Main Road (114) and Waipapa at Forest Ranger (111). In 2008, the two best sites were Waipoua (115) and Waipapa at Forest Ranger (114). Changes in habitat quality at these two sites appear to have been negligible over the last two years, even though the site on the Waipoua River has fallen one grading from optimal to sub-optimal. The Mangahahuru at Main Road was not assessed in 2008 and so a comparison of scores at this site cannot be made.
The two poorest sites in 2010 were the Kaeo River (27) and Paparoa (33). In 2008, the two worst sites were Awanui at Waihue Channel (44) and Mangahahuru at Apotu Road (53). Awanui at Waihue was graded thirteenth poorest in 2010 with a score of 66. This indicates that habitat quality at this site has improved slightly in the last two years. Mangahahuru at Apotu Road was graded sixth poorest in 2010 with a score of 47. The difference between the score in 2008 and 2010 is negligible suggesting there has been little change in habitat quality at this site in the last two years.
In 2008, Kaeo was graded sixth poorest with a score of 58. This indicates that habitat quality has deteriorated at this site over the last two years. In 2008, Paparoa was graded tenth poorest with a score of 65. This indicates that habitat quality at this site has also deteriorated over the last two years.
Site Data Summary 2010
Data collected in 2010 from 35 sites monitored indicates that:
- 20 sites are open to livestock access
- 18 have over 50% bank stability
- 17 have under 50% bank stability
- Five out of 29 sites have a soft bottom sediment
- 13 out of 29 sites have a hard bottom; and
- 11 have a mixed bottom sediment
A full summary of these results can be seen in Appendix 3.
Of the two sites with a habitat quality grade of optimal, one had good stability and one had fair stability. Of the 15 sites with a habitat quality grade of sub-optimal, nine had good stability and six had fair stability. This indicates that sites with good habitat quality are those that are more stable.
Of the ten sites with a habitat quality grade of marginal, three had good stability, six had fair stability and one had poor stability. Of the two sites with a habitat quality grade of poor, one had poor stability and one had fair stability. This indicates that sites with poorer habitat quality are those that are less stable.
Emerging trends
Pfankuch Stability Index
Figures 8, 9, 10 and 11 show Pfankuch Stability Index Scores for sites that have three or more years' data. The method for surveying stream stability is subjective and so minor variations in score from year to year may be as a result of surveyor bias.
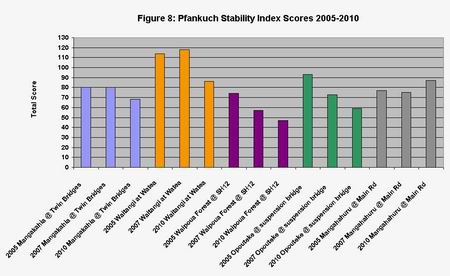
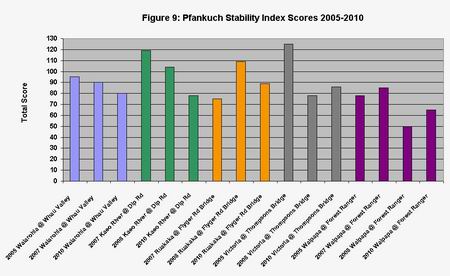
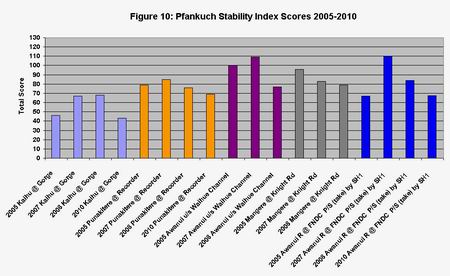
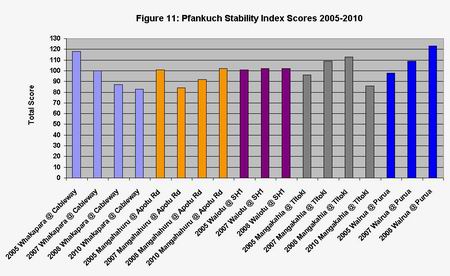
Overall, since 2005, the stability of 13 sites appears to have improved; the stability of three sites, Ruakaka River, Wairua River and Mangahahuru at Main Road, appears to have decreased and the stability of four sites, Mangahahuru at Apotu Road, Kaihu River, Awanui at FNDC water take and Waiotu River – appears to be stable.
Seven sites have moved up or down a grade. Two sites have gone from fair to good stability in the last four to five years - Awanui at Waihue and Opouteke River. Four sites have gone from poor to fair stability in the last four to five years – Whakapara River, Kaeo River, Waitangi at Watea and Victoria River. One site – Wairua River - has gone from fair to poor stability in the last four years.
Habitat Quality
Figures 12, 13, 14 and 15 show habitat quality data for sites that have three or more years' data. The method for surveying habitat quality is highly subjective and so minor variations in score from year to year may be as a result of surveyor bias.
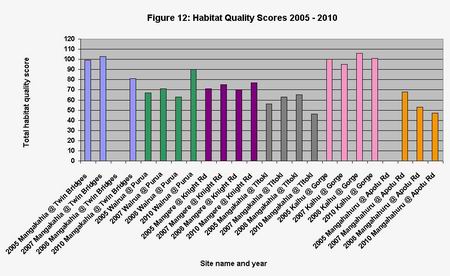
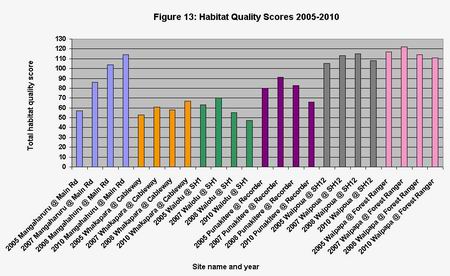
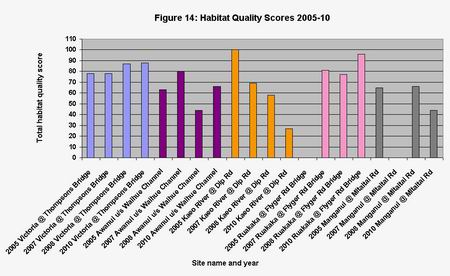
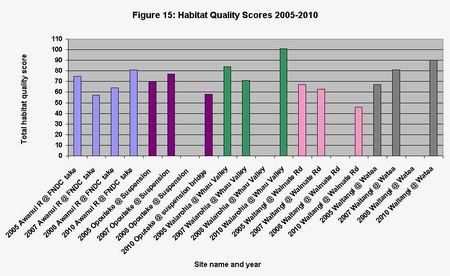
Overall, since 2005, the habitat at nine sites appears to have increased in quality; the habitat at ten sites appears to have decreased in quality and habitat quality at three sites has remained relatively stable.
Significant changes appear to have occurred in the Kaeo River (downward trend from sub-optimal to poor habitat quality), Mangahahuru at Main Road (upward trend from marginal to sub-optimal), Waitangi at Watea (upward trend from marginal to sub-optimal), Wairua (upward trend from marginal to sub-optimal), Ruakaka (downward trend from sub-optimal to marginal) and Punakitere (downward trend from sub-optimal to marginal).
Discussion
The table below is a composite of ranking results from the Habitat Assessment work undertaken in 2010, water quality results taken from the Annual River Water Quality Report 2008-09 (no ranking was undertaken in 2009-10) and macroinvertebrate rankings taken from the Northland Macroinvertebrate Monitoring Programme Report 2010. These results, when compared, allow for a fuller interpretation of results from all three programmes.
|
Site Name |
Habitat Quality |
Pfankuch Stability Index |
Water Quality |
Number of taxa |
MCI and SQMCI Scores |
|
Mangahahuru at Main Road |
1st |
21st |
12th |
8th |
3rd / 2nd |
|
Waipapa at Forest Ranger |
2nd |
8th |
2nd |
5th |
6th / 6th |
|
Waipoua |
3rd |
2nd |
1st |
1st |
2nd / 1st |
|
Waiarohia at Whau Valley |
4th |
16th |
21st |
3rd |
10th / 11th |
|
Kaihu |
5th |
1st |
3rd |
6th |
18th / 26th |
|
Hatea |
6th |
3rd |
16th |
23rd |
22nd / 8th |
|
Waipao |
7th |
15th |
19th |
20th |
9th / 7th |
|
Ruakaka |
8th |
22nd |
35th |
25th |
1st / 5th |
|
Kerikeri |
9th |
9th |
9th |
26th |
29th / 14th |
|
Waitangi at Watea |
10th |
20th |
8th |
22nd |
34th / 34th |
|
Ngunguru |
11th |
N/A |
22nd |
32nd |
20th / 12th |
|
Wairua |
12th |
N/A |
24th |
30th |
21st / 32nd |
|
Victoria |
13th |
19th |
7th |
7th |
7th / 17th |
|
Waipapa at Waipapa Landing |
14th |
5th |
10th |
24th |
31st / 9th |
|
Awanui at FNDC take |
15th |
10th |
28th |
10th |
14th / 16th |
|
Mangakahia at Twin Bridges |
16th |
11th |
4th |
17th |
16th / 22nd |
|
Waimamaku |
17th |
7th |
5th |
12th |
15th / 21st |
|
Hakaru |
18th |
4th |
23rd |
9th |
24th / 25th |
|
Mangere |
19th |
N/A |
32nd |
19th |
28th / 27th |
|
Waiharakeke |
20th |
27th |
25th |
16th |
8th / 3rd |
|
Waiarohia at Second Ave |
21st |
13th |
13th |
11th |
26th / 18th |
|
Whakapara |
22nd |
17th |
17th |
21st |
17th / 23rd |
|
Awanui at Waihue Channel |
23rd |
N/A |
34th |
29th |
32nd / 30th |
|
Punakitere |
24th |
12th |
17th |
13th |
19th / 15th |
|
Oruru |
25th |
25th |
27th |
31st |
33rd / 31st |
|
Opouteke |
26th |
6th |
6th |
14th |
12th / 24th |
|
Mangamuka |
27th |
18th |
11th |
4th |
4th / 4th |
|
Utakura |
28th |
N/A |
29th |
33rd |
13th / 20th |
|
Waiotu |
29th |
N/A |
26th |
28th |
35th / 35th |
|
Mangahahuru at Apotu Rd |
30th |
24th |
30th |
15th |
30th / 28th |
|
Waitangi at Waimate |
31st |
29th |
14th |
2nd |
11th / 13th |
|
Mangakahia at Titoki |
32nd |
18th |
20th |
18th |
5th / 19th |
|
Manganui |
33rd |
26th |
33rd |
34th |
27th / 33rd |
|
Paparoa |
34th |
28th |
31st |
35th |
25th / 29th |
|
Kaeo |
35th |
14th |
15th |
27th |
23rd / 10th |
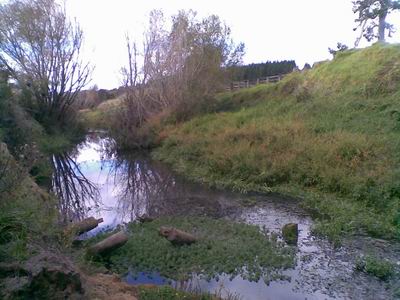
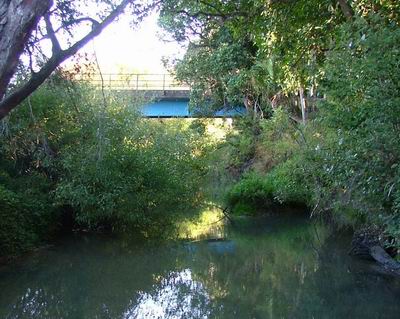
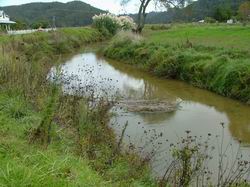 Kaeo River, upstream view. The Kaeo River is subject to frequent flooding events, erosion/cutting and deposition. It is likely that these events have had an impact on habitat quality at this site. Some parts of the Kaeo River are also open to stock access, which may have an impact on habitat quality. Habitat quality has fallen from sub-optimal to poor in the last five years.
However, the site has fair stability and stability appears to have improved in the last five years from poor in 2005. This may be due to channel stabilisation work that has been undertaken on the river for flood prevention purposes. Habitat quality will take longer to recover than channel stability and may not improve unless riparian fencing and planting is undertaken, to reduce the effect of livestock on riparian vegetation.
There is currently insufficient water quality data for this site to complete formal trend analysis however, no trends are apparent in the data collected to date. The site ranks number 27th out of 35 for macroinvertebrate species richness (number of species present), which would be a reflection of poor habitat quality and availability and lack of channel shading. It has an MCI and SQMCI value that indicate moderate levels of pollution.
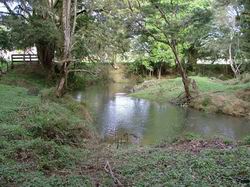 Mangahahuru at Main Road. The site on the Mangahahuru at Main Road is within an area of native bush and is fenced from livestock access, although livestock do occasionally access this area. The surrounding land-use is exotic forestry and pasture. There is some bank cutting and erosion of the bends in the river however the banks are relatively stable. Habitat quality has risen from marginal to optimal in the last five years and the site has fair stability. The improvement in habitat quality may be a reflection of a more stable channel and low-intensity land-use in the upper catchment. It may also be a reflection of maturing riparian vegetation and an increase in channel shading.
Time trend analysis of data collected for this site indicates an increasing trend in turbidity. However, water quality is generally good. The site ranks eighth for macroinvertebrate species richness and eighth for %EPT, which is a reflection of good habitat quality and good channel shading. The site has an MCI and SQMCI that indicate clean water and the site ranks third and second respectively in these categories.
This site is in the upstream catchment of the Mangahahuru River, which feeds into the Wairua River. In comparison, the site further downstream at Apotu Road has marginal habitat quality and fair stability. This site ranks 15th for macroinvertebrate species richness and 29th for % EPT. The site has an MCI and SQMCI that indicates severe pollution, which is a reflection of the more intensive pastoral land-use in the downstream catchment of this river.
 Mangahahuru at Apotu Road.
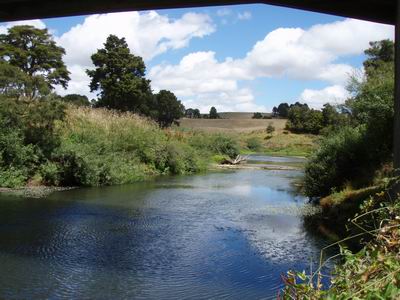
The Waitangi at Watea site is above the Haruru Falls, in a small area of bush, towards the bottom of the Waitangi River catchment. The site is not open to livestock access. Habitat quality has risen from marginal to sub-optimal in the last five years at the site. The site has fair stability.
 Waitangi at Watea. Time trend analysis on water quality data collected from this site indicates an increasing trend in dissolved oxygen and pH and a decrease in total phosphorus and dissolved reactive phosphorus. These trends suggest an improvement in water quality.
However, the site ranks 22nd for macroinvertebrate species richness and 33rd for %EPT. The site has an MCI and SQMCI score indicating severe pollution. Although this site ranks highly for habitat quality and has good water quality, in-stream habitat was greatly affected by flooding three years ago. A high proportion of in-stream habitat and bank-side vegetation was lost from the site and the macroinvertebrate community would have been greatly reduced. Scouring of the river bed also created deep pools, which are less attractive to certain macroinvertebrate fauna. It will take time for the habitat to recover and for macroinvertebrates to re-colonise suitable habitat at this site.
In comparison, the site upstream at Waimate Road has marginal habitat quality and poor channel stability. Water quality at this site is moderate. However, the site ranks second for macroinvertebrate species richness. It has an MCI and SQMCI score that indicate mild and moderate pollution respectively. This site is in an area of intensive pastoral farming and is open to livestock access, with little shading, however a variety of in-stream habitats, including woody debris, silts and gravels; riffles, pools and runs increase the taxonomic richness.
 Waitangi at Waimate.
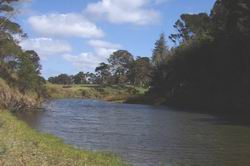
The Wairua River catchment is large with several rivers draining into it, including the Mangahahuru and Whakapara. The catchment comprises mixed, intensive land-use but at the sampling site, surrounding land-use includes native bush and pastoral farming. The site assessed is open to livestock access and has 20% channel shading. Habitat quality at this site has gone from marginal to sub-optimal in the last five years. However, channel stability has gone from fair to poor in the same time.
Time trend analysis of data collected from the site indicates an increase in conductivity, dissolved oxygen, pH and clarity and a decrease in nutrients. This suggests that water quality is improving at the site.
The site ranks 30th for macroinvertebrate species richness and 24th for %EPT. The MCI and SQMCI score indicate moderate and severe pollution respectively.
 Wairua River.
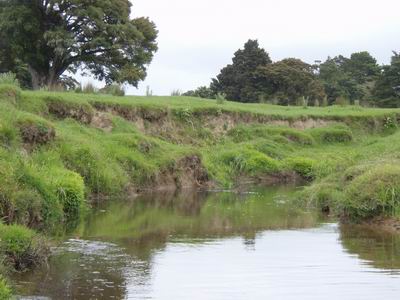
The Ruakaka River catchment is relatively small and land-use is largely pastoral farming, with areas of native bush in the upper catchment. The site assessed is not open to livestock access and has 90% channel shading. Habitat quality has declined from sub-optimal to marginal in the last five years. Channel stability is fair.
Time trend analysis has not been undertaken on water quality data for this site. Water quality is generally very poor, with the site ranked worst for water quality out of 35 sites monitored in 2008-09.
The site ranks 25th for macroinvertebrate species richness but third for %EPT. The site has an MCI that indicates clean water and an SQMCI that indicates mild pollution. These results appear contradictory however the sampling methodology used at this site favours the high scoring taxa found in woody debris and so this pushes the MCI and SQMCI scores up, even though the species richness is low. These scores should therefore be used with caution.
 Ruakaka River.
The Punakitere River is a major tributary of the Waima River that flows into the Hokianga Harbour. The catchment of this site is largely pastoral and the site has 60% channel shading and is open to livestock. Habitat quality at this site has declined in the last five years from sub-optimal to marginal. Channel stability is good.
Time trend analysis carried out on water quality data for the site indicates increasing water clarity and pH and a decrease in nutrients. However, water quality at this site is still impacted by intensive land-use and is generally poor.
The site ranks 13th for macroinvertebrate species richness and 19th for %EPT. The MCI score for the site indicates moderate pollution and the SQMCI score indicates severe pollution. Both of these scores show a progressive downward trend over the last ten years indicating a decline in macroinvertebrate species at this site.
The decline in habitat quality may be due to storm events changing the channel dynamics, or may be due to damage caused by livestock access. More work needs to be done to investigate declining habitat quality and macroinvertebrate species at this site.