Methodology
Habitat assessment methodology
The habitat assessment protocol used by the council is both a qualitative (quality of the habitat) and quantitative (occurrence of each habitat) assessment of environmental factors at each site, such as channel stability, periphyton abundance, riparian vegetation, the composition of organic and inorganic substrate in the stream and surrounding land-use (see Appendix 1 – Habitat Assessment Field Data Sheet). The protocol used is based on Pfankuch D. J. (1975), ‘Stream Reach Inventory and Channel Stability Evaluation'.
Qualitative assessment
Sites are assessed every two years. The procedure involves visiting the same location at each site to assess the environmental factors in the immediate vicinity of the site. An upstream and downstream transect of the stream channel from this site is walked, with quantitative assessments made every five metres or where a new feature is observed, e.g. a pool.
The qualitative habitat assessment involves assigning scores to the following stream characteristics: aquatic habitat abundance, aquatic habitat diversity, hydrologic heterogeneity, channel alteration, bank stability, channel shade, and riparian vegetation. Scores for each characteristic range from 0 to 20, with a lower total score indicating a lower habitat quality. Habitat quality is divided into four categories as shown in Table 1.
| Habitat quality | Score |
| Optimal | 109 ≤ score ≤ 140 |
| Sub-optimal | 74 ≤ score ≤ 108 |
| Marginal | 39 ≤ score ≤ 73 |
| Poor | score < 39 |
Table 1: Habitat qualitative assessment scoring system
Periphyton type and abundance is recorded in four types: diatom, mat algae, filamentous algae, and bryophytes, with abundance classified as none, rare, common, or abundant. The same scoring system is used to assess the presence of submerged aquatic plants (i.e. macrophytes).
Quantitative assessment
The quantitative habitat assessment also involves walking an upstream/downstream transect of the stream channel, with recordings made at a number of stops. Variables recorded include canopy and understorey cover within 0 to 5 metres and 5 to 20 metres of the stream bank; stability and bank type of each bank; inorganic and organic substrate on the bottom of the stream; wetted width (edge of water on one bank to edge of water on opposite bank); maximum depth of channel and flow type.
Pfankuch stability index
Stability of the streambed and channel at each site is assessed using the Pfankuch stability index (Pfankuch, 1975). This involves assigning scores to 15 environmental variables (such as bank wasting, deposition, stability of stream bed, etc.). The variables are split into upper bank, lower bank and stream bottom.
The scores are summed and can range from 38 to 152, where a lower total score indicates a more stable stream channel. Indexes are broken down in four categories as shown in Table 2 below.
| Stability index | Score |
| Excellent | score < 39 |
| Good | 39 ≤ score ≤ 76 |
| Fair | 77 ≤ score ≤ 114 |
| Poor | score >114 |
Table 2: Pfankuch stability index scoring system
Other factors noted include evidence of livestock access, channel shading, water odour and other observations of interest. Water quality is also measured and includes water temperature, dissolved oxygen, conductivity and water clarity.
Other sampling data
In addition to the habitat assessments, macroinvertebrate data is collected for each site annually. Although this sampling programme runs independently from the habitat assessment, data collected through the macroinvertebrate programme can be used to help interpret results from the habitat assessment and vice versa. Both programmes are carried out during the summer months.
Macroinvertebrate sampling involves collecting benthic (bottom) samples from each site to record the number and type of macroinvertebrates present. Sites are characterised according to whether they have a hard or soft bottom river bed, with appropriate sampling protocols used for each type.
The number of species present (taxonomic richness) at each site is recorded, along with the percentage of Ephemeroptera (Mayfly), Plecoptera (stonefly) and Trichoptera (caddisfly) (% EPT). The more species present, the higher the conservation value of each site.
Each site is also given a Macroinvertebrate Community Index (MCI) and a Semi-Quantitative (SQ) MCI score, which reflect the species present and their tolerance to environmental changes and human activity, and the number of individuals belonging to each taxon. The higher the score, the less impacted the environment is by human activity. The lower the score, the more impacted a site is.
Sampling sites
The sites assessed by the council are those included in the Regional River Water Quality Monitoring Network (RWQMN). There are currently 35 sites in the network; 31 of which are monitored by the council and four by the National Institute of Water and Atmospheric Research (NIWA) (shown in pink in Figure 1).
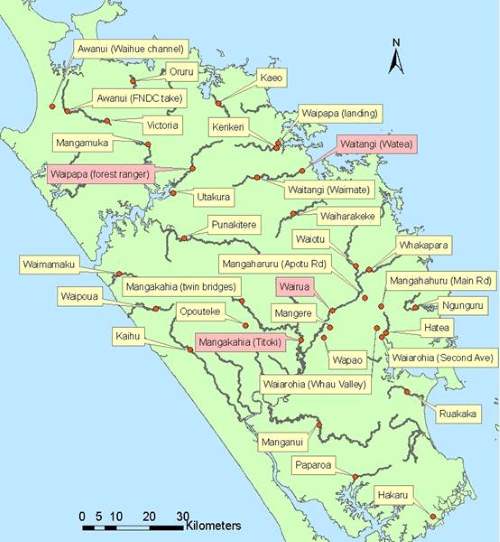
Figure 1: Map showing the 35 Regional Water Quality Monitoring Network sites (National River Water Quality Network sites in pink)
Sites have been gradually added to the RWQMN since monitoring first began in 1996. In 2005, 19 sites had habitat assessments completed. In 2007, 22 sites were assessed; in 2008, 25 sites were assessed and in 2010 and 2012, 35 sites were assessed. The sites are listed in Table 3 below.
| Year Assessed | ||||||
| Site Name | Site No. | 2005 | 2007 | 2008 | 2010 | 2012 |
| Awanui 1 at FNDC take | 100363 | Y | Y | Y | Y | Y |
| Awanui 2 at Waihoe Channel | 100370 | Y | Y | Y | Y | Y |
| Hakaru at Topuni Creek Farm | 109021 | Y | Y | Y | ||
| Hatea at Mair Park | 100194 | Y | Y | |||
| Kaeo River at Dip Rd | 102674 | Y | Y | Y | Y | |
| Kaihu at Gorge | 102256 | Y | Y | Y | Y | Y |
| Kerikeri at Stone Store | 101530 | Y | Y | Y | ||
| Mangahahuru 1 at Main Rd | 100237 | Y | Y | Y | Y | |
| Mangahahuru 2 at Apotu | 100281 | Y | Y | Y | Y | Y |
| Mangakahia 1 at Titoki | 101038 | Y | Y | Y | Y | Y |
| Mangakahia 2 at Gorge | 109096 | Y | Y | Y | Y | |
| Mangamuka at Iwiatua Rd | 108978 | Y | Y | Y | ||
| Manganui at Mititai Rd | 102257 | Y | Y | Y | Y | |
| Mangere at Knight Rd | 101625 | Y | Y | Y | Y | Y |
| Ngunguru at Waipoka Rd | 109100 | Y | Y | |||
| Ngunguru at Coalhill Lane | 110603 | Y | ||||
| Opouteke at Suspension Bridge | 102258 | Y | Y | Y | ||
| Oruru at Oruru Rd | 108979 | Y | Y | Y | ||
| Paparoa at Walking bridge | 108977 | Y | Y | Y | ||
| Punakitere at Loop Rd bridge | 105231 | Y | Y | Y | Y | Y |
| Ruakaka at Flyger Rd | 105008 | Y | Y | Y | Y | |
| Utakura at 177 Horeke Rd | 109020 | Y | Y | Y | ||
| Victoria at Thompson's Bridge | 105532 | Y | Y | Y | Y | Y |
| Waiarohia 1 at 2nd Avenue | 105672 | Y | Y | Y | ||
| Waiarohia 2 at Whau Valley | 107773 | Y | Y | Y | Y | |
| Waiharakeke at Stringer Rd | 100007 | Y | Y | |||
| Waimamaku at SH12 | 109098 | Y | Y | Y | ||
| Waiotu at SH1 | 102248 | Y | Y | Y | Y | Y |
| Waipao at Draffin Rd Bridge | 108941 | Y | Y | |||
| Waipapa 1 at Waipapa Landing | 101524 | Y | Y | Y | ||
| Waipapa 2 at Forest Ranger | 101751 | Y | Y | Y | Y | Y |
| Waipoua at SH12 | 103304 | Y | Y | Y | Y | Y |
| Wairua at Purua | 101753 | Y | Y | Y | Y | Y |
| Waitangi 1 at Watea | 101752 | Y | Y | Y | Y | |
| Waitangi 2 at Waimate | 103178 | Y | Y | Y | Y | |
| Whakapara at Cableway | 102249 | Y | Y | Y | Y | Y |
Table 3: RWQMN sites and years sampled
Sampling period
Comprehensive habitat assessments are carried out at all sites at the same time or as close as possible to the macroinvertebrate sample collection undertaken by the council. This means that habitat assessment data can be used when interpreting the results from macroinvertebrate sample collection at each site.
In 2008, assessments were undertaken from the end of March to the start of April. In 2010, they were undertaken from mid-January to mid-April, and in 2012 from mid-February to the end of March.
Data analysis
The data collected in 2010 and 2012 has been analysed using Microsoft Excel to compare the substrate, vegetation, stability, and overall habitat quality between sites.
In addition, total Pfankuch stability scores and habitat quality scores for each site from 2005, 2007, 2008, 2010 and 2012 have been compared, in order to identify any changes over time.
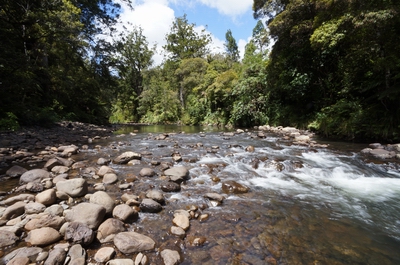 Photo 2: Waipoua River, upstream view.