Discussion
A composite of ranking results from the habitat assessment carried out in 2012 and the macroinvertebrate rankings – using the Macroinvertebrate Community Index (MCI) – from the Northland Macroinvertebrate Monitoring Programme 2012 Report are displayed in Table 6. The results complement one another allowing for a fuller interpretation of results from the two programmes.
Table 6: Results comparison – habitat quality, stability and MCI 2012
When comparing site rankings from the results of the different river assessments, i.e. habitat quality, habitat stability and MCI, clear differences appear. Disparities between the habitat quality and habitat stability assessments seemed to be limited, although the macroinvertebrate assessment showed instances of significant disparities with habitat quality.
The macroinvertebrate community index is used as an indicator of water quality and/or habitat quality and so there is value in comparing MCI and habitat quality scores, especially because the two programmes are carried out during the same period. However, it is important to mention that results should be interpreted with caution as rivers' ecological and biological conditions are dynamic and are influenced by a wide range of factors that are not necessarily measured or taken into account in these assessments.
The MCI scoring system is broken down into four categories listed in Table 7 below.
| Water/habitat quality | Score |
| Clean water | 120 ≤ score |
| Possible mild pollution | 100 ≤ score ≤ 119 |
| Probable moderate pollution | 80 ≤ score ≤ 99 |
| Probable severe pollution | score < 80 |
Table 7: Macroinvertebrate Community Index scoring system
A number of sites showed significant differences between the habitat quality and MCI assessments. Starting from the bottom of Table 6, the MCI score for the Kaeo River in 2012 was 103.3 (possible mild pollution) and was ranked ninth among the 35 rivers monitored in the region. This contrasts with its 34th position for habitat quality in the same year.
Kaeo River
The Kaeo River site is characterised by a soft bottom constituted by sediment including silt and/or sand, a quasi-inexistent riparian canopy cover, and a surrounding land-use dominated by pastoral activity as illustrated in Photo 3. The river is subject to frequent flooding, and bank erosion and deposition. Some parts of the Kaeo River – excluding the sampling site – are also open to livestock, which together with the flood and erosion problems impact on habitat quality. The site grade has fallen from marginal to poor in the last five years.
In regards to habitat stability Kaeo has had fair stability from 2008 to 2012 since it improved from 2007 (poor stability). This may have been influenced by channel stabilisation work that was undertaken on the river for flood prevention purposes. Habitat quality will take longer to recover than channel stability and may not improve unless riparian fencing and planting is undertaken to reduce the effect of livestock on river banks, riparian vegetation and therefore water quality.
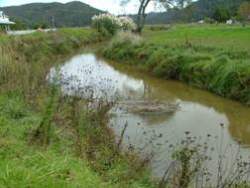 Photo 3: Kaeo River, upstream view.
Waitangi River
Similarly, the Waitangi River at Waimate (Waitangi 2) also presented significant differences between habitat quality and MCI results. In 2012 the site recorded a MCI of 113.8, (possible mild pollution) and ranked fourth out of 35 sites. In contrast, the site had a marginal habitat quality grade and ranked 27th out of 35 the same year.
The site is characterised by a soft bottom constituted by sediment including silt and/or sand and fine gravel, a quasi-inexistent riparian canopy cover, and a surrounding land-use dominated by pastoral activity. The river is subject to frequent erosion/cutting and deposition. It is likely that the combination of the physical characteristics and these events impact on habitat quality at this site. The site has remained with a marginal habitat quality within the last seven years.
The river is also open to livestock and has been evaluated with poor stability since the programme began in 2005. The Waitangi catchment has been classified as a "priority catchment" under the council's National Policy for Freshwater Management (NPS) work programme. As a result, community and farmer driven land management initiatives aimed at improving water quality will be undertaken in this catchment in the future.
In general, water and habitat quality degrade going further downstream. However at the Waitangi at Watea (Waitangi 1) site – located downstream of Waitangi 2 – there was a better habitat quality score but a lower MCI score of 65.2 (probable severe pollution)ranking 31st among the 35 sites.
In terms of physical characteristics obvious differences between the sites also occur as illustrated in Photo 4 and Photo 5 below. Unlike the upstream site, Waitangi 1 is characterised by a mixed bottom constituted by soft material including silt and sand but also hard material including cobble, boulder and bedrock. The surrounding land-use is lifestyle, riparian canopy cover is average and livestock do not have access to the river. The MCI score difference suggests degradation has occurred between the two sites. Water quality trend analysis (available in a separate report in early 2013) – found that phosphorus levels are increasing in the river. This could be explained by on-going sediment discharges from a large slip higher up in the catchment and bank erosion. Despite this the site has been moving from marginal to sub-optimal habitat quality. Habitat stability at Watea is also different from the upstream site as the river bed and banks are composed of more stable material and are less prone to degradation.
 Photo 4: Waitangi (2) River at Waimate.
 Photo 5: Waitangi (1) River at Watea.
Waipapa Stream
Another example of significant differences in MCI and habitat stability and quality scores is for Waipapa at Waipapa Landing Bridge (Waipapa 1). In 2012 the site recorded a MCI sore of 68.1 (probable sever pollution) and ranked 29th among 35. However, the site had a sub-optimal habitat quality grade and ranked ninth the same year.
The river channel is characterised by a hard bottom of bedrock, boulders and cobbles. The surrounding land-use is a mix of native scrub, lifestyle and urban areas, and there is no livestock accessing the river. Riparian canopy cover is average as illustrated in Photo 6 below. A combination of poor hydrologic heterogeneity (lack of different habitat types, e.g. pools, riffles runs, etc.), aquatic habitat diversity and abundance and average riparian canopy cover could explain the low MCI score in 2012. Furthermore, the site is located at the bottom of the catchment meaning that water quality is likely to be poorer.
This site has remained within the good stability grade since it was first assessed in 2008.
 Photo 6: Waipapa Stream at Waipapa Landing Bridge, upstream view.
Hakaru River
Lastly, the Hakaru River site is another example of disparities occurring between the different assessment results. In 2012 the site recorded a MCI score of 81.9, (probable moderate pollution) and ranked 23rd among the 35 sites. However, the site had a sub-optimal habitat quality grade and ranked eighth the same year.
The river channel is characterised by a hard bottom of bedrock, boulders and cobbles. The surrounding land-use is a mix of plantation forest and pastoral activity, livestock have access to the river and riparian canopy cover is average (Photo 7 & Photo 8). Interestingly this site presents good hydrologic heterogeneity, aquatic habitat diversity and abundance which should support the development of a healthy macroinvertebrate community. However, other water quality indicators such as nutrients and sediment have negatively affected the MCI score.
The Hakaru River site has been moving from a sub-optimal to a marginal habitat quality between 2008 and 2010 and was again assessed with a sub-optimal habitat quality in 2012. Regarding its stability, it has always remained within the good stability grade since it was first assessed in 2008.
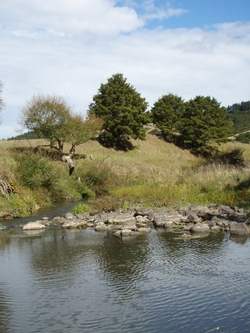 Photo 7: Hakaru River.
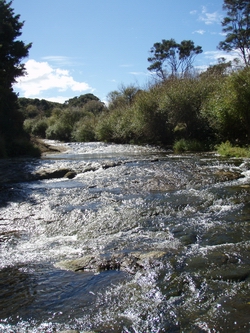 Photo 8: Hakaru River, upstream view.
Waipoua River
Despite a number of inconsistencies between the two assessment programmes, most sites presented consistent results when comparing habitat quality and MCI scores and rankings. For example, the MCI score for the Waipoua River in 2012 was 129.1 (clean water) and ranked first among the 35 sites monitored. Accordingly the site had an optimal habitat quality grade and also ranked first.
This river channel is characterised by a hard bottom of bedrock, boulders and cobbles. The surrounding land-use is dominated by native forest including Kauri trees, livestock do not have access to the river and riparian canopy cover is excellent (Photo 9). The Waipoua River is considered a reference, or "control" site in Northland as it is the closest site to a natural state, i.e. pristine, without human modification.
The Waipoua River has remained within the sub-optimal/optimal habitat quality grade since it was first assessed in 2005. Its stability has also remained within the good to excellent grade since 2005.
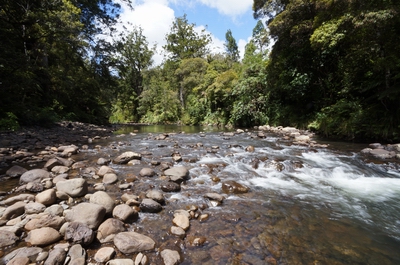 Photo 9: Waipoua River, upstream view.
Waipapa River
The same observation can be made for the Waipapa at Forest Ranger (Waipapa 2) site. In 2012 it had a MCI score of 118.0 and ranked second according to its habitat stability it ranked second among the 35 sites.
While the geology is soft sedimentary, the river channel is still characterised by a hard bottom of bedrock, boulders and cobbles. The surrounding land-use is dominated by native forest, livestock do not have access to the river and riparian canopy cover is excellent. The Waipapa River is also considered to be a reference site for Northland.
The Waipapa River site has remained within the sub-optimal/optimal habitat quality grade since it was first assessed in 2005. Its stability was first assessed as being fair in 2005 and 2007 and it then improved to reach a good stability in 2008 and 2010. It was last assessed with an excellent stability in 2012.