Results
Compliance with ANZECC guidelines
The following maps show the percentage of samples for each site that comply with the ANZECC guidelines for the 2009-2010 financial year. The catchments in the maps are colour coded to reflect good to poor compliance (categories are listed below).
· Dark blue – 81 to 100% of samples comply
· Blue – 61 to 80% of samples comply
· Sky blue – 41 to 60% of samples comply
· Pale blue – 21 to 40% of the sample comply
· Purple – less than 20% of the sample comply
Dissolved oxygen
Compliance with dissolved oxygen (%) guidelines are consistently poor in Northland with only five of the 35 sites achieving a compliance of 50% or more. This poor result is a likely affect of the drought this year with most flows below average. When river flows are low there is less aeration of the water therefore dissolved oxygen levels are lower. Sites with high dissolved oxygen are much more of a concern as those with low dissolved oxygen because dissolved oxygen often has a strong diurnal cycle. Super-saturated oxygen conditions during the day are usually followed by low oxygen (anoxic) levels at night.
Very concerning results were recorded at the Awanui, Hātea, Oruru, Ruakaka, Utakura and Wairua Rivers with no samples complying with the guidelines. Further investigations will be carried out in late 2011, early 2012 to identify the cause of these poor results.
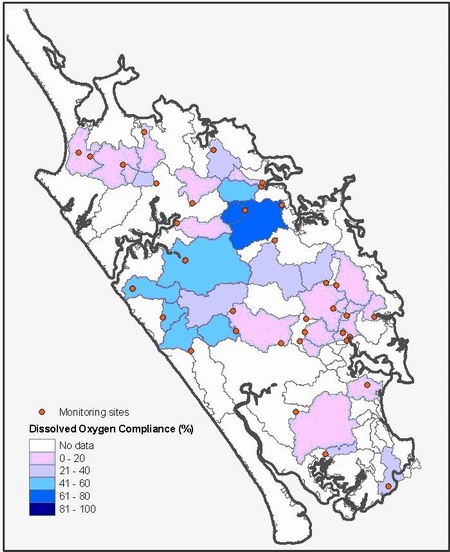
Figure 2: 2009-2010 dissolved oxygen compliance
Water clarity
In 2009-2010 most sites had good compliance with water clarity guidelines. Poorer clarity is displayed in highly erodible catchments, e.g. Utakura, Ruakaka and Paparoa Rivers. When compared to the previous year's data, notable improvements in water clarity are observed in the Awanui, Oruru, Ruakaka and Waiharakeke catchments. It is possible that the changes in water clarity could be as a result of the drought in 2009-2010. With less rainfall runoff fewer sediments would have entered the rivers, and low river levels and higher temperatures encourage weed and algal growth.
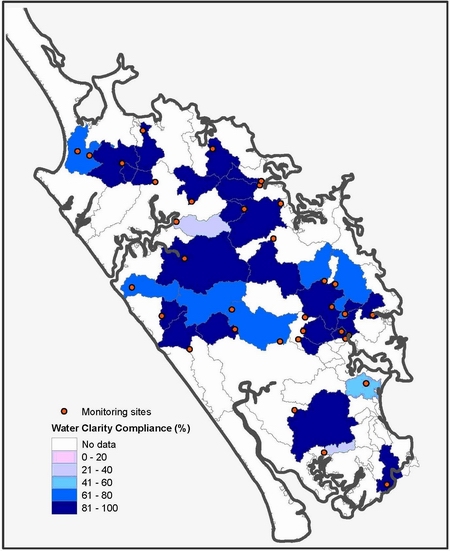
Figure 3: Water clarity compliance map
Turbidity
Majority of the sites had average to good compliance. Three sites, Paparoa, Ruakaka and Utakura Rivers, failed to meet the turbidity guideline on all sampling occasions. These catchments are highly erodible which explains the poor turbidity compliance. Overall compliance is higher than the previous year with notable improvements in the Awanui, Manganui, Oruru and Wairua Rivers which is likely to be due to the drought as there would have been less suspended sediments entering the water ways.
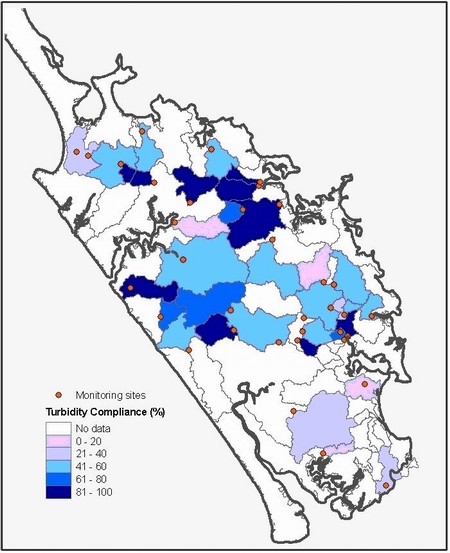
Figure 4: Turbidity compliance map
pH
Most sites had average to good compliance with the pH guidelines for the protection of aquatic ecosystems. When compared to previous year's data, compliance rates have dropped in the Hātea, Kaeo, Mangakahia, Victoria and Wairua catchments. Agriculture run off and changes in land use may have resulted in declines in pH compliance. Improvements were noted in the Paparoa, Ruakaka and Waipoua Rivers.
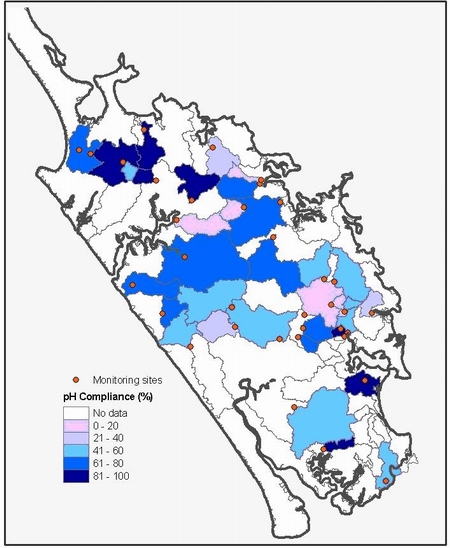
Figure 5: pH compliance map
Total nitrogen
Most sites showed good compliance with the total nitrogen guidelines for the protection of aquatic ecosystems. When compared to the previous year's data notable improvements in total nitrogen water quality were observed at many sites, in particular the Awanui, Mangahahuru and Mangere catchments. It is likely that less rainfall runoff during the drought resulted in fewer nutrients being delivered to the rivers and streams. Also algal growths within the streams would have taken up a lot of the nitrogen. Both of these effects resulted in lower total nitrogen concentrations in the rivers.
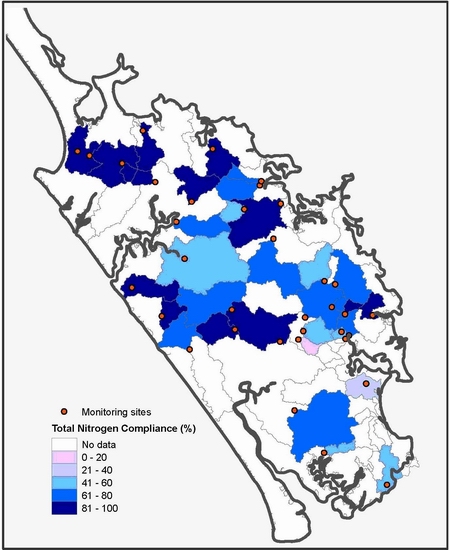
Figure 6: Total nitrogen compliance map
Ammoniacal nitrogen
In 2009-2010 most sites had good to excellent compliance with the ammoniacal nitrogen guideline which is recommended to remain below <0.021 mg/L. Fourteen river network sites complied with the guideline on all sampling occasions. Only one site, Ruakaka River, had less than 50% compliance with ammoniacal nitrogen guideline. When compared to last year's results notable improvements were observed in the Mangahahuru, Manganui, Mangere, Waiotu and Wairua catchments with compliance at all sites increasing by at least 25%. As with total nitrogen, it is likely that less rainfall runoff during the drought resulted in a reduction of nutrients entering the water ways.
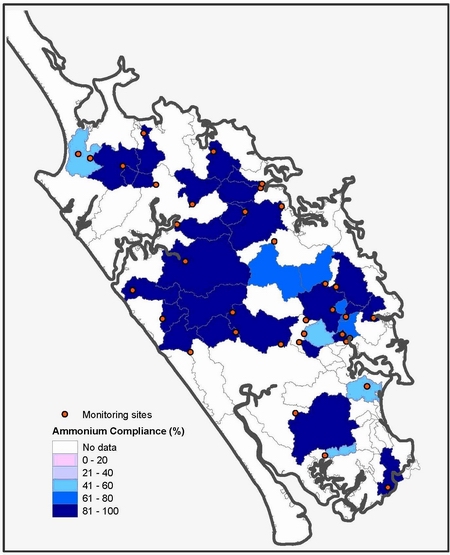
Figure 7: Ammonium compliance map
Total phosphorus
Most sites show poor compliance with the total phosphorus guidelines for protection of aquatic ecosystems. This is partly due to Northland's phosphorus rich sandstone and mudstone catchment geology which provides a high background level of phosphorus to streams naturally. Only two sites, Waipapa River and Waipapa Stream, had 100% compliance with the total phosphorus guideline. Hakaru, Mangere, Paparoa, Ruakaka and Utakura river sites failed to met the guideline of <0.033 mg/l on all sampling occasions. These catchments are highly erodible which explains the poor compliance at these sites.
When compared to the previous year's data notable improvements in total phosphorus water quality are observed at many sites. Big improvements were recorded in the Awanui River (FNDC take site), Mangahahuru Stream (Apotu Rd site) and Waiharakeke River with compliance rates increasing by 50%. Like nitrogen, it is likely that less rainfall runoff during the drought resulted in fewer nutrients being delivered to the rivers and streams. Also algal growths within the streams would have taken up a lot of the phosphorus. Both of these effects resulted in lower total phosphorus concentrations in the rivers.
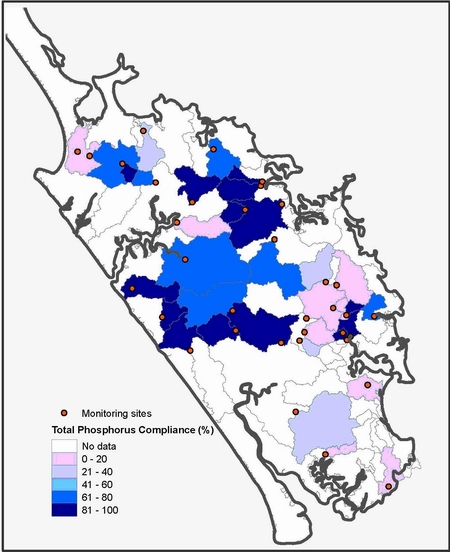
Figure 8: Total phosphorus compliance map
Dissolved reactive phosphorus
Dissolved reactive phosphorus compliance was poor this year at half of the 35 sites, with eight sites failing to meet the guideline of <0.01 mg/l on all sampling occasions.
These results are similar to previous years with consistently poor compliance observed in the Hakaru, Mangamuka and Ruakaka Rivers. High dissolved reactive phosphorus compliance in the Mangamuka River is of concern as the catchment is predominately native forest. This indicates that the source of phosphorus is from eroding soils in the catchment.
Eight sites met the dissolved reactive phosphorus guidelines on all sampling occasions. Improvements were observed in the Kerikeri, Waiarohia, Waiharakeke and Waipoua catchments. These improvements are the likely result of the drought conditions seen over the past year.
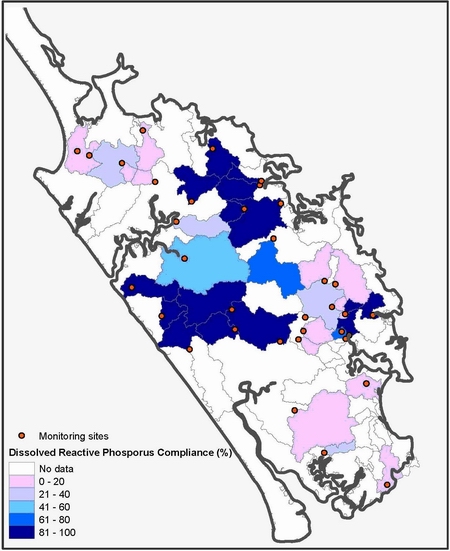
Figure 9: Dissolved reactive phosphorus compliance map
Compliance with recreational bathing guidelines
The following maps show the percentage of samples for each site that comply with the microbiological water quality guideline (MFE, 2002) and water clarity guideline from the RWSP (NRC, 2007) for the 2009-2010 financial year. The catchments in the maps are colour coded to reflect good to poor compliance.
E. coli (bacteria)
Most sites had average to good compliance with the water quality guidelines for recreational bathing. When compared to the previous year's data notable declines in bacteriological water quality are observed at most sites. These declines could be due to the drought in 2009-2010. With below average rainfall, river and stream levels became very low compared to normal flows in summer. The low flows of the rivers and streams may have provided less dilution of inputs and could help explain the observed declines in 2009-2010. Further work is being done to determine the source of E.coli in rivers.
Most concerning E. coli compliance results were observed in the Mangamuka, Ngunguru, Waimamaku and Waiotu Rivers with compliance rates falling from 92% in 2008/09 year to 50% of samples this year. E. coli compliance improved at Waiarohia Stream (Whau Valley), rising from 8% last year to 58% this year.
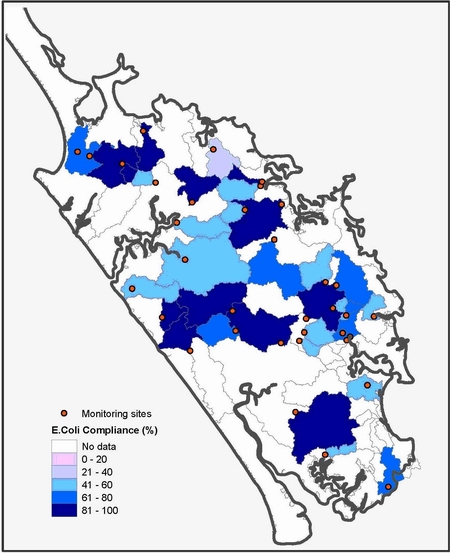
Figure 10: E. coli compliance map
Water clarity
Overall recreational bathing water clarity compliance is poor with 11 of the 35 sites failing to meet the guideline of 1.6m on all sampling occasions. Only three sites met the guideline of 1.6m on at least 80% of sampling occasions; Waiarohia Stream at Second Ave, Waipao Stream and Waipapa River and only a further seven sites comply with the guideline at least 50% of the time.
There are improvements in the Waiarohia Stream, Wairua and Waipapa Rivers when comparing data to the results from the 2006 State and Trend report (NRC, 2007). However there are a number of declines in compliance rates, especially in the Mangahahuru, Victoria, Waipoua and Whakapara catchments. Of most concern is the decline in the Waipoua River with compliance dropping from 82% in 2006 to 50% this year.
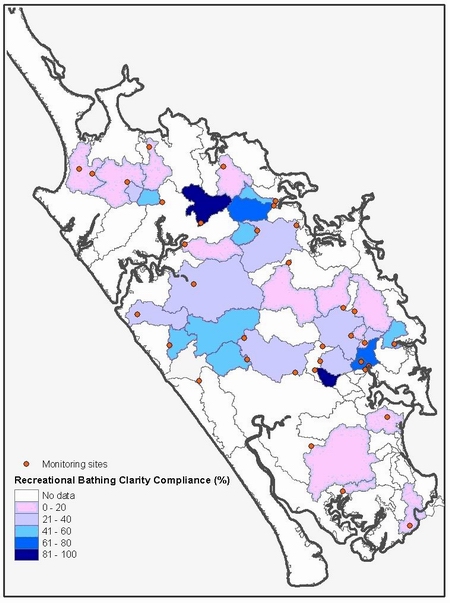
Figure 11: Map of recreational clarity compliance