Introduction
Northland's River Water Quality Monitoring Network was established in September 1996 and initially included nine river sites throughout Northland. Since 1996 a further 22 sites have been added to the network. The four Northland sites in the National River Water Quality Network monitored by National Institute of Water and Atmospheric Research Limited (NIWA) are also incorporated into our regional network. So there are currently 35 sites throughout Northland monitored monthly for water quality. These sites are shown in figure 1 (below).
Sites have been selected to represent different geology, river types and land use found in the Northland Region.
This report looks at the current state of water quality for the 2009/2010 year at all RWQMN sites and compares water quality to the ANZECC guidelines (ANZECC, 2000) for aquatic ecosystems and the recreational bathing guidelines (MFE, 2003). This report also presents the results of a formal trend analysis for 21 sites (sites with 5 years or more data). The state is affected by inter-annual climate variation such as floods and droughts whereas trends give the overall picture of weather water quality is getting better, worse or no changing at all.
Click on the map to open a larger version in PDF format
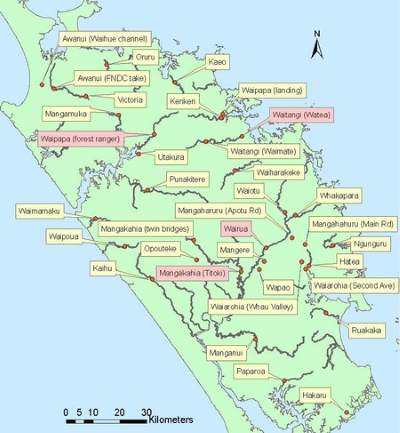
Figure 1: Map showing the 35 Regional Water Quality Monitoring Network sites (National River Water Quality Network sites in pink).