Trends
Annual median values
The following graphs are a descriptive way of showing changes in water quality through time (Scarsbrook 2006). Annual median was calculated using the monthly data for the 21 RWQMN sites for each parameter from 1997 to 2006, remembering that there was only 13 sites in 1997 and the number of sites has increased since. These annual site medians were then used to calculate 5th, 20th, 50th, 80th and 95th percentiles for all RWQMN sites. The 50th percentile shows us what is happening in a "middle of the road" river, while the 5th and 95th percentiles show us changes in the best and worst rivers. The 20th and 80th percentiles are shown because management decisions are often based on the 80:20 rule.
Figure 29: Percentiles based on annual median temperature for up to 21 RWQMN sites.
Figure 30: Percentiles based on annual median conductivity (mSm) for all RWQMN sites.
Figure 31: Percentiles based on annual median pH for up to 21 RWQMN sites.
Figure 32: Percentiles based on annual median dissolved oxygen (% saturation) for up to 21 RWQMN sites.
Figure 33: Percentiles based on annual median turbidity (ntu) for all RWQMN sites.
Figure 34: Percentiles based on annual median water clarity (m) for all RWQMN sites.
Figure 35: Percentiles based on annual median ammoniacal nitrogen (g/m3) for all RWQMN sites.
Figure 36: Percentiles based on annual median nitrate/nitrite nitrogen (g/m3) for all RWQMN sites.
Figure 37: Percentiles based on annual median total nitrogen (g/m3) for all RWQMN sites.
Figure 38: Percentiles based on annual median dissolved reactive phosphorus (g/m3) for all RWQMN sites.
Figure 39: Percentiles based on annual median total phosphorus (g/m3) for all RWQMN sites.
Formal trend analysis
All trends are based on flow adjusted data except for Waipoua River at SH12, as there is not yet any flow data available for this river. A flow recorder will be installed at this site in 2007.
WQstat plus TM only reports p-values into four categories as follows:
· less than or equal to 5% (≤5)
· greater than 5% but less than or equal to 10% (≤10)
· greater than 10% but less than or equal to 20% (≤20)
· greater than 20%
How the p-value results are shown in table 3 (below) is above in brackets. Anything without a p-value in table 4 has a p-value greater then 20%. For this analysis any trends with a p-value of 5% or less are significant.
It should be noted that the number of samples for each site and parameter varies because sampling was started in different years for each site and there are some missing results. The trend analysis was done on data from January 1997 to December 2006 for all sites where this data was available (including the national network sites). However for sites that were added to the network later than January 1997, the trend analysis included data from when sampling began for these sites (see table 4 in Appendix A). Table 10 in appendix E shows the number of samples for each of the trends in table 3.
Table 3: Trend slopes for water quality parameters for 18 RWQMN sites with p-values (%) shown in brackets, including the 4 sites in the National network from January 1997 to December 2007 or when records began (see table 4, appendix A).
 Download Table 3 (103 KB)
Note: The information in this table is too wide to display on this page and therefore has been prepared as a .pdf file.
Maps showing trends
The results from the formal trend analysis have been summarised into the maps below (Figures 40 to 53) in the following way:
· Insufficient data for this particular parameter at this site
· No significant change (P > 0.05)
· Significant increase or decrease (P ≤ 0.05)
· Meaningful increase or decrease (P ≤ 0.05) and the magnitude of the trend is greater than 1% per annum of the raw data medium (see table 11 in appendix F)
Temperature
There were only two significant trends for temperature, of which both were a meaningful decreasing trend. They were both located in the Victoria/Awanui River catchment in the Far North. The reason for this decrease is unknown at this stage but it is seen as an improvement.
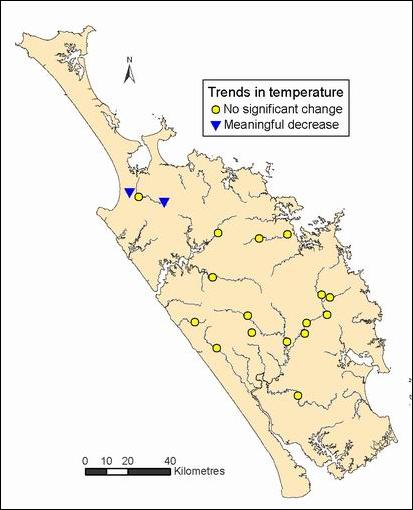
Figure 40: Trends in temperature (°C) at 18 RWQMN sites
Dissolved oxygen
There were five sites with significant trends for dissolved oxygen, all of which were increases in dissolved oxygen levels. Of these five sites, Mangahahuru Stream at Apotu Road and Whakapara River had meaningful increases in dissolved oxygen. It is likely that these are deteriorating trends, based on the results from the investigation into diurnal patterns in dissolved oxygen results.
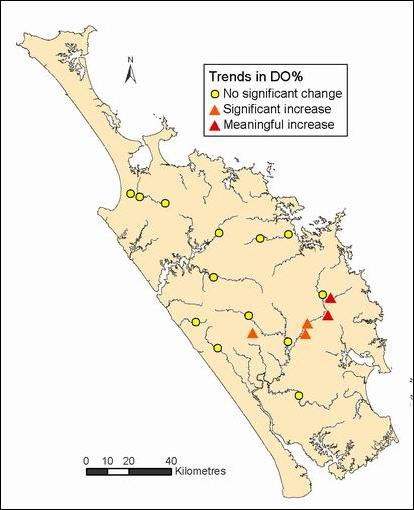
Figure 41: Trends in dissolved oxygen (% saturation) at 18 RWQMN sites
Conductivity
Four sites showed significant changes in conductivity, of which three were of a magnitude to be meaningful. The following sites showed a meaningful increasing trend in conductivity; Awanui at Waihue Channel, Mangakahia at Twin Bridges and Mangahahuru Stream at Apotu Road. This is likely to be deterioration in water quality at these sites.
Waitangi at Watea showed a significant decreasing trend in conductivity but the trend is not meaningful, at only 0.4% of the median conductivity for this site.
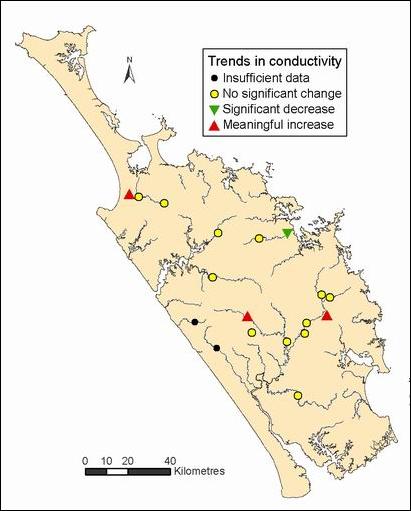
Figure 42: Trends in conductivity (mSm) at 18 RWQMN sites
pH
One site, Awanui River at the FNDC water take, shows a significant decreasing trend in pH (i.e. becoming more acidic), but not meaningful. Nine sites show significant increasing trends in pH (i.e. becoming more alkaline), of which two are meaningful trends for the Waitangi River at Waimate and Waiotu River sites. These sites both had an increasing pH of 0.08 per year. While this may seem small, it is important to highlight that pH varies with the base-10 logarithm of the hydrogen ion concentration. For example an increase in pH of 0.08 is equivalent to an increase in the hydrogen ion concentration by a factor of 1.2 mol/L per year.
As the median pH for both of these sites is almost neutral at 6.9, these increasing trends can be regarded as a deterioration. The cause of this increasing pH is unknown and is not consistent with elsewhere in New Zealand. Other NZ studies have typically found decreasing trends in pH (Scarsbrook et al 2003, Vant and Smith 2004, Scarsbrook 2006).
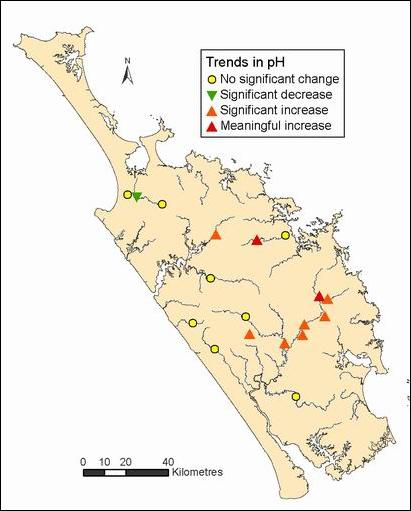
Figure 43: Trends in pH at 18 RWQMN sites
Turbidity
Four of the 18 sites show a significant and meaningful decreasing trend in turbidity; Awanui at Waihue Channel, Waipapa at Puketi forest, Mangahahuru Stream at Apotu Road and Mangere Stream at Knight Road.
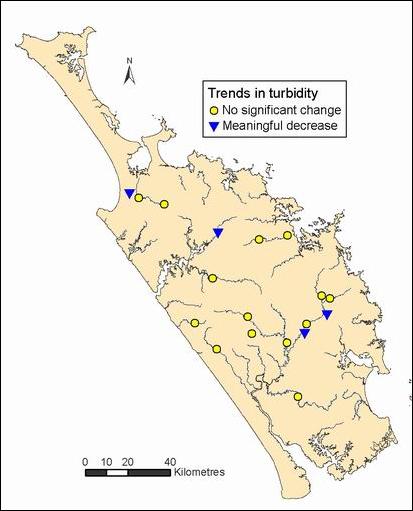
Figure 44: Trends in turbidity (ntu) at 18 RWQMN sites
Water clarity
Water clarity exhibited meaningful trends at five of the 18 sites. Only one site was decreasing, Victoria River, and the rest were increasing clarity; Waipapa at Puketi Forest, Whakapara River, Mangahahuru Stream and Mangere Stream.
Three of the above trends correspond with decreasing trends in turbidity. However, this is not the case for Victoria and Whakapara River sites. It is possible that the loss in water clarity at the Victoria River site is related to changes in sampling officer. This will be investigated further.
These results for the last 10 years of data (1997 to 2006) contradict the results of an analysis of 17 years data from 1989 to 2005 by Scarsbrook (2006). Scarsbrook detected decreasing trends in water clarity at the four Northland sites in the national network, while in this regional analysis three showed no significant trend and one in fact shows an increasing trend (Waipapa). This highlights the importance of taking into account the length of the dataset.
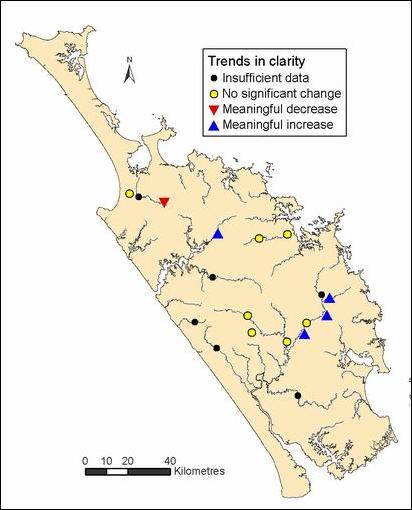
Figure 45: Trends in clarity (m) at 18 RWQMN sites
Dissolved colour
The only river to have a significant change in dissolved colour is Whakapara River and this was a meaningful increase. This is surprising considering that water clarity has improved at this site.
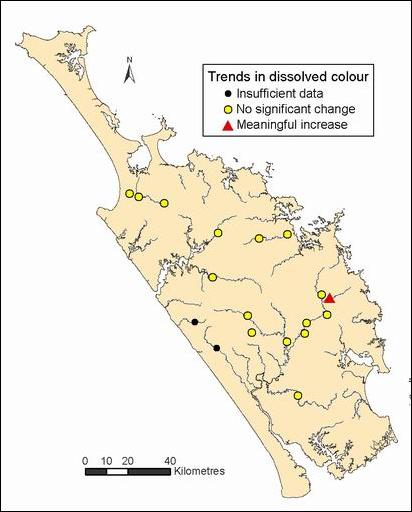
Figure 46: Trends in dissolved colour (340 nm) at 18 RWQMN sites
Escherichia coli (Bacteria)
E. coli analysis only started for the four NWQMN sites in 2005, so they do not have sufficient data yet to carry out trend analysis.
Of the other 14 sites, only Mangere stream shows a significant change in E. coli levels, with a meaningful increase of 118 MPN/100ml/year from 2000 to 2006. This is a large increase, at 21% of the site median. The cause of this increase is unknown at this stage but will be investigated further.
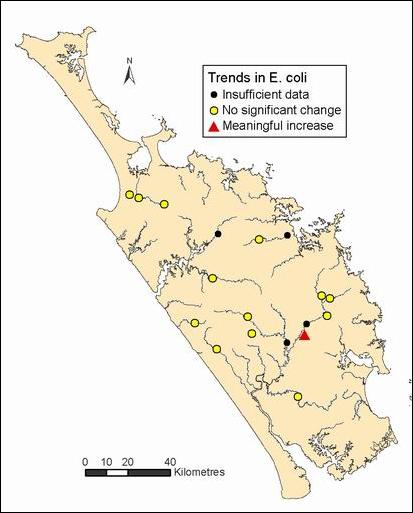
Figure 47: Trends in E. coli (MPN/100ml) at 18 RWQMN sites
Ammoniacal nitrogen
Thirteen sites showed meaningful decreases in ammoniacal nitrogen. However care should be taken interpreting these results as there has been two changes in detection limits for ammoniacal nitrogen (July 1999 and July 2003) and for many sites ammoniacal nitrogen is frequently below detection.
Of these 13 sites with decreasing trends only four have less than 15% (recommended in IDT 1998) of their ammoniacal nitrogen results above detection: Waipapa at Puketi Forest, Wairua at Purua, Mangakahia at Titoki and Mangere Stream, and therefore the decreasing trend detected is valid. However the other nine sites have more than 15% of their samples below detection and therefore the decreasing trend is probably as a result of the changes in detection limit rather than an actual decrease in ammoniacal nitrogen levels. The two exceptions to this are Awanui above Waihue Channel and Mangahahuru Stream at Apotu. The greatest proportion of the below detections for these two sites have occurred since 2003, so it is possible that there has been an actual decrease in ammoniacal nitrogen.
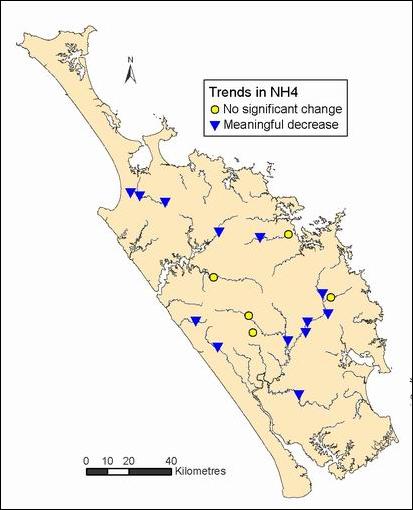
Figure 48: Trends in ammoniacal nitrogen (g/m3) at 18 RWQMN sites
Nitrate/nitrite nitrogen
All sites are nitrate/nitrite nitrogen (NNN or NOx), except the four national network sites, which are just nitrate (NO3).
Eight sites spread throughout Northland showed a meaningful decrease in nitrate/nitrite nitrogen (NNN) levels. Similarly to the trend for ammoniacal nitrogen, the decreasing trend for NNN detected at Victoria River is likely to be an artefact of too many samples below detection limit and a change in detection limits, rather than an actual decreasing trend in NNN. However the trends at the other seven sites are valid, which again includes Mangere Stream, the site ranked as having the worst water quality (table 9 in appendix C)
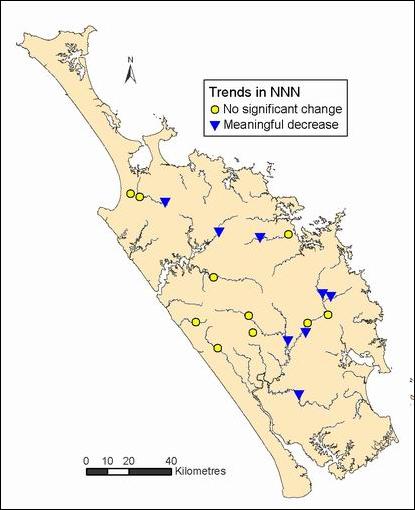
Figure 49: Trends in nitrate/nitrite nitrogen (g/m3) at 18 RWQMN sites
Total Kjedahl nitrogen
The total kjedahl nitrogen (TKN) results presented below for the four NRWQN sites have been calculated by subtracting the concentration of nitrate from the concentration of total nitrogen (i.e. TN – NO3 = TKN).
TKN exhibited meaningful decreasing trends at two sites (Waitangi at Watea and Kaihu) and meaningful increasing trend at one site (Waitangi at Waimate). It is interesting that two sites on the same catchment are showing opposite trends.

Figure 50: Trends in total kjedahl nitrogen (g/m3) at 18 RWQMN sites
Total nitrogen
Four sites showed meaningful decreasing trends in total nitrogen. These were Waipoua, Manganui, Mangere and Wairua at Purua. Other than Waipoua River, these sites also have corresponding decreasing trends for either NNN, TKN or NH4.
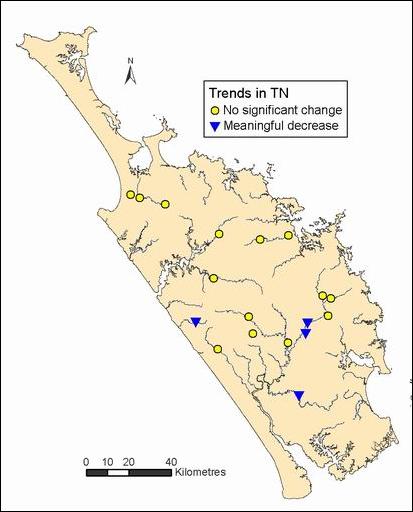
Figure 51: Trends in total nitrogen (g/m3) at 18 RWQMN sites
Dissolved reactive phosphorus
Nine of the 18 sites showed meaningful decreasing trends in dissolved reactive phosphorus (DRP), one of which was Mangere Stream, while two sites showed meaningful increasing trends (Waipoua and Manganui Rivers). These increasing trends are a concern, particularly for Waipoua River at 0.002g/m3/year, which is 40% of the median DRP.
With over 90% of the Waipoua River catchment being native forest, thus indicates DRP is likely to be natural as a result of catchment geology. This is consistent with findings at Whatawhata in Waikato region where high DRP concentrations from native forest streams indicate an unusual geological source that is masking any land-use influence (Quinn and Stroud 2002). However it is unknown why the DRP levels have increased in Waipoua River over the last five years. The trend could be influenced by the fact that there is no historical flow data for this site to be able to flow adjust the water quality data. However this will no longer be an influencing factor as a water level recorder station was installed at this site in 2007. This trend will be re-assessed every year and investigated if it persists.
The results for the 10 years of regional data from 1997 to 2006 contradict the trends reported nationally by Scarsbrook (2006) for 1989 to 2005 for the four Northland sites in the NRWQN. The 17 years of national data showed all four Northland sites as having meaningful increasing trends. In contrast the regional data for 1997 to 2006 for the same four sites showed three had decreasing trends and the other had no change.
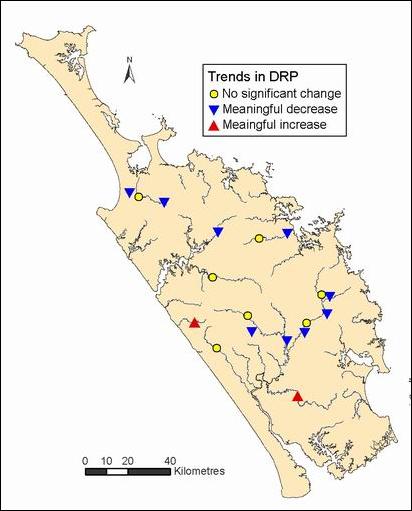
Figure 52: Trends in dissolved reactive phosphorus (g/m3) at 18 RWQMN sites
Total phosphorus
Total phosphorus exhibited meaningful decreases at six sites, one of which was Mangere Stream and meaningful increases at three sites. Similarly to DRP, total phosphorus also shows an increasing trend for Waipoua River at 0.002g/m3 per year, which is 25% of the median for this site.
Similarly to DRP, the total phosphorus trend results for the last 10 years (1997 to 2006) contradict the results for 1989 to 2005 for three of the four NRWQN sites. Scarsbrook (2006) found meaningful increasing trends at these three sites for the 17-year national analysis, while for the 10-year regional analysis only one site showed a meaningful increase and the other two showed no change.

Figure 53: Trends in total phosphorus (g/m3) at 18 RWQMN sites