Results
These results exclude the following three sites added in August 2006; Ruakaka, Waiharakeke and Kaeo Rivers.
The site medians for all years of data and for the 2006 data for each parameter are in tables 5 and 6 in Appendix B.
Current State in 2006
Median values for 2006 were calculated based on the monthly data for all parameters at each site, except the three sites added in August 2006. The 21 site medians for each parameter were then further summarised as 5th, 20th, 50th, 80th and 95th percentile values to give a summary at the regional scale, following the presentation of Scarsbrook (2006).
These results are presented as maps in figures 2 to 15 (below). In all the maps the points correspond to the following values:
· minimum – 5th percentile
· >5 – 20th percentile
· >20 – 50th percentile
· >50 – 80th percentile
· >80-95th percentile and
· >95th percentile to maximum
Where applicable the colours of the points represent the quality, with red being the worse and blue the best i.e. lower temperatures and conductivity are better (blue), while lower water clarity is worse (red). Dissolved oxygen and pH have an ideal range, so therefore the colours for these two figures do not represent better or worse.
Temperature
The sites with the lowest median temperature for 2006 are the two "pristine" indigenous forest sites; Waipapa River in Puketi Forest and Waipoua River at SH12. These sites are reasonably high in their respective catchments. The other sites with relatively low median temperatures are those situated in upper catchments, including Victoria River in Victoria Valley, Waitangi River at Waimate and Mangahahuru Stream at Main Road.
The site with the highest median temperature in 2006 was Wairua River at Purua with a median of 17.1°C, followed by Waiarohia at Second Ave with a median of 17.05°C.

Figure 2: Median water temperature (°C) for 2006 at 21 RWQMN sites
Dissolved oxygen
Many of Northlands rivers fall outside the ideal range for dissolved oxygen for the protection of aquatic ecosystems of 98 to 105% for lowland rivers (ANZECC 2000). The Awanui River site above Waihue channel has the lowest median dissolved oxygen for 2006 of 85%.
Waiarohia Stream has the highest median for 2006 of 111.2%. Sites with high dissolved oxygen are as much of a concern as those with low dissolved oxygen because DO often has strong diurnal cycles. Super-saturated oxygen conditions during the day are usually followed by low oxygen (anoxic) levels at night.
The overall regional median for dissolved oxygen (% saturation) in 2006 was 99.2%, which is inside the ideal range (ANZECC 2000) but is lower than the national median for 2005 of 101% (Scarsbrook 2006).
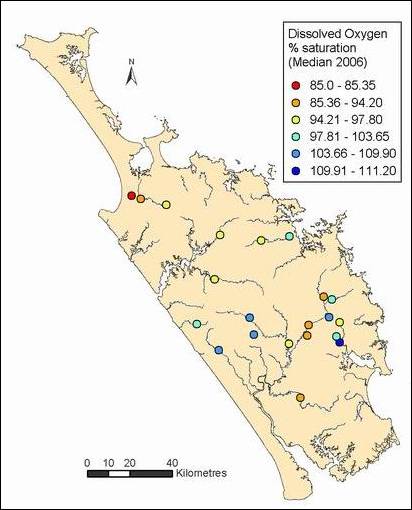
Figure 3: Median dissolved oxygen (% saturation) for 2006 at 21 RWQMN sites
Conductivity
Conductivity can be an indicator of nutrients in the water but also catchment geology, for example volcanic rock geology can cause high water conductivity. The sites with the lowest median conductivities for 2006 are the sites with the lowest nutrient levels; Waipoua, Waipapa and Victoria River. The sites with the highest median conductivities were Waiarohia Stream in Whau Valley and Wairua River at Purua.

Figure 4: Median conductivity (mSm@25°C) for 2006 at 21 RWQMN sites
pH
Median pH in 2006 was highest (more alkaline) in the Waipapa River site in Puketi Forest and lowest at the Manganui River and Wairua River at Purua sites. None of the rivers had an annual median pH in 2006 less than 7.0 or greater than 7.8. The median for 17 of the 21 sites was within the ideal pH range for the protection of aquatic ecosystems of 7.2 to 7.8 for lowland rivers (ANZECC 2000).
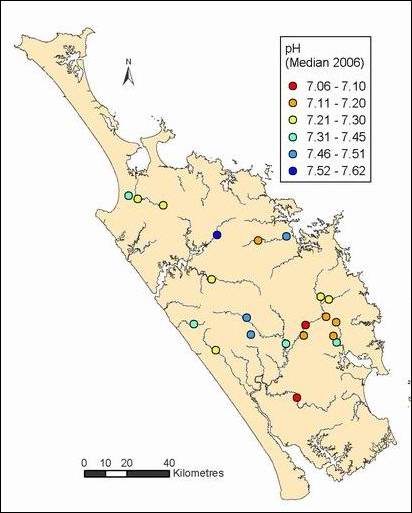
Figure 5: Median pH for 2006 at 21 RWQMN sites
Water clarity
The regional median water clarity in 2005 was 1.24 m and in 2006 was 1.35 m. The national median clarity in 2005 for the 77 National River Water Quality Monitoring Network sites was 2.85 m (Scarsbrook 2006).
Highest median water clarity in 2006 was 2.13 m in Waipoua River and Mangahahuru Stream at Main Rd, followed by Waipapa River and then Victoria River. The lowest median water clarity in 2006 was 0.55 m at the Awanui River above Waihue channel site, followed by the Mangakahia River at Titoki Bridge site.
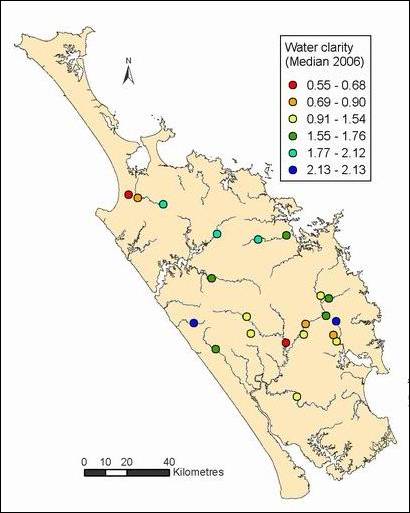
Figure 6: Median water clarity (m) for 2006 at 21 RWQMN sites
Turbidity
Median turbidity in 2006 was lowest at the Victoria River site, followed by the Waipapa River site, while the Manganui River had the highest median turbidity levels. The medians for the majority of sites (16 of 21) were below the upper limit for the protection of aquatic ecosystems of 5.6 ntu (ANZECC 2000).

Figure 7: Median turbidity (ntu) for 2006 at 21 RWQMN sites
Dissolved colour
Similarly to water clarity and turbidity the lowest median dissolved colour for 2006 was found at the Victoria, Waipoua and Waipapa River sites and the highest was in the Manganui River. This is consistent with the visual appearance of these rivers, with the first three sites having frequently clear bluer coloured water, while Manganui River is often turbid and brown.
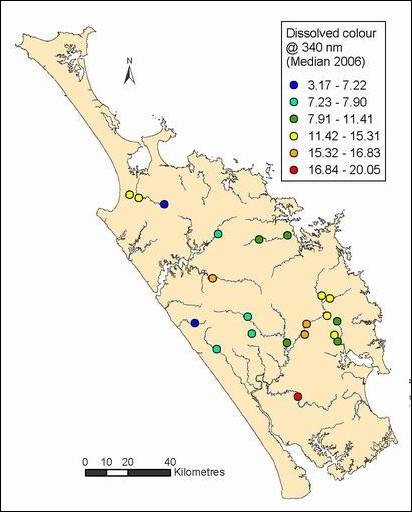
Figure 8: Median dissolved colour (@ 340 nm) for 2006 at 21 RWQMN sites
Total kjedahl nitrogen
Total kjedahl nitrogen (TKN) is basically organic nitrogen. Note: the results presented below for the four NRWQN sites have been calculated by subtracting the concentration of nitrate from the concentration of total nitrogen (i.e. TN – NO3 = TKN)
Waiarohia Stream in Whau Valley had the highest median Total Kjedahl nitrogen (organic nitrogen) in 2006 of 0.55 g/m3, while the Waipoua and Victoria River sites had the lowest median TKN in 2006 of 0.05 g/m3.
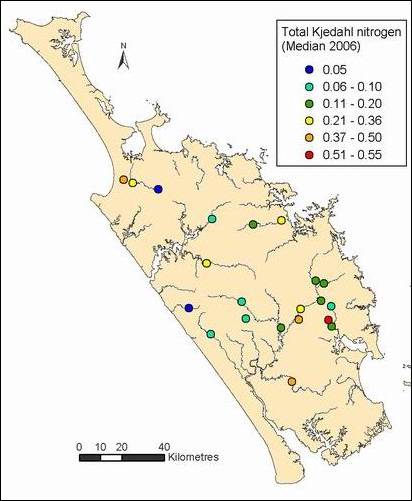
Figure 9: Median total kjedahl nitrogen (g/m3) for 2006 at 21 RWQMN sites
Nitrate nitrite nitrogen
Nitrate/nitrite nitrogen is also known as oxides of nitrogen (NOx). Note: the results presented in the figure below for the four NRWQN are nitrate (NO3) only, not oxides of nitrogen.
Median nitrate/nitrite nitrogen (NNN) is highest at Mangere Stream at Knight Road and lowest at the Victoria and Opouteke River sites. The regional annual median NNN was 0.142 g/m3 for both 2005 and 2006, while the national median in 2005 was 0.116 g/m3 (Scarsbrook 2006).
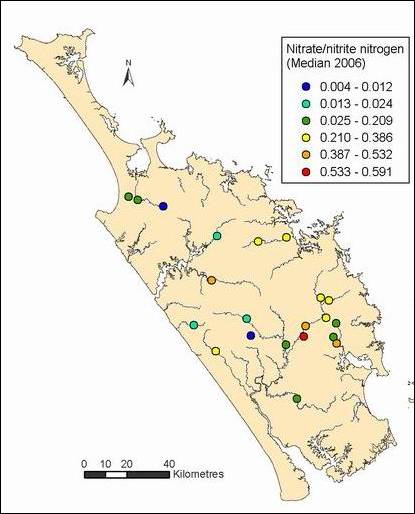
Figure 10: Median Nitrate/nitrite nitrogen (g/m3) for 17 NRC sites and median nitrate (g/m3) for 4 NRWQN sites (NIWA) for 2006
Ammoniacal nitrogen
Many of the sites have median ammoniacal nitrogen (NH4) of 0.005 g/m3 because NH4 is below the detection limit of 0.01 g/m3 on the majority of sampling occasions for these sites. This is consistent with the low concentrations of NH4 found in most rivers nationally (Scarsbrook 2006). Ammoniacal nitrogen is highest at the Mangere Stream site.
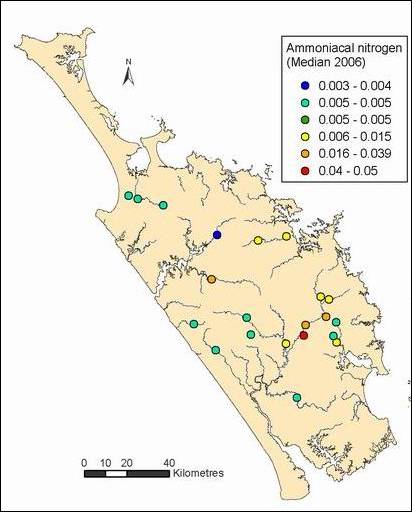
Figure 11: Median ammoniacal nitrogen (g/m3) for 2006 at 21 RWQMN sites
Total nitrogen
Victoria and Waipoua River sites had the lowest median total nitrogen (TN) concentrations in 2006, while Mangere Stream and Punakitere River had the highest. The regional median for TN in 2005 was 0.417 g/m3 and 0.405 g/m3 in 2006, compared to the national median for 2005 of 0.280 g/m3 (Scarsbrook 2006).

Figure 12: Median total nitrogen (g/m3) for 2006 at 21 RWQMN sites
Dissolved reactive phosphorus
The median dissolved reactive phosphorus (DRP) for 2006 was lowest at the Waitangi River at Waimate and Waiarohia Stream at Whau Valley sites, with several monthly results below the detection limit of 0.004 g/m3. The highest median DRP concentration was found in the Mangere Stream. Regional median for DRP was 0.019 and 0.016 g/m3 in 2005 and 2006 respectively, compared to the national median in 2005 of 0.005 g/m3.
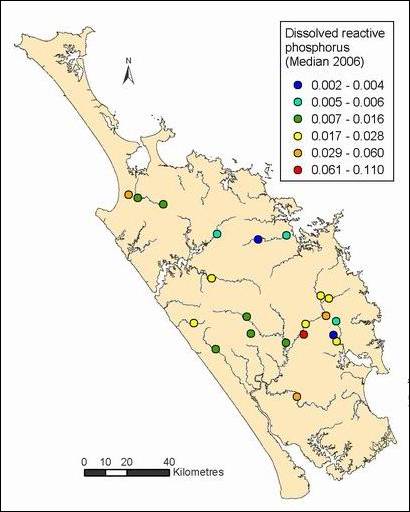
Figure 13: Median dissolved reactive phosphorus (g/m3) for 2006 at 21 RWQMN sites
Total phosphorus
Median total phosphorus (TP) concentrations were lowest at the Waipapa River and Mangahahuru Stream at Main Road sites. Similarly to DRP, TN, NH4 and NNN, Mangere Stream also has the highest median TP levels for 2006. The regional medians for TP were 0.048 and 0.044 g/m3 in 2005 and 2006 respectively, compared to the national median in 2005 of 0.016 g/m3.
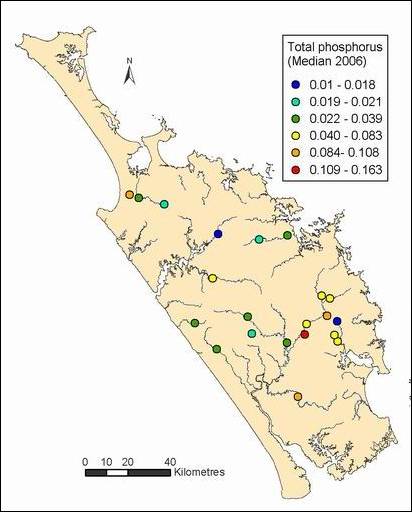
Figure 14: Median total phosphorus (g/m3) for 2006 at 21 RWQMN sites
Escherichia coli (bacteria)
The sites with the lowest median Escherichia coli were the two indigenous forest sites; Waipoua and Waipapa Rivers, followed by Wairua at Purua. The site with the highest median E. coli for 2006 was Mangere Stream. The median E. coli results for Northland in 2005 and 2006 were 286 and 235 MPN/100ml respectively, compared to the national median for 2005 of 49 MPN/100ml.
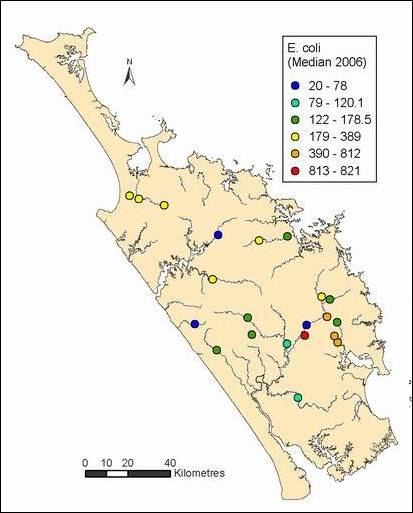
Figure 15: Median E. coli (MPN/100ml) for 2006 at 21 RWQMN sites
Diurnal patterns in Dissolved oxygen
Dataloggers were deployed at the two RWQMN sites on the Mangahahuru Stream, one at Main Road in the headwaters and the other at Apotu Road further downstream. The dataloggers were deployed for approximately a week at both sites simultaneously and programmed to take dissolved oxygen measurements every 30 minutes. The results for dissolved oxygen (% saturation) at the two sites are shown in figures 16 and 17 (below).
Both figures show a clear diurnal cycle in dissolved oxygen (DO) with peaks between 3 and 4 pm and lows between 6 and 7 am.
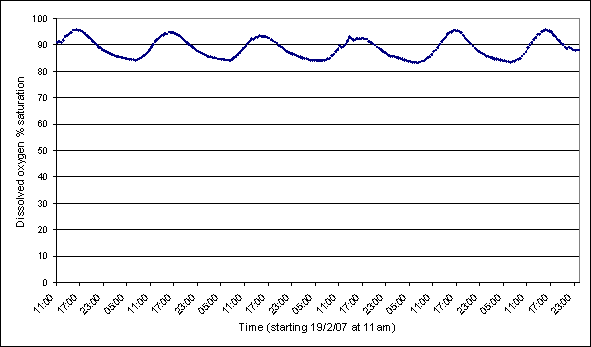
Figure 16: Dissolved oxygen (% saturation) at the Mangahahuru Stream Main Road site starting at 11 am on 19 February 2007.
But more importantly these results highlight the difference in DO cycles between the two sites. The less impacted and shaded Main Road site has a small range with its dissolved oxygen fluctuating by about 10% throughout the cycle, while the Apotu Road site has a much greater range of about 75%. This is most likely a result of the large mats of oxygen weed at the Apotu Road site, which produce copious amounts of oxygen during the production (day time) phase of photosynthesis but consume oxygen during the respiration (night time) phase of photosynthesis. These extremes in dissolved oxygen are a concern as oxygen levels as low as 50% saturation are occurring in the early morning at the Apotu Road site.
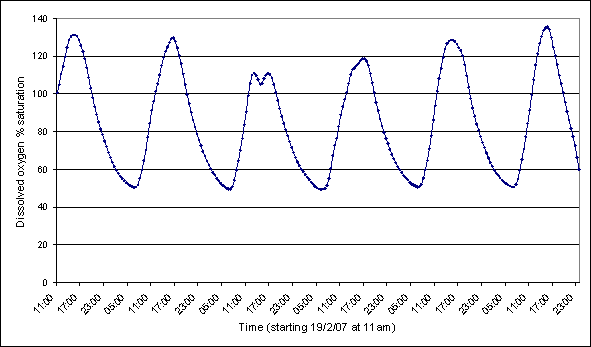
Figure 17: Dissolved oxygen (% saturation) at the Mangahahuru Stream Apotu Road site starting at 11 am on 19 February 2007.
Heavy metals in an urban catchment
Sampling for heavy metals in stream sediments was established in November 2006 for the Waiarohia Stream in Whangarei to investigate the effects of urban land use. Two sites are sampled; one at Whau valley which is the upstream or background site and the other at Second Avenue, which is the downstream site. The Waiarohia Stream between these two sites is heavily influenced by road run-off and urban stormwater. Sediment samples are collected every three months and analysed for the typical suite of heavy metals.
The results for the first three sampling occasions are presented in table 2 (below). The results are compared to the ANZECC sediment quality guidelines for the protection of aquatic ecosystems (also shown in table 2). None of these initial results exceed the high trigger values for the protection of aquatic ecosystems. However a few results (shown in bold and red) exceed the low trigger values.
Table 2: Heavy metal levels (mg/kg) in stream sediments from two Waiarohia Stream sites, compared to the ANZECC trigger values
Second Ave site |
Whau valley site |
ANZECC trigger values |
||||||
| Date | Nov 06 | Feb 07 | May 07 | Nov 06 | Feb 07 | May 07 | Low | High |
| Arsenic | 8 | 5 | 6 | 10 | 9 | 12 | 20 | 70 |
| Cadmium | 0.2 | 0.1 | 0.1 | 0.1 | 0.3 | 0.1 | 1.5 | 10 |
| Chromium | 21 | 21 | 18 | 13 | 20 | 18 | 80 | 370 |
| Copper | 42 | 26 | 27 | 18 | 33 | 23 | 65 | 270 |
| Mercury | 0.3 | <0.1 | <0.1 | 0.3 | 0.4 | 0.2 | 0.15 | 1 |
| Nickel | 15 | 17 | 15 | 10 | 15 | 13 | 21 | 52 |
| Lead | 50.5 | 31.9 | 35.2 | 19.3 | 31 | 23.1 | 50 | 220 |
| Zinc | 338 | 242 | 161 | 99 | 189 | 98 | 200 | 410 |
These initial results show that for most heavy metals there is very little difference between the upstream and downstream site. However, both lead and zinc have been slightly higher at the downstream site.
It is likely that the slightly elevated Mercury levels are of natural origin, especially as they are higher at the upstream site. The elevated zinc levels at the downstream site are possibly a result of leaching from galvanised steel in the stream or runoff from roads and roofs, while the slightly elevated lead levels are most likely a result of road run-off.
The dataset is limited, so care should be taken with this interpretation of the results. Sampling will continue at these two sites and other sites will be investigated in the future.
Compliance with ANZECC guidelines
The site compliances with the ANZECC guidelines for all years of data and for the 2006 data for each parameter are in tables 7 and 8 in Appendix C. For more information on the guidelines used to assess compliance check out the methods section.
The following maps (figures 18 to 26) show the percentage of samples for each site that comply with the ANZECC guidelines for all years. The points are colour coded from worst to best i.e. red - less than 25% of samples comply, green – at least 75% of samples comply and blue – all samples comply.
The points are split into the following categories:
· Minimum to < 25% of samples comply
· 25 to < 50% of samples comply
· 50 to < 75% of samples comply
· 75 to < 100% of samples comply
· All samples comply (100%)
Dissolved oxygen
Only one of the 21 RWQMN sites comply with the ANZECC guideline range for dissolved oxygen on more than 50% of sampling occasions. Waitangi River at Watea complies with the dissolved oxygen guideline range on 71% of sampling occasions.
It should be noted that although Waipoua River is only compliant with the guideline range on 33% of sampling occasions, it is classed as an upland river and therefore has a smaller DO range of 99 to 103% saturation compared to the range for lowland rivers of 98 to 105%.
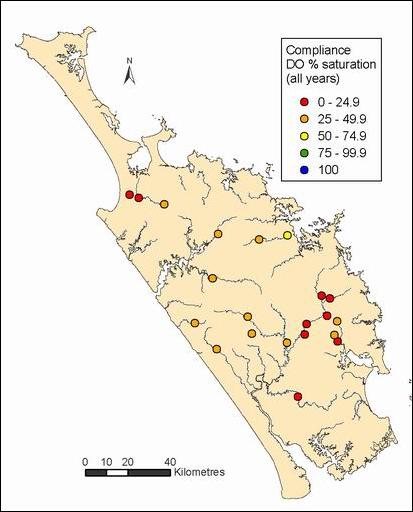
Figure 18: Percentage of dissolved oxygen (% saturation) results that comply with the ANZECC guidelines for 21 RWQMN sites for all years sampled.
pH
Three sites comply with the ANZECC pH range on less than 25% of sampling occasions; Waitangi at Waimate, Wairua at Purua and Mangahahuru Stream at Apotu Road. Five sites comply with the pH range on more than 75% of sampling occasions.
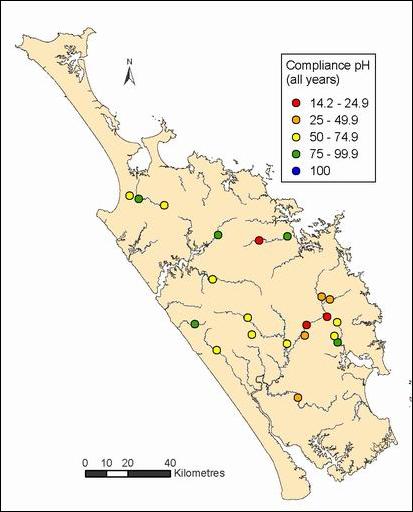
Figure 19: Percentage of pH results that comply with the ANZECC guidelines for 21 RWQMN sites for all years sampled.
Water clarity
Thirteen of the 21 RWQMN sites comply with the ANZECC guidelines for water clarity for the protection of aquatic ecosystems on over 75% of sampling occasions. Only two sites comply with the guideline on less than 50% of sampling occasions; Awanui above Waihue channel and Wairua at Purua.
However tighter guidelines are used for waters classified for the purpose of contact recreation from the RWSP (NRC 2007). Although Northland's rivers have not been classified, many are used for contact recreation.

Figure 20: Percentage of water clarity (m) results that comply with the ANZECC guidelines for 21 RWQMN sites for all years sampled.
Turbidity
Less then 25% of sampling occasions for Waiotu River, Wairua at Purua and Waiarohia at Whau Valley comply with the ANZECC guideline for turbidity, while seven sites comply with the ANZECC guidelines over 75% of the time, as shown in figure 21 (below).
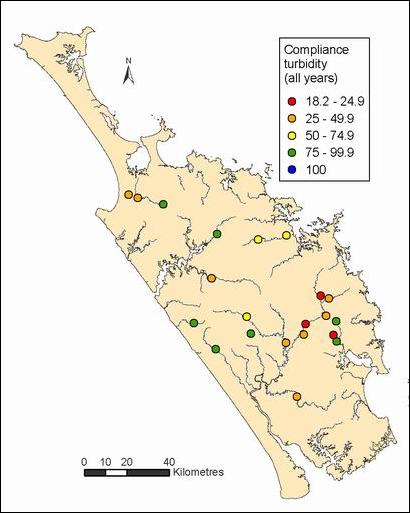
Figure 21: Percentage of turbidity (ntu) results that comply with the ANZECC guidelines for 21 RWQMN sites for all years sampled.
Ammoniacal nitrogen
Three headwater sites comply with the ammoniacal nitrogen ANZECC guideline on all sampling occasions; Waipapa River, Waiarohia Stream at Whau Valley and Mangahahuru Stream at Main Road. Mangere River only complies with the guideline on 13% of sampling occasions. The Waipoua River site does not appear to perform as well as the other headwater sites because it is the only site that has been compared to the ANZECC trigger value for an upland river.
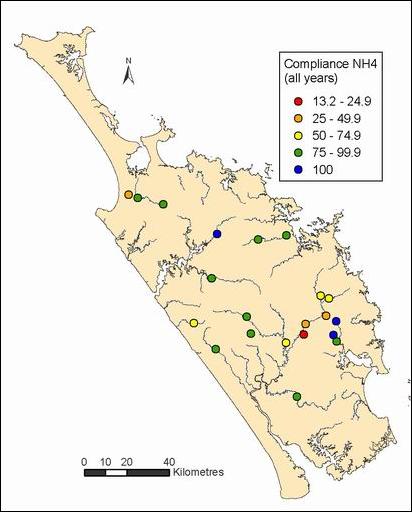
Figure 22: Percentage of ammoniacal nitrogen (g/m3) results that comply with the ANZECC guidelines for 21 RWQMN sites for all years sampled.
Nitrate/nitrite nitrogen
Five sites comply with the ANZECC guideline for oxides of nitrogen (or otherwise known as NNN) on all sampling occasions. They are Victoria, Waipoua, Waipapa and Opouteke River sites and the site at the FNDC water take on Awanui River. Mangere River only complies with the guideline on 15% of sampling occasions.

Figure 23: Percentage of nitrate/nitrite nitrogen (g/m3) results that comply with the ANZECC guidelines for 21 RWQMN sites for all years sampled.
Total nitrogen
Mangahahuru Stream at Main Road is the only site that complies with the ANZECC guideline for TN on all sampling occasions. Three sites exceeded the guideline on over 75% of sampling occasions; Punakitere River, Mangere Stream and Waiarohia Stream at Whau valley.

Figure 24: Percentage of total nitrogen (g/m3) results that comply with the ANZECC guidelines for 21 RWQMN sites for all years sampled.
Dissolved reactive phosphorus
Mangahahuru Stream at Main Road was the only site that complied with the DRP guideline on all sampling occasions. There were 10 sites that exceeded the guideline on more than 75% of sampling occasions, of which for the following sites it was on more than 95% of occasions; Manganui, Mangere, Awanui at Waihue Channel and Wairua at Purua.
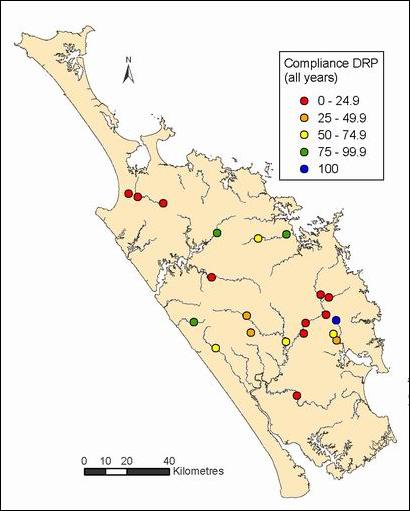
Figure 25: Percentage of dissolved reactive phosphorus (g/m3) results that comply with the ANZECC guidelines for 21 RWQMN sites for all years sampled.
Total phosphorus
Eleven sites exceeded the guideline for TP on more than 75% of sampling occasions, of which the following sites exceeded the guideline on more than 95% of sampling occasions; Mangere, Awanui at Waihue Channel, Mangahahuru at Apotu Road, Waiarohia at Whau Valley and Wairua at Purua. Four sites complied with the guideline on more than 75% of sampling occasions.
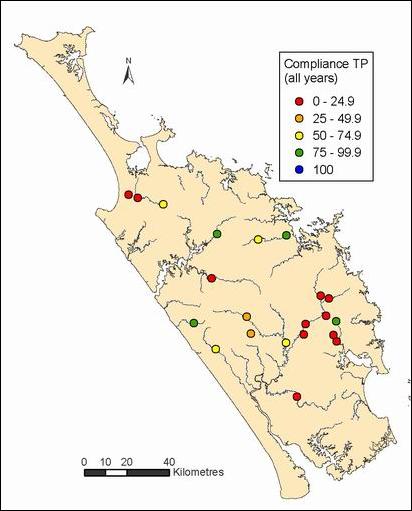
Figure 26: Percentage of total phosphorus (g/m3) results that comply with the ANZECC guidelines for 21 RWQMN sites for all years sampled.
Compliance with recreational bathing guidelines
The site compliances with the recreational bathing guidelines for all years of data and for the 2006 data are in tables 7 and 8 in Appendix C. This includes both the guideline for Escherichia coli (bacteria) (MFE 2002) and water clarity from the RWSP (NRC 2007). For more information on the guidelines check out the methods section.
The following maps (figures 27 and 28) show the percentage of samples for each site that comply with these guidelines for all years, following the same format as the maps above.
Escherichia coli (bacteria)
Compliance with the microbiological water quality guideline of 550 E. coli/100mL (MFE 2002) for all data available for each RWQMN site is shown in figure 27 (below). The following five sites comply with the recreational bathing guideline for E. coli on 85 to 95% of sampling occasions; Waipapa, Waipoua, Mangakahia at twin bridges, Opouteke and Mangahahuru at Main Road. Two sites only complied with the guideline on less than 50% of sampling occasions; Mangere Stream at Knights Road and Waiarohia at Whau Valley.

Figure 27: Percentage of E. coli (MPN/100mL) results that comply with the recreational bathing guideline for 21 RWQMN sites for all years sampled.
Water clarity
Compliance with the water clarity guideline for recreational purposes of 1.6 m for all data for each RWQMN site is shown in figure 28 (below).
Only two sites, both headwater sites, comply with this guideline on at least 75% of sampling occasions; Victoria and Waipoua River and only a further 3 sites comply with the guideline at least 50% of the time.
Seven sites comply with this guideline on less than 10% of sampling occasions. This means that for these 7 rivers water clarity is likely to exceed the RWSP guideline of 1.6 m for at least 10 months of the year.
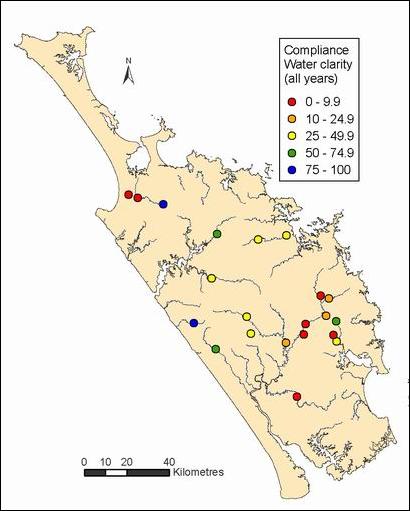
Figure 28 Percentage of water clarity (m) results that comply with the RWSP guideline for contact recreation waters for 21 RWQMN sites for all years sampled.
Compliance with drinking water standards
Some Northlanders in rural areas use untreated water from rivers and streams for their domestic supply, including human drinking water. Based on the E. coli results for the RWQMN sites in figure 27 (above) there are no rivers in Northland, including rivers in pristine native forested catchments, that would have microbiological water quality that meets the NZ drinking water standard of less than 1 E. coli/100mL (MoH 2005). Note this standard is the Maximum acceptable value for microbiological contamination for drinking water leaving a treatment plant. Therefore water taken directly from rivers and streams in Northland is not suitable for human drinking water without treatment.