Surface water quantity
The quantity of water available in a specific water resource (for example, groundwater, springs, rivers, lakes and wetlands) is a key attribute with respect to its values and the actual and potential use of that resource.
Natural river and stream flows and lake and wetland levels are driven by rainfall. However, other variables such as catchment geology, soils, vegetation cover, and land uses have an influence. When rains fall onto land some seeps into the ground and becomes part of the groundwater system, while most of the rest flows over land into our lakes, wetlands, streams and rivers, and eventually to the ocean. However, some water will also be taken up by plants and some will evaporate before it flows into a water body. Most of Northland's major river systems drain to estuaries and harbours.
 Mangakāhia River near Twin Bridges.
What do we want for our surface water quantity?
The operative Regional Policy Statement for Northland details existing council and community objectives for each natural and physical resource in our region. The objectives relating to surface water quantity are:
• The maintenance of the flows and levels in significant streams, rivers and wetlands to preserve their natural character and to protect high ecological, cultural or scenic values.
• The maintenance of water flows and levels in natural water bodies that are sufficient to preserve their life-supporting capacity, natural character, intrinsic values and any associated or dependent values.
• The maintenance of groundwater levels to the extent that the use of groundwater is sustainable.
• The efficient use and conservation of water resources.
• To protect property and other values from adverse effects due to the diversion of water from its natural drainage pattern.
The operative Regional Policy Statement also states anticipated environmental results as a consequence of implementing the policies and methods for achieving the water quantity objectives:
• Protection of important freshwater habitats, particularly wetlands from reductions in surface water and groundwater levels;
• Preservation of the natural character, intrinsic, ecosystem and amenity values of water bodies to the extent that these depend on water levels and flows;
• Protect the values of water bodies held by tangata whenua;
• Sustainable and efficient use of the water resources in Northland;
• Increased awareness of water conservation and the greater implementation of water; and
• Minimisation of actual and potential damage to property from damming, diversion and discharge of runoff.
Note: the operative Regional Policy Statement is currently being reviewed. The proposed Regional Policy Statement (2013) is available at www.nrc.govt.nz/RPS
 Council staff at Waipoua River measuring low water flows.
What are Northland's surface water resources?
Rivers
Northland has a dense network of rivers and streams, many of which are relatively short with small catchments. Catchments on the east coast tend to be smaller than those on the west coast. Most of the major rivers have their outlets into harbours with few discharging directly to the coast.
Differences in flows between catchments can be attributed to rainfall patterns, catchment size and geology. In Northland, catchment geology greatly influences low flow during drought conditions. Fractured basalt rock readily absorbs rainfall and slowly releases it through springs. This slow release sustains the flow during dry periods at more than 3.5 litres per second per square kilometre. Examples of rivers flowing through basaltic and greywacke geology are the Punakitere, Waipao, Waipapa and Ngunguru rivers.
Catchments with less pervious geology absorb less rain and therefore have less water available in storage. Flows from these catchments tend to recede quickly during dry summers, with little sustaining base flow. Many streams in the Aupōuri Peninsula have little or no base-flow and in catchments where there is underlying mudstone-sandstone geology, less than 1l/s per km2 is released during drought months. Examples of rivers in Northland that flow through catchments of mudstone-sandstone geology are Selwyn Swamp and the rivers of the Awanui catchment.
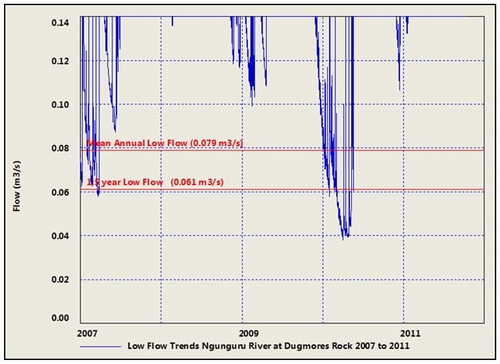
Water level and flow trends in Ngunguru River, east of Whāngārei for the period January 2007 to December 2011 are shown in Figure 64 and Figure 65. This flow monitoring station is an original Northland representative basin (catchment) with records starting in 1969. There are no known water takes upstream of this station. The plots in the graph show extremes in water levels and flows ranging from extreme high flows to extreme low flows.
Figure 64: River level trends in the Ngunguru River 2007-2011
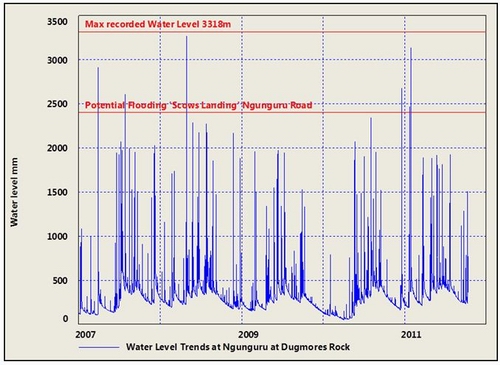
Figure 65: Low flow limits in the Ngunguru River 2007-2011 show significant dry periods in 2007 and during the Northland drought in 2009/2010
Lakes and wetlands
Northland has a large number of small and generally shallow lakes and associated wetlands, most of which have been formed between stabilised sand dunes along the west coast. These dune lakes generally have little or no continuous surface in-flows or out-flows, being primarily fed by rainfall directly on to their surfaces and surrounding wetlands. As a result, their levels fluctuate considerably with climatic patterns. The council monitors water levels in 16 lakes monthly in the Poutō and Aupōuri peninsulas and also at one inland lake near Kaikohe, Lake Owhareiti.
Groundwater base-flows
In some areas of Northland, groundwater discharges to the surface as discrete springs and/or along the base of streams. During periods of low rainfall these groundwater discharges are particularly important as they maintain flows within the streams and rivers. These are referred to as groundwater base-flows.
The main areas in Northland where groundwater base-flow is an important component of surface water flows are the areas surrounding fractured basalt fields such as Whāngārei, Kaikohe and Kerikeri. In such areas, low groundwater levels result in low groundwater base-flows in streams and rivers.
Investigations have been undertaken to calculate the effects of stream depletion as a result of groundwater abstractions. For more information refer to the groundwater resources chapter of this report.
Rainfall
Northland's weather during the period 2007 to 2011 was influenced by a series of extreme rainfall events and severe droughts.
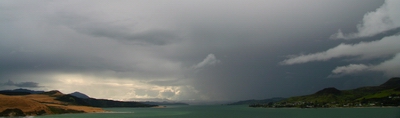 Isolated rain storm over the Hokianga Harbour (©: Bee Scene Photography).
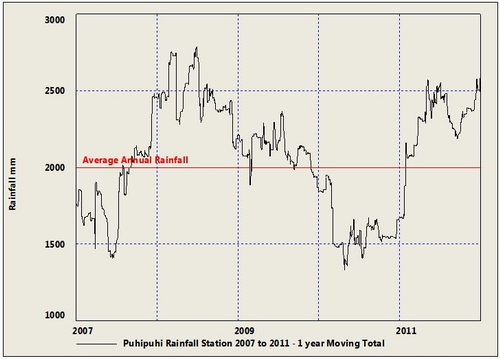
Annual rainfall for Northland ranges from 900mm in low-lying coastal areas to over 2900mm at higher altitudes. Rainfall patterns in Northland over the five-year period January 2007 to December 2011 were quite variable. In 2007, 2008, and 2011 the region experienced average to above average rainfall (mainly attributed to a series of significant rainfall events). On the other hand, 2009 and 2010 were characterised by below normal rainfall for most of the region, particularly in the Far North and eastern areas. This was due to strong dry weather patterns during late 2009 to April 2010 and November 2010 to January 2012. Annual rainfall plots for the five-year period January 2007 to December 2011 are shown below.
Rainfall trends 2007 to 2011
Figure 66: One-year moving mean rainfall trends 2007 to 2011 at Puhipuhi rainfall station
Droughts
Northland experiences two types of drought; regional and localised. A regional drought, on average, occurs once every three years at east coast and inland locations, and once every four years at west coast and higher altitude locations.
 Lake Owhareti during the 2009/2010 drought (©: Bee Scene Photography).
The major effects of low rainfall resulting in drought conditions include:
• Reduced stream habitat caused by lower water quantity and quality.
• Elevated rates of evaporation depleting soil moisture and affecting plant growth.
• Minimal grass cover, early drying off of dairy herds, low milk production, loss of income from selling stock.
• Very little recharge of groundwater resulting in low spring flows (base-flows to rivers) and low groundwater levels.
• Major storage dams and lakes in Northland reach low levels. Water supplies from shallow bore springs and streams can dry up.
• Costly transport of water to rural residents.
• Public water use restrictions imposed by district councils.
Northland experienced two droughts in the 2007-2011 period: from November 2009 to May 2010 and November 2010 to early January 2011. On both occasions the Government declared Northland a moderate level drought zone.
For more information please refer to the technical reports entitled ‘The Northland Drought of 2009-2010 Final Report' (NIWA: December 2010) and ‘NRC 2010 LA NINA December 2010.pdf', available on request from the Northland Regional Council.
Flooding
Flooding tends to occur during winter months when flows in rivers and streams are high and soils saturated. However, it can also occur in summer when cyclones, usually down-graded to tropical depressions, make their way far enough south to the Northland Peninsula.
There are several other factors that contribute to flooding in the region, which tends to be ‘flashy' and can occur at any time, including:
• Small steep catchments.
• Relatively impervious clay soils.
• Low river gradients.
• Tidal influence, particularly in some of Northland's estuaries (drowned river systems), which can back-up flood waters. This can be exacerbated by raised sea levels due to storm surge and/or low atmospheric pressure during some storms.
• Reduced extent of wetlands, and rivers being disconnected from their flood plains by stopbanks so sediment builds up in the river channel decreasing its capacity to hold water.
• Heavy exotic weed infestation and nuisance willow trees in many drainage areas.
• Reduced vegetation cover and urban impervious surfaces.
Another factor to consider is that land use and development in Northland is often situated in flood prone areas and flood plains.
Flooding is the most common reason for civil defence emergencies in Northland. Major floods have been recorded in Northland, by various sources, since 1917. The following table lists significant rainfall events during 2007-2011.
Table 27: Significant rainfall events during 2007-2011
| Year | % mean annual rainfall variance | Significant events |
| 2007 | 86% – 146% | Floods: • 17 severe weather warnings. • 3 severe weather warnings produced events that resulted in significant flooding. • 5-7 February (Waitangi Day) – major rainfall event. Maximum rainfall totals of 160mm to 212mm with maximum intensities of 31.5mm/hr. • 29 March – over 40 hour's duration, rainfall amounts exceeded 400mm and were in excess of 1:100 Annual Exceedance Probability (AEP) estimates. • 10-11 July 2007 – up to 240mm of rain was received over a 12 hour period. Severe gale force winds. |
| 2008 | 94% – 143% | Floods: • 14 severe weather warnings. • 3 severe weather warnings produced significant flooding events. • Severe rain event 23 February over 37 hours. Maximum rainfall amounts from 200mm to 250mm. • 21 January – remnants of Cyclone Funa downgraded to a sub-tropical depression. • 13-15 April – severe thunderstorm activity recorded at Opononi/Ōmāpere 55mm/hour and over three hours 94mm recorded. |
| 2009 | 64% – 121% | Floods: • 7 severe weather warnings. • 3 severe weather warnings produced significant flooding. • 27-28 February – intense thunderstorm activity with maximum intensities 20 to 30mm/hour and maximum rainfall amounts over 12 hours of 100 to 150mm. • 5-6 March – moderate event resulting in minor wind and flood damage. Droughts: • Severe drought conditions staring from November 2009 to end of year. Rainfall totals for the six-month period November 2009 to April 2010 were the lowest on record for four long-term rain gauges (see drought section below). |
| 2010 | 67% – 106% | Floods: • 11 severe weather warnings. • 5 severe weather warnings issued after May. Droughts: • Continued drought conditions from January-May. • Return to drought conditions October to December. |
| 2011 | 83% - 151% | Floods • 28-29 January – significant rain event resulting from ex-Tropical Cyclone Wilma. Major flooding and infrastructure damage. Droughts: • Drought conditions continued through until mid January. |
Further information can be sourced from the following technical documents, which are available on request from the Northland Regional Council:
‘NIWA Report Northland Storms March and July07.pdf', ‘NRC Storm 29 March 2007 FINAL.pdf', ‘MetService Wind Report Storm 10 July07.pdf' and ‘NRC Ex Cyclone Wilma January 2011.pdf'.
What are the issues affecting surface water quantity in Northland?
Demand for surface water – pressures
While the quantity of freshwater in Northland's water bodies fluctuates naturally, climate change, land uses, extraction, damming, and diversion can impact on natural flows and levels.
Several of Northland's catchments have relatively high levels of allocation for a variety of consumptive uses. Abstraction of the full allocation has the potential to cause environmental issues during prolonged dry periods because demand during this time is the highest. Uses include agriculture, horticulture, water supply to towns and cities and industry sectors.
Northland Regional Council is required to balance demand for water resources with the need to safeguard the life-supporting capacity of aquatic ecosystems, protect the natural character of water bodies, and provide for other important environmental bottom lines.
Environmental effects of reduced flows and levels include, but are not limited to, elevated water temperatures, depleted oxygen levels, increased algal growth and general degradation of water quality. Less water in rivers, streams, wetlands, and lakes can reduce their ability to assimilate waste. Reduced flows and levels also mean smaller habitats for aquatic organisms.
 A water take for pasture irrigation on the Mangakāhia River.
Of particular concern in Northland is the impact of land uses on water levels in lakes and wetlands. It is important that water is used efficiently so that maximum value and enjoyment can be gained from its use.
The Regional Water and Soil Plan for Northland contains rules that control the use of land, extraction, damming, and diversion for the purposes of managing water quantity.
Consented surface water takes
Under the Regional Water and Soil Plan for Northland most small surface water takes are permitted provided that certain standards and terms are met. Permitted activities include taking water for domestic and stock drinking needs however most larger takes require resource consent.
As at 31 December 2011 there were 268 consents that allocated up to a total of 542,700m3 of water per day to be taken from surface water bodies and dams. This volume however does not include the Wairua Power Station take, as this consent is to take, divert and discharge 30m3 per second back into the river, that is, it's a non-consumptive take. It is also important to note that the total allocation does not necessarily represent the actual volume of water taken per day.
The number of consents has decreased by 113 since the 2007 State of the Environment report, while the volume of water allocated has increased slightly (500,000m3/d: 2007 State of the Environment report). This is a result of consents being surrendered and a number of new consents for larger takes being obtained, and some expiring and not being replaced.
There are more consents to take groundwater than surface water from rivers, lakes, and springs. However surface water takes, including those from dams account for 92% of the total water allocated as shown in Table 28.
Table 28: Source of water allocated in Northland (note: figures are approximate)
| Rivers, lakes, springs | Dams | Groundwater | |
| Percentage of consents | 40 | 11 | 49 |
| Percentage of allocated daily volume | 46 | 46 | 8 |
‘Permitted' surface water takes
The Resource Management Act allows for freshwater to be taken and used "as of right" for stock drinking water and domestic purposes provided the take or use does not, or is not likely to, have an adverse effect on the environment and it is a "reasonable" volume (Resource Management Act, section 14(3)(b)).
This is reflected in the Regional Water and Soil Plan for Northland, which allows for a small volume of water to be taken per water user. However, there is the possibility of adverse effects on the environment where a large number of water users are extracting freshwater from the same water body over a period of time or when water users take more than is permitted, which is highly likely in some areas.
The council currently has limited information about the locations and volumes of water taken as permitted takes. To help understand the pressures on surface water resources the council has estimated permitted water use based on dairy herd numbers and land use (including dry stock rate from land use inventory). These figures were then added to consented allocation to provide an indication of total water allocated within a catchment (see Figure 67).
Northland Regional Council will review its water allocation rules in the near future to ensure that they are effective, and where necessary will make changes to existing rules or include new rules.
Allocation
The Regional Water and Soil Plan currently contains minimum flows for rivers but does not contain minimum levels for lakes or wetlands, or any allocation limits (the amount of water that can be extracted above a minimum flow or level).
The council has assessed the likely level of allocation in the region's catchments using the methodology of the Proposed National Environmental Standard and Ecological Flows and Water Levels 2008.
Identifying areas of high allocation helps prioritise catchments for the establishment of freshwater objectives and the setting of associated water quantity limits required by the National Policy Statement for Freshwater Management 2011.
Figure 67: Likely level of allocation for Northland catchments
When interpreting Figure 67, it is important to consider:
• Full allocation is expressed as 30% of Mean Annual Low Flow for rivers and streams with mean flows less than or equal to 5m3/s; and, 50% of Mean Annual Low Flow for rivers and stream with mean flows greater than 5m3/s.
• There are no total allocation limits for catchments set in the current Regional Water and Soil Plan applications for water take consents are assessed on an individual basis.
• The Mean Annual Low Flow for many catchments has a large degree of uncertainty due to limited data.
• Allocation is based on both consented water takes from rivers and dams and an estimate of permitted water use.
• Actual takes are likely to be less than allocation.
A recent review of the flow criteria relating to Mean Annual Low Flows and design minimum flows (one in five-year, seven day low flow Daily Mean Flows) in Northland rivers, with long-term records, is shown in Appendix B.
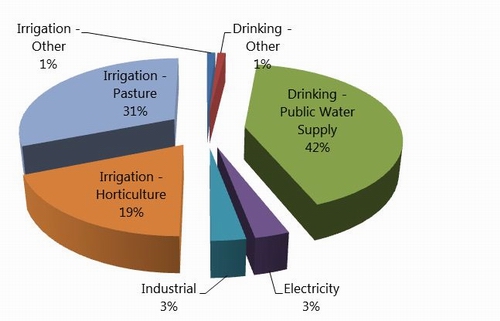
Irrigation is the main water use in Northland, with pasture irrigation accounting for 31% and horticultural irrigation 19% of total volume of water allocated. Water supplies to towns and cities account for 42% of total volume allocated whereas water use for industrial purposes is low, comprising only 6% of allocation (Figure 68).
Figure 68: Total water takes by volume
Most horticultural activities take place on the fertile volcanic soils near Maungatapere, Maungakaramea and Kerikeri, while pasture irrigation is present in the Wairua catchment (refer Irrigation Distribution map Figure 69).
Figure 69: Irrigation distribution in Northland
Lakes and wetlands
There are only a few surface water takes for lakes in Northland. However, as most lakes are relatively small and shallow they are sensitive to changing land uses and water extractions. They are also prone to nutrient enrichment from stock and fertiliser, particularly where lake-side vegetation has been grazed or removed, and where there is direct stock access to the lake, as they have a limited capacity to assimilate contaminants.
The drainage of wetlands has resulted, or contributed to, many wetland species being rare, threatened and endangered. Drainage has other adverse effects, such as loss of buffer storage for flood waters, which leads to increased flood peaks (faster and more intense flows in rivers and streams) and reduced summer flows, as well as loss in the capacity of wetlands to trap and reduce sediment, nutrients and other contaminants.
Dams and diversions
The number of dams in Northland is increasing. As at 31 December 2011, there were 155 consented dams, most of which are small. Dams that are less than 0.5m deep are primarily used on farms for stock water and rely solely on runoff for replenishment. While small dams deeper than 0.5m are generally used as storage dams for recreational parks and agricultural needs, there are some larger-scale dams that are used for a range of activities including agriculture, horticulture and public water supply.
Dams can affect fish passage, sediment transport, water quality and the natural flow regime of rivers and streams. However, they also realise many benefits including security of water supply, reduced demand for traditional takes (direct from the stream or river), and habitat for some native species.
As at 31 December 2011 there are 479 consents for diversions in Northland – diversion refers to redirecting or changing the natural course of a river or stream. Diversion activities include straightening river channels and building stopbanks to prevent water spilling into floodplains. Similar to dams, diversions can have both positive and negative effects on the environment and therefore need to be appropriately managed.
Land use
Land use changes can affect the natural flows and levels in water bodies. For example, impervious surfaces limit the amount of water that can enter groundwater and production forestry has a different water demand than pastoral farming.
As shown in the "Our land, our air" chapter, dairy farming has intensified in the last 10 years and pressures on water resources for stock drinking and dairy shed uses are likely to increase.
The total area in plantation forestry has decreased by about 12,000 hectares between 2002 and 2011. Total land in horticultural use has remained relatively constant over this period, although there has been a large increase in the area of avocado growing.
What is being done?
Policy documents
The National Policy Statement for Freshwater Management 2011 requires the Northland Regional Council to establish freshwater objectives (desired environmental outcomes) and set associated freshwater quality limits and environmental flows and levels (freshwater quantity limits) for all freshwater bodies in the region.
Freshwater objectives and limits must include an environmental bottom line to protect ecological and other intrinsic values. For freshwater quantity, this includes a minimum flow (in the case of rivers) or minimum level (in the case of lakes and wetlands) and an allocation limit (the volume of water that can be taken above a minimum flow or level). The current Regional Water and Soil Plan only contains minimum flow standards for rivers, but no minimum levels for lakes or any allocation limits.
Once included in the Regional Water and Soil Plan, the council is required to manage abstraction, drainage diversion, and use of land generally to achieve freshwater objectives and prevent and phase out the exceedance of water quality and quantity limits.
The council has prepared a staged programme by which it will implement the freshwater policy statement. The programme involves establishing freshwater objectives and setting freshwater quality and quantity limits on a prioritised basis, starting with catchments/water bodies where pressures on water are high and/or uses and values associated with water are important.
The council recently notified a proposed new (second) Regional Policy Statement. This document identifies the significant resource management issues for the region and includes policies and methods to address them in an integrated way. Improving the management of water quantity is a key feature of the document.
Together, the national freshwater policy and the proposed Regional Policy Statement will drive improvements in the way freshwater quantity is managed in Northland.
Sustainable Water Allocation Project
The Sustainable Water Allocation Project was adopted in the Long Term Council Community Plan 2009 to update and implement a more rigorous water allocation regime, to ensure Northland's water resources are managed in a sustainable way and not over allocated. This project underpins Northland Regional Council's programme to implement the national freshwater policy statement.
To date the project has/is:
• Reviewed the way consented water take information is stored to provide consistency.
• Assessed the level of allocation at a regional scale against proposed National Environmental Standards on ecological flows and water levels.
• Investigated methodologies for assessing integrated ground/surface water resources.
• Undertaking an ecological flow assessment in the Otaika catchment to determine minimum flows and allocatable volumes for ecological values.
• Identifying and filling gaps in low flow data.
• Investigating suitability of using modelled data to determine minimum flows and allocation limits.
• Improving data on actual water use verses consented volumes.
• Naturalising flow data (the naturalised flow is the measured river flow adjusted to take account of net abstractions and discharges upstream of the flow measuring station).
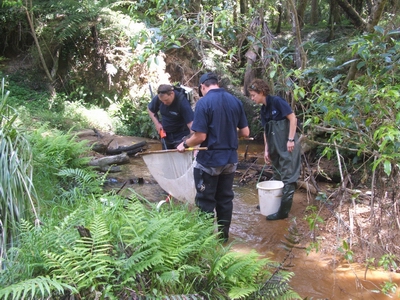 Fish survey being undertaken as part of Otaika ecological flow assessment.
Water shortage and drought response
In response to a serious temporary water shortage in Northland the council can issue a water shortage direction to allow continued water takes (pursuant to Section 329 of the Resource Management Act). Compliance with resource consents, efficient use of water and voluntary reductions are important prerequisites to the implementation of a water shortage direction. The maintenance of people's health (public water supply) is given the highest priority of water use.
There were two severe droughts in Northland during the period 2007-2011: the first from November 2009 to May 2010 and the second from October 2010 to early January 2011. The Northland Regional Council provided water management advice, monitoring and reporting to major water users and the public, and managed consent compliance. District councils were responsible for public water supplies, demand management and water conservation strategies. All three district councils (the Far North, Whāngārei and Kaipara) were warned of the pending water shortage in December 2009 and encouraged to plan appropriately.
The main policy on drought response emphasises the data collection network, publicity and early warning of potential drought problems. This includes the notification of pending water shortages and dissemination of information, modifying water use, and compliance monitoring.
The Northland Regional Council issued four water shortage directions during the drought, which allowed the district councils to continue to take water from specific rivers, subject to conditions, to ensure public water supply.
 Awanui River, Kaitāia, during the drought conditions.
The Northland Hydrometric Network
The Northland Regional Council operates a hydrometric network consisting of 95 sites throughout Northland, which collects continuous river flow data at intervals of between one and 15 minutes. This is an increase of 35 automatic stations since the last report (Northland Regional Council: 2007).
The New Zealand Meteorological Service (MetService) and the National Institute of Water and Atmosphere (NIWA) also operate hydrometric and climate stations in Northland.
Table 29: Northland Automatic Hydrometric Stations
| Northland Regional Council | · 42 river level stations · 9 tidal stations · 36 rainfall stations · 9 groundwater stations |
| NIWA | · 1 rainfall station |
| MetService | · 7 climate stations |
Understanding river flows is vital for establishing freshwater objectives and water quality and quantity limits.
Of the 96 continuous data recording sites, 95 are part of a telemetry system where data can be sent via radio or cellular phone to a base station at the council office in Whāngārei. These telemetered sites provide a real-time picture of the flow state of the region's water resources.
Telemetered data from the hydrometric stations is captured and updated on the council's website hourly: www.nrc.govt.nz/riversandrain
Figure 70: Northland Hydrometric Station locations
How we are measuring up against our objectives?
The operative Regional Policy Statement states the anticipated environmental results as a consequence of implementing policies and methods to achieve the water quantity objectives.
Protection of important freshwater habitats, particularly natural wetlands from reductions in surface water and ground water levels
• As at 31 December 2011, 926 wetlands have been recorded on the council's database and linked to Geographic Information System points. There are many others that have yet to be identified.
• Over 300 of the best wetlands on the database have been scored and ranked as Northland's "Top Wetlands". A mail-out to the landowners of the highest ranked 150 of these wetlands was due for completion in 2012. So far 150 landowners of 46 wetlands in the Kaipara and Whangārei districts have been contacted offering advice, information and possible assistance to maintain them.
• Factsheets for the main wetland types with guidelines for protection have been produced and included in the package.
• Guidelines for identifying wetlands and Significant Indigenous Wetlands under the Regional Water and Soil Plan are currently being developed. These will be helpful for staff and practitioners in the field, when interpreting rules about wetlands.
Preservation of the natural character, intrinsic, ecosystem and amenity values of natural water bodies to the extent that these depend on water levels and flows
• Current policy within the Regional Water and Soil Plan provides for the recognition of rivers and lakes deemed to have outstanding values and protection of their flows and levels. It also provides for minimum flow requirements in rivers to protect life-supporting capacity – however there is the ability to go below these minimum flows in exceptional circumstances. Rules in the plan are currently very restrictive around Significant Indigenous Wetlands, dune lakes, and rivers (or sections of rivers) and lakes deemed to have outstanding values, with many activities affecting flows and levels being non-complying.
• Because of this policy and subsequent rules, the majority of consents issued to take and use water will have conditions specifying maximum quantities, and minimum flows at which time the take must cease. Permitted activity rules for water takes also specify maximum quantities for certain periods of the year, that is, less water may be taken over the drier summer months, in order to reduce negative effects on flows and levels because of seasonal fluctuations.
• Finally, the council now has much better information and tools/modelling available in order to more accurately predict and map allocation within Northland based on current government direction. This allows the council to prioritise those catchments that are considered highly allocated, in order to direct resourcing at these first.
Protection of the values of water bodies held by tangata whenua
• As part of managing freshwater quantity in the region, the Resource Management Act (ss 6(e), 7(a), and 8) requires the Northland Regional Council to:
o provide for the relationship of Māori and their culture and traditions with their ancestral lands, water, sites, wāhi tapu and other taonga;
o have particular regard to kaitiakitanga; and
o take into account the principles of the Treaty of Waitangi (Te Tiriti o Waitangi).
These were undertaken as part of drafting the operative Regional Water and Soil Plan for Northland and are undertaken as part of resource consenting processes.
• The Regional Water and Soil Plan also identifies rivers and lakes that have outstanding values, including Māori cultural values.
• The Freshwater National Policy Statement (Policy D1) requires Northland Regional Council to take reasonable steps to:
- involve iwi and hapū in the management of freshwater and freshwater ecosystems in the region;
- work with iwi and hapū to identify tangata whenua values and interests in freshwater and freshwater ecosystems in the region; and
- reflect tangata whenua values and interests in the management of, and decision-making regarding, freshwater and freshwater ecosystems in the region.
These matters will be addressed through the council's programme for implementing the Freshwater National Policy Statement – Waiora Northland Water.
Sustainable and efficient use of the water resources of Northland
• In general, the region's freshwater quantity is used sustainably and efficiently, however improvements are likely to be required in some catchments, particularly those with high levels of allocation. Improvements in efficiency will also likely be driven by the market.
Increased awareness of water conservation and the greater implementation of water conservation practices
• There is increasing understanding about the need to implement water conservation practices as part of sustainably and efficiently using water during dry weather. This has been driven by repeated droughts over the past several years.
Minimisation of actual and potential damage to property from damming, diversion, and discharge of run-off
• The Regional Water and Soil Plan currently contains rules relating to damming, diversion and discharge of runoff. The effects resulting from damming and diversion are largely managed through the consenting process. However, discharge of runoff is harder to manage. This is because it can be provided for as a permitted activity, provided that criteria are met including minimisation of adverse effects. However, this has proven difficult to monitor and enforce, particularly where there are multiple such discharges within a catchment.
• The council is currently undertaking flood mapping to identify areas at risk in priority river catchments. New policy is also being developed in conjunction with the new Regional Policy Statement, which has a chapter dedicated to natural hazards, including earthworks and land development/subdivision policy around avoiding natural hazards. Council is also progressing flood schemes, such as Kaeo, Whāngārei, Kaitāia and Kerikeri.
References
Northland Regional Council (2002). Regional Policy Statement for Northland. Produced by the Northland Regional Council. Whāngārei, New Zealand. www.nrc.govt.nz/RPS
Northland Regional Council (2007). Regional Water and Soil Plan for Northland. Produced by the Northland Regional Council. Whāngārei, New Zealand. www.nrc.govt.nz/rwsp
Northland Regional Council river and rainfall data: www.nrc.govt.nz/riversandrain
Ministry for the Environment (2007). Proposed National Environmental Standard on Ecological Flows and Water Levels
http://www.mfe.govt.nz/publication-search
National Policy Statement – Freshwater Management 2011 http://www.mfe.govt.nz/publication-search
Resource Management Act (Measuring and Reporting of Water Takes) Regulations 2010.
http://www.mfe.govt.nz/publication-search (October 2010 Updated July 2011)
Technical documents referenced in text available on request from the Northland Regional Council:
• NIWA Report Northland Storms March and July07.pdf
• NRC Storm 29 March 2007 FINAL.pdf
• MetService Wind Report Storm 10 July07.pdf
• NIWA Report Northland Drought 2009_2010.pdf
• NRC 2010 LA NINA December 2010.pdf
• NRC Ex Cyclone Wilma January 2011.pdf
Appendix B
Table 30: Estimated Design Drought Flows (DDF), Mean Annual Low Flows (MALF), Mean Flows and Median Flows in various Northland rivers
Site No. |
River |
Site name |
1:5 year DDF 7 day l/s |
MALF 1 day l/s |
MALF 7 Day l/s |
Mean l/s |
Median l/s |
|
| 802 | Selwyn Swamp | Big Flat Rd | 2 | 4 | 4 | 31 | 30 | |
| 1316 | Awanui | School Cut | 474 | 571 | 600 | 6084 | 2751 | |
| 1351 | Victoria | Victoria Valley Rd | 237 | 251 | 269 | 907 | 550 | |
| 1342 | Te Puhi | Meffin Rd | 58 | 97 | 112 | 1445 | 865 | |
| 1903 | Oruru | Dangen Rd | 435 | 480 | 506 | 2417 | 1294 | |
| 3432 | Rangitane | Stirling | 52 | 92 | 100 | 683 | 406 | |
| 3503 | Puketōtara | Backblocks | 127 | 197 | 219 | 1462 | 847 | |
| 3506 | Maungapareura | Tyrees Ford | 23 | 34 | 38 | 456 | 201 | |
| 3707 | Waiaruhe | Puketona | 392 | 479 | 517 | 4221 | 2056 | |
| 3722 | Waitangi | Wakelins | 674 | 940 | 1019 | 8253 | 4170 | |
| 3819 | Waiharakeke | Willowbank | 45 | 131 | 159 | 5070 | 1985 | |
| 4901 | Ngunguru | Dugmores Rock | 59 | 78 | 80 | 408 | 210 | |
| 5527 | Waiarohia | Lovers Lane | 37 | 58 | 62 | 346 | 150 | |
| 5528 | Raumanga | Bernard St | 67 | 81 | 86 | 341 | 195 | |
| 6007 | Waionehu | McLean Rd | 16 | 28 | 32 | 467 | 165 | |
| 6014 | Ahuroa | Durham Rd | 50 | 79 | 85 | 598 | 298 | |
| 6015 | North | Applecross Rd | 71 | 98 | 109 | 912 | 394 | |
| 6016 | Waihoihoi | St Marys Rd | 61 | 87 | 94 | 540 | 275 | |
| 6018 | Ahuroa | Braigh | 99 | 130 | 137 | 1254 | 562 | |
| 46609 | Mangere | Kara Weir | 48* | 62* | 67 | 329 | 181 | |
| 46611 | Kaihu | Gorge | 631 | 700 | 742 | 4002 | 2406 | |
| 46618 | Mangakāhia | Gorge | 1191 | 1423 | 1512 | 9652 | 4995 | |
| 46625 | Hikurangi | Moengawahine | 256 | 354 | 410 | 5083 | 1703 | |
| 46626 | Mangakahia | Titoki Br | 2427 | 3000 | 3300 | 25976 | 13017 | |
| *46627 | Waiotu | SH1 Br | 197* | 233* | 331 | 4365 | 1553 | |
| *46632 | Whakapara | Cableway | 653* | 851* | 932 | 6154 | 2450 | |
| *46641 | Waipao | Draffins Rd | 208* | 239* | na | 674 | 483 | |
| *46644 | Wairua | Purua | 1450* | 1850* | na | 18400 | 7756 | |
| *46646 | Mangere | Knights Rd | 102* | 119* | na | 1570 | 607 | |
| *46647 | Wairua | Wairua Br | 1780* | 2250* | na | 20976 | 11056 | |
| 46651 | Mangonui | Permanent Station | 155 | 259 | 283 | 8058 | 2627 | |
| *46674 | Mangahahuru | County Weir | 80* | 105* | 130 | 500 | 326 | |
| 46902 | Waipoua | SH 10 Bridge | 409 | 531 | 551 | 3156 | 1550 | |
| 47595 | Punakitere | Taheke | 565 | 690 | 732 | 6852 | 3255 | |
| 47804 | Waipapa | Forest Ranger | 539 | 682 | 714 | 4750 | 2175 | |
| 1046651 | Opouteke | Suspension Br | 497 | 577 | 610 | 3919 | 2057 |