Surface water quality
Northland has an extensive network of rivers and streams. None of them are considered major on a national scale as Northland's narrow land mass means most rivers are relatively short with small catchments. Most of the major rivers flow into harbours, rather than discharging directly to the open coast which means contaminants tend to take longer to disperse from these sheltered environments.
The Northern Wairoa River is Northland's largest river, draining a catchment area of 3650 square kilometres, or 29 percent of Northland's land area.
Flows in rivers vary considerably with rainfall and high intensity storms causing flash floods, while prolonged dry spells lead to very low flows in many smaller catchments. Northland's rivers are generally characterised as being slow flowing and muddy because the land is dominated by deeply weathered geology and fine clay soils.
Northland also has a large number of small, shallow lakes and associated wetlands. Most of these have been formed between stabilised sand dunes on the west coast. These dune lakes are grouped on the Aupōuri, Karikari and Poutō peninsulas. Most are between five and 35 hectares in area and are generally less than 15 metres deep. However, Lake Taharoa of the Kai Iwi group near Dargaville is one of the largest and deepest dune lakes in New Zealand. It covers an area of 237ha and is 37m deep. There are also a few volcanic and man-made lakes. Northland's largest lake is Lake Ōmāpere, which is 1160ha in area and located to the north of Kaikohe.
 Northern Wairoa River – Northland's largest river.
What do we want for water quality in Northland?
The operative Regional Policy Statement for Northland details existing council and community objectives for each natural and physical resource in our region. The objectives relating to water quality are:
• The maintenance or enhancement of the water quality of natural water bodies and coastal waters to be suitable, in the long-term, and after reasonable mixing of any contaminant with the receiving environment and disregarding the effects of any natural events for aquatic ecosystems, contact recreation, water supplies, and aesthetic and cultural purposes.
• The reduction and minimisation of the quantities of contaminants entering water bodies and coastal waters in particular those that are potentially toxic, persistent, or bio-accumulative.
• Avoid, remedy or mitigate the adverse effects of discharges of contaminants on the traditional, cultural and spiritual values of water held by tangata whenua.
The operative Regional Policy Statement also states anticipated environmental results as a consequence of implementing the policies and methods for achieving the water quality objectives:
• Water quality is suitable for desired purpose.
• Contaminants in water bodies are reduced.
• The adverse effects of contaminants in water bodies and coastal waters are avoided, remedied or mitigated.
• That all existing discharges of organic contaminants be via the best practicable option for treatment and disposal by the year 2004.
• That all new discharges of organic contaminants be via the best practicable option for treatment and disposal.
• Improved aquatic habitat.
Note: the operative Regional Policy Statement is currently being reviewed. The proposed Regional Policy Statement (2013) is available at www.nrc.govt.nz/newRPS
What are the issues affecting freshwater quality in Northland?
Like the rest of New Zealand, Northland's water quality varies greatly. In general terms, water is pristine in native forested headlands and then becomes increasingly contaminated as it flows through modified lowland catchments. These contaminants can enter the river in two ways:
• Point source discharges – the discharge of contaminants from a single facility at a known location (for example, a wastewater treatment plant) ; or
• Diffuse surface runoff – the discharge of contaminants via water running directly off the land, which can be either urban or rural.
The three main water contaminants of greatest concern in Northland are faecal pathogens, sediment, and nutrients. Pathogens are disease-causing organisms and obviously deserve being labelled contaminants however sediment and nutrients are only water contaminants by virtue of being in the wrong place; they belong on the land, not in the waterways.
While sediment and nutrients occur naturally in water, when too much soil and sediment washes off the land it becomes destructive in water. Nutrients, specifically phosphorus and nitrogen, should also stay on the land helping plants to grow there rather than in water. We want fertile land not fertile water.
Pathogens
When pathogens get into water they can make people and livestock sick. Salmonella, a well-known cause of food poisoning in humans, is also an emerging problem for livestock. Recent outbreaks in New Zealand have caused diarrhoea, loss of milk production, miscarriage, and deaths (Teague: 2011). The main sources of pathogens in freshwater are human sewage and animal manure.
While human waste in Northland is treated by wastewater treatment systems before being discharged to land or water, the extent and effectiveness of treatment varies. Storm overflows, broken sewer pipes, and poorly located and maintained septic tanks mean some sewage gets into water with little or no treatment.
When livestock manure gets into water, pathogens also get into water. Some manure is deposited directly into water where livestock have access to it. According to one study, dairy cows are over 50 times more likely to defecate straight into water rather than land, when given the opportunity (Parliamentary Commissioner: 2012).
Around 15% of dairy cow effluent is deposited in the shed during milking. Traditionally in Northland, this effluent was run through two-pond treatment systems and eventually discharged into water. These systems removed most of the solids, but pathogens often survived the process. Today, many dairy farmers irrigate shed effluent back onto land however pathogens can still be washed into the water if the storage pond overflows, the effluent irrigator breaks down, or the receiving land is too wet for the effluent to soak in.
The bulk of livestock manure is deposited directly onto pasture. Whenever it rains, some manure gets washed off the land into streams, rivers, and lakes. Additional sources of pathogens, such as Canada geese, dogs, and ducks, are insignificant nationally (Parliamentary Commissioner: 2012), but can be important in Northland (Northland Regional Council: 2011), particularly in small streams and ponded water.
 Animal effluent and stream bank erosion create bacteria, water clarity, and nutrient problems in freshwater.
Sediment
Sediment makes clear water murky (or turbid), smothers aquatic life, and sediment build-up alters water flows and exacerbates flooding. Sediment is made up of particles of soil and rock eroded from the land and washed or blown into rivers and lakes. Sediment is probably the most widespread and serious contaminant of water in Northland.
Erosion itself is a natural process – even the Waipoua River (one of Northland's pristine rivers) turns brown when it's in flood, and native ecosystems are adapted to such conditions. The problem is that land use activities that disturb soil accelerate erosion and increase the amount of sediment discharged to water. The loss of most of the region's wetlands and original forest cover has exposed soil to accelerated erosion.
 Sediment in the Kaihū River after a storm event.
Sediment ranges in size from fine particles of clay to boulders. Smaller particles of silt and clay tend to float in the water as ‘suspended sediment'. In calm water, they gradually settle to the bottom forming soft layers of ‘deposited sediment'. Waves, winds, and floods can stir up deposited sediment, filling the water with suspended sediment again.
Sediment is also a major source of phosphorus because phosphate clings to the surface of soil particles carried into water. Phosphorus is one of the two problem nutrients discussed in this report.
Pasture produces two to five times more sediment than an equivalent area of forest (Blaschke, P. et al.: 2008.). Animals can break down banks, putting soil directly into streams. Overgrazing pastures leaves soil exposed and sheep tracks along hillsides create channels for water to carry away soil into rivers, lakes, wetlands, and ultimately the coast.
Other land uses can also produce large amounts of sediment in waterways. Losses of soil from plantation forests are lower than from pasture for most of the forest rotation but when the trees are harvested and replanted, erosion rates go up 10-100 fold. Opencast mining, market gardening, urban development, and road building can all put sediment into water (Parliamentary Commissioner: 2012).
Nutrients
Plants and algae require nitrogen and phosphorus to grow, which are found naturally in water bodies. However, too much nutrient can cause algal blooms and other unwanted plant growth that impact on aquatic ecosystems.
Both nutrients occur in different chemical forms. The two common forms of nitrogen in water are nitrate and ammonia, whereas phosphorus mainly exists as phosphate. Both common forms of nitrogen – nitrate and ammonia – are highly soluble in water whereas phosphorus – in the form of phosphate – usually clings to soil and sediment.
Man-made sources of nitrogen include fertiliser runoff, urine from farm animals, and treated wastewater discharges. Phosphate usually gets into waterways via erosion, as sediment, because it clings to soil particles. Much of the phosphorus in freshwater today is a legacy of erosion caused by land clearance and fertilising for sheep farming.
Sewage and animal effluent are rich in both nitrogen and phosphorus. Many smaller wastewater treatment plants have limited treatment capability, leaving behind much of the nitrogen and phosphorus. Some sewers overflow at times and septic tanks can be poorly located and maintained. Animal effluent comes from dairy sheds, piggeries, freezing works, mole and tile drains, and from animals entering waterways. Manure can also wash off paddocks in heavy rain. Household detergents are also a source of phosphorus.
Although point sources of nitrogen and phosphorus can be very significant at specific places and times, overall they are much less significant than the diffuse sources. The great majority of the nitrogen that gets into fresh water comes from animal urine. The amount of phosphorus that gets into fresh water with sediment far outweighs inputs from point sources.
Resource consents
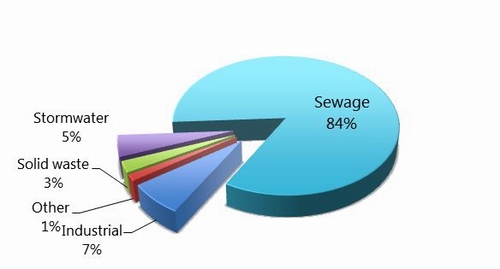
Point source discharges which cannot meet permitted activity criteria in the regional plans require resource consent. As at 31 December 2011 there were about 900 resource consents for discharges to water and another 450 for discharges to land. They include farm dairy effluent discharges, municipal wastewater discharges, stormwater and industrial discharges. Figure 55 and Figure 56 show the approximate number and type of consented discharges to water and to land in Northland at 31 December 2011.
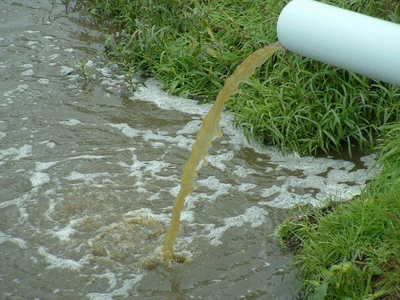 Nutrient rich overflow from a treatment pond discharging to a drain.
Figure 55: Northland Regional Council discharge to water consents
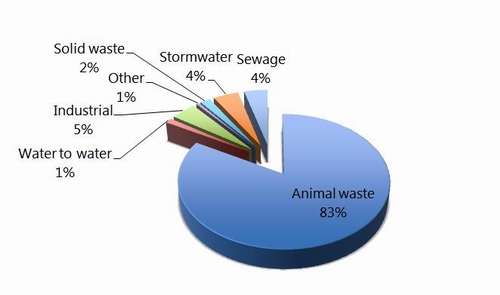
Figure 56: Northland Regional Council discharge to land consents
Farm dairy effluent discharges
Dairy farm numbers have remained relatively constant over the last five years. At the start of the 2011 dairy season there were 985 farm dairies being used in Northland. This included those milking cows for calf rearing but not supplying a milk processing plant. Of these, 716 were authorised by resource consent to discharge treated farm dairy effluent to water, although over 50% of these use land disposal as their primary method of disposal and only discharge to water for short periods of time in very wet conditions. The other 269 farms discharge effluent to water under the permitted activity critieria for land disposal in accordance with rule 16.1 of the Regional Water and Soil Plan for Northland.
The council monitors dairy farms annually under its Farm Dairy Effluent Monitoring Programme. Figure 57 shows farm dairy effluent compliance rates for the last nine years.
Figure 57: Farm dairy effluent compliance statistics based on Northland Regional Council monitoring
Industrial discharges
There are few major industrial discharges to water or land in Northland. At the end of December 2011 there were about 70 consented discharges (40 to water and 30 to land). Compliance rates for industrial discharges are shown in
Figure 58: Compliance rates for industrial discharges based on Northland Regional Council monitoring
Sewage waste discharges
The majority of sewage wastewater generated in Northland is collected and treated in community wastewater treatment plants. Across Northland, the Far North District Council, Kaipara District Council and Whāngārei District Council are responsible for 32 community wastewater treatment plants. All 32 treatment plants are operated under resource consents from Northland Regional Council. Twenty-four of these consents are for discharges to water; the remaining six are for discharges to land. Far North District Council has the most treatment plants with a total of 17, Whāngārei District Council has nine and Kaipara District Council has six. A number of the district council wastewater treatment plants have undergone upgrades in the last five years, including Kaeo, Kaitāia, Kawakawa, Whatuwhiwhi, Hikurangi, Ngunguru, Oakura, Whāngārei, Mangawhai and Maungaturoto.
As at 31 December 2011, there were also about 400 consents for the discharge of sewage to land from domestic "on-site" systems. If properly maintained, the environmental effects from septic tanks and other on-site systems are usually minimal. However, potential problems exist where the density of on-site systems is high, effluent soakage is poor and/or on-site systems are poorly maintained.
Over the last five years the council has recorded 564 incidents associated with sewage spills or non-compliances related to consented discharges. These incidents range from failing septic tanks to major sewage pump station discharges.
Stormwater
Stormwater discharges resulting from rain accumulates many different contaminants, including trace metals, hydrocarbons, nutrients, sediment, pathogens and faecal bacteria.
Most stormwater is discharged directly into water bodies without treatment. It is not uncommon for car washing detergent, traces of fuel, paint and other products to get washed directly into the stormwater systems. At 31 December 2011 there were 61 resource consents for the discharge of stormwater to land (21) or to freshwater (40).
Compliance with these consents has generally been very good with only three recorded instances of significant non-compliance over the past five years. The bulk of stormwater point source discharges are unconsented.
 Detergent from a stormwater pipe discharging to the Waiarohia Stream.
Environmental incidents
Environmental incidents such as oil or sewage discharges can have an adverse impact on surface water quality in Northland. The council has operated its 24/7 Environmental hotline service since November 1993. The number of incidents reported to the council potentially affecting inland surface waters and their recorded impact are shown in Figure 59. The number of incidents reported over the five years is reasonably consistent, ranging from 268 in 2009 up to 345 in 2010. 2010 also saw the most incidents with significant adverse effects.
Figure 59: Adverse effects of environmental incidents in Northland from 2007-2011
What is our river water quality like?
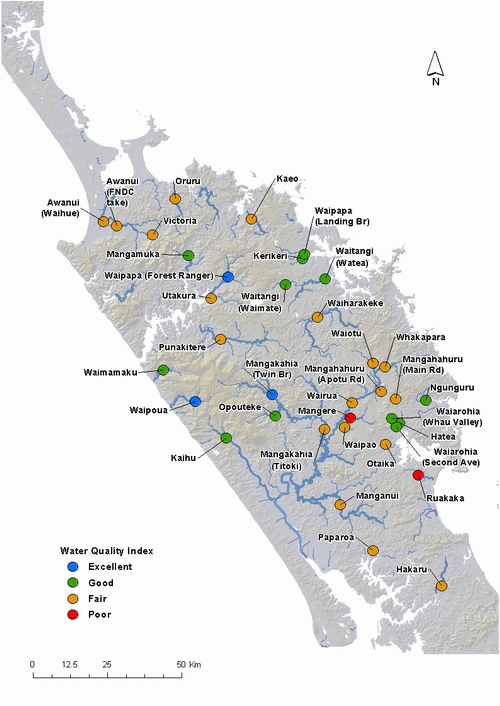
Northland Regional Council operates a region-wide River Water Quality Monitoring Network to assess the health of Northland's rivers and streams over time. There are 36 monitoring sites which were chosen to provide a representation of water quality across catchments of different geology and land use throughout the region.
Guidelines
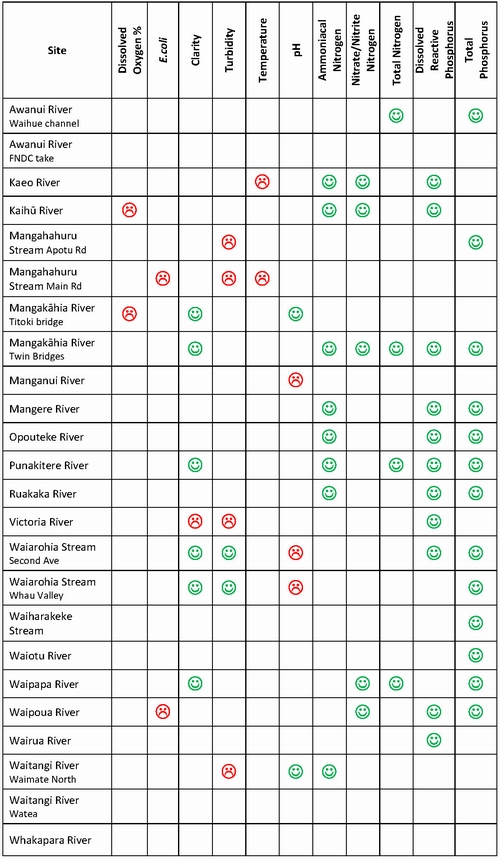
Key physico-chemical and microbiological monitoring data collected monthly from each monitoring site over the period 1 January 2007 to 31 December 2011 was summarised and compared, where available, against appropriate national water quality guidelines to provide an overview of the state of water quality at each site (Table 15).
In most instances the guideline values used were the Australian and New Zealand Environment and Conservation Council ‘default' trigger values for lowland aquatic ecosystems (cited here as ANZECC: 2000). There were some exceptions, as outlined in Table 15. In terms of microbiological water quality, the main E. coli trigger values relate to livestock drinking water, not contact recreation because the council has a separate monitoring programme to assess the suitability of popular river sites for contact recreation (see section "What is our freshwater recreational water quality like?"). The ANZECC (1992) stock water trigger values recommend a season median of 126 E.coli/100mL.
These trigger values are not legal standards and exceedances do not necessarily mean an adverse environmental effect would result (that is, they are not effects-based). Rather, they can be considered ‘nominal thresholds' (Ballantine et al.: 2010), where an exceedance is an ‘early warning' mechanism to alert resource managers to a potential problem or emerging change that may warrant site-specific investigation or remedial action (ANZECC: 2000).
Table 15: Water quality parameters and guideline values summarised in this report
| Identifier (+unit) | Reference | Guideline value |
| Dissolved Oxygen | RMA 1991 Third Schedule | ≥80 (% saturation) |
| Turbidity | ANZECC (2000) | ≤5.6 (NTU) |
| Ammoniacal Nitrogen | ANZECC (2000) | ≤0.021 (mg/L) |
| Nitrite-Nitrate Nitrogen | ANZECC (2000) | ≤0.444 (mg/L) |
| Dissolved Reactive Phosphorus | ANZECC (2000) | ≤0.010 (mg/L) |
| Escherichia coli | ANZECC (1992) | ≤126 (cfu/100 mL) |
Water Quality Index
A water quality index is used to facilitate inter-site comparisons of the state of water quality in the region's rivers and streams. This approach has been used at both a regional (for example, Piere et al.: 2012; Ozane: 2012) and national level (Larned et al.: 2005). The water quality index is calculated using the median values for the following six variables: dissolved oxygen (% saturation), turbidity, ammoniacal nitrogen, nitrite-nitrate nitrogen, dissolved reactive phosphorus, and Escherichia coli (Table 15).
The application of the water quality index enables water quality at each site to be classified into one of four categories:
• Excellent: median values for all six variables are within guideline values.
• Good: median values for five of the six variables are within guideline values, of which dissolved oxygen is one variable that must be met.
• Fair: median values for three or four of the six variables are within guideline values, of which dissolved oxygen is one variable that must be met.
• Poor: median values for <3 of the six variables comply with guideline values.
Sites with a grade of good, fair or poor represent degraded sites as the median value of at least one of the six key water quality variables is not within the guideline values. The degree of degradation is relative, with good sites having the least degraded water quality and poor sites the most degraded water quality.
Macroinvertebrate Community Index
Macroinvertebrate monitoring is undertaken to detect changes in the aquatic macroinvertebrate communities resulting from human-induced stresses, for example, contaminants entering the waterway. Macroinvertebrates are normally abundant in lotic (running water) ecosystems, and are commonly used in the assessment of water quality as their diverse communities provide varied responses to changing environmental conditions (Boothroyd & Stark: 2000). They are good indicators of local conditions because they tend to be limited in their in-stream movements, thus are affected by the environmental conditions over an extended period of time, unlike water quality measurements, which are snapshots of the waterway at that point, at that moment.
Initial macroinvertebrate monitoring in New Zealand was carried out following the procedures of Stark (1985), and have been revised several times (Stark: 1993; Stark: 1998; and Stark et al.: 2001). More recent publications added revised tolerance scores for taxa collected from soft-bottomed sites (Stark and Maxted: 2004, 2007); the resulting macroinvertebrate community index scores being labelled MCI-sb. The council uses soft-bottomed tolerance scores for naturally occurring soft-bottomed sites. All soft-bottomed sites that are deemed to be ‘human induced' are calculated using the conventional macroinvertebrate community index, that is, derived from hard-bottomed tolerance scores. Table 17 and Table 18 provide the quality class and median scores from each monitoring site over the period 2007-2011.
Table 16: Interpretation of Macroinvertebrate Community Index (MCI) type scores
| Quality class | MCI and MCI-sb |
| Excellent | ≥120 |
| Good | 100-119 |
| Fair | 80-99 |
| Poor | <80 |
For more information on the macroinvertebrate community index scores refer to the full reports on the Regional Council website at www.nrc.govt.nz/riverdata
Habitat assessments
In general, water quality, habitat and biological diversity in rivers are closely linked. To provide a fuller picture of river health the council undertakes habitat assessments at all river water quality monitoring sites. The habitat assessment involves assigning scores to the following stream characteristics: aquatic habitat abundance, aquatic habitat diversity, hydrologic heterogeneity, channel alteration, bank stability, channel shade, and riparian vegetation.
Habitat quality for aquatic biota is broken down into four categories: optimal, sub-optimal, marginal and poor. Results for each site are presented alongside the water quality index and macroinvertebrate community index scores in Table 17.
For more information on the habitat assessments refer to the full report available on the council's website at www.nrc.govt.nz/riverdata
Table 17: Water Quality Index grades (2007-2011) for River Water Quality Monitoring Network sites. Sites are graded by comparing median values with ANZECC guidelines. Main catchment land cover(s) are listed in order of most dominant to least dominant. Harvest is forest that has recently been harvested. The Macroinvertebrate Community Index scores for both hard (MCI) and soft bottomed (MCI-sb) sites are based on the median value over the period 2007-2011. The habitat scores are based on habitat assessments undertaken in 2012.
| Catchment | Geology | Main land cover | Habitat score | MCI and MCI-sb Score | Water quality index |
| Mangakāhia @ Twin Bridges | Volcanic acidic | Agriculture, native forest, forestry | Sub-Optimal | Fair | Excellent |
| Waipapa @ Forest Ranger | Soft sedimentary | Native forest, forestry | Optimal | Good | Excellent |
| Waipoua @ SH12 Rest Area | Volcanic acidic | Native forest, agriculture | Optimal | Excellent | Excellent |
| Hātea u/s Mair Park Bridge | Volcanic acidic | Agriculture, urban, forestry, harvest, native forest | Sub-Optimal | Fair | Good |
| Kaihū @ gorge | Volcanic acidic | Agriculture, native forest, forestry | Sub-Optimal | Fair | Good |
| Kerikeri @ Stone Store bridge | Volcanic acidic | Agriculture, native forest, crops | Sub-Optimal | Poor | Good |
| Ngunguru @ Waipoka Rd | Hard sedimentary | Agriculture, native forest | Marginal | Fair | Good |
| Opouteke @ suspension bridge | Volcanic acidic | Forestry, native forest | Marginal | Fair | Good |
| Waiarohia @ Whau Valley | Hard sedimentary | Native forest, urban | Sub-Optimal | Fair | Good |
| Waiarohia @ Rust Avenue | Hard sedimentary | Native forest, urban, agriculture | Marginal | Good | Good |
| Waimamaku @ SH12 | Volcanic acidic | Native forest, agriculture | Sub-Optimal | Good | Good |
| Waipapa @ Waipapa Landing | Volcanic acidic | Agriculture, crops, native forest | Sub-Optimal | Good | Good |
| Waitangi @ Watea | Hard sedimentary | Agriculture, native forest, forestry | Marginal | Poor* | Good |
| Waitangi @ Waimate Road | Volcanic acidic | Agriculture, native forest, forestry | Marginal | Fair | Good |
* Calculated using Macroinvertebrate Community Index soft bottom (MCI-sb)
Table 17: continued
| Catchment | Geology | Main land cover | Habitat score | MCI and MCI-sb Score | Water quality index |
| Awanui @ FNDC watertake | Soft sedimentary | Agriculture, native forest | Marginal | Fair | Fair |
| Awanui @ Waihue Channel | Soft sedimentary | Agriculture, urban | Marginal | Fair* | Fair |
| Hakaru @ Topuni Creek Farm | Soft sedimentary | Agriculture, native forest | Sub-Optimal | Fair | Fair |
| Kaeo @ Dip Road | Soft sedimentary | Agriculture, native forest, forestry | Poor | Fair | Fair |
| Mangahahuru @ Apotu Road | Hard sedimentary | Agriculture, forestry | Poor | Poor* | Fair |
| Mangahahuru @ Main Road | Hard sedimentary | Forestry, harvest, native forest | Sub-Optimal | Good | Fair |
| Mangakāhia @ Titoki Bridge | Volcanic acidic | Agriculture, native forest, forestry | Marginal | Good* | Fair |
| Mangamuka @ Iwiatua Road | Volcanic acidic | Native forest, agriculture | Marginal | Good | Fair |
| Manganui @ Mitaitai Road | Soft sedimentary | Agriculture, forestry, native forest | Marginal | Poor* | Fair |
| Oruru @ Oruru Road | Volcanic acidic | Agriculture, native forest | Marginal | Poor* | Fair |
| Otaika @ Otaika Valley Road | Soft sedimentary | Agriculture, native forest | No data | No data | Fair |
| Paparoa @ walking bridge | Soft sedimentary | Agriculture, forestry, native forest | Poor | Fair | Fair |
| Punakitere @ Taheke Recorder | Soft sedimentary | Agriculture, native forest, forestry | Sub-Optimal | Fair | Fair |
| Utakura @ Okaka Road Bridge | Hard sedimentary | Agriculture, forestry, native forest | Marginal | Poor* | Fair |
| Victoria @ Thompsons Bridge | Volcanic acidic | Native forest, agriculture | Sub-Optimal | Good | Fair |
| Waiharakeke @ Stringers Road | Soft sedimentary | Agriculture, native forest, forestry | Marginal | Good* | Fair |
| Waiotu @ SH1 | Hard sedimentary | Agriculture, native forest | Marginal | Poor* | Fair |
| Waipao @ Draffin Road | Volcanic acidic | Agriculture | Marginal | Good* | Fair |
| Wairua @ Purua | Hard sedimentary | Agriculture, native forest | Marginal | Poor* | Fair |
| Whakapara @ cableway | Hard sedimentary | Agriculture, native forest, forestry | Marginal | Fair* | Fair |
| Mangere @ Knight Road | Soft sedimentary | Agriculture, native forest | Marginal | Poor* | Poor |
| Ruakaka @ Flyger Road | Soft sedimentary | Agriculture, native forest | Sub-Optimal | Excellent* | Poor |
* Calculated using Macroinvertebrate Community Index soft bottom (MCI-sb).
Table 18: Water Quality Index grades for river water quality monitoring sites sampled at monthly intervals over the period 2007-2011, based on comparisons of median values with guideline values for six key variables (see Table 15). A green tick indicates the median falls within the guideline, while a cross indicates the median is not within the guideline.
|
Site |
DO (% sat) |
DRP (mg/L) |
E.coli (MPN/100ml) |
NH4 (mg/L) |
NNN (mg/L) |
Turbidity (NTU) |
MCI |
Water Quality Index |
||||||
|
Mangakāhia @ Twin Brdgs. |
109 |
ü |
0.003 |
ü |
121 |
ü |
0.005 |
ü |
0.032 |
ü |
2.7 |
ü |
95 |
Excellent |
|
Waipapa Rv @ Forest |
96 |
ü |
0.005 |
ü |
78 |
ü |
0.003 |
ü |
0.013 |
ü |
1.8 |
ü |
118 |
Excellent |
|
Waipoua @ SH12 |
101 |
ü |
0.003 |
ü |
63 |
ü |
0.005 |
ü |
0.022 |
ü |
2.3 |
ü |
129 |
Excellent |
|
Hātea u/s Mair Park |
105 |
ü |
0.008 |
ü |
397 |
û |
0.010 |
ü |
0.385 |
ü |
4.1 |
ü |
95 |
Good |
|
Kaihū @ Gorge |
100 |
ü |
0.005 |
ü |
153 |
û |
0.005 |
ü |
0.226 |
ü |
3.2 |
ü |
87 |
Good |
|
Kerikeri @ Stone Store |
101 |
ü |
0.007 |
ü |
240 |
û |
0.010 |
ü |
0.410 |
ü |
2.1 |
ü |
77 |
Good |
|
Ngunguru @ Waipoka Rd |
97 |
ü |
0.010 |
ü |
305 |
û |
0.010 |
ü |
0.093 |
ü |
5.5 |
ü |
90 |
Good |
|
Opouteke @ Suspension |
107 |
ü |
0.004 |
ü |
174 |
û |
0.005 |
ü |
0.036 |
ü |
2.7 |
ü |
93 |
Good |
|
Waiarohia @ Whau Valley |
96 |
ü |
0.010 |
ü |
504 |
û |
0.010 |
ü |
0.402 |
ü |
5.6 |
ü |
92 |
Good |
|
Waiarohia @ Rust Ave |
107 |
ü |
0.010 |
ü |
414 |
û |
0.010 |
ü |
0.365 |
ü |
2.5 |
ü |
80 |
Good |
|
Waimamaku @ SH12 |
103 |
ü |
0.005 |
ü |
393 |
û |
0.005 |
ü |
0.012 |
ü |
3.3 |
ü |
102 |
Good |
|
Waipapa Stm @ Waipapa Ldg |
96 |
ü |
0.005 |
ü |
173 |
û |
0.010 |
ü |
0.324 |
ü |
2.2 |
ü |
81 |
Good |
|
Waitangi @ Watea |
101 |
ü |
0.005 |
ü |
140 |
û |
0.007 |
ü |
0.248 |
ü |
3.7 |
ü |
61* |
Good |
|
Waitangi @ Waimate Rd |
98 |
ü |
0.006 |
ü |
454 |
û |
0.010 |
ü |
0.407 |
ü |
5.0 |
ü |
99 |
Good |
* Calculated using Macroinvertebrate Community Index soft bottom (MCI-sb).
Table 18. Continued
|
Site |
DO (% sat) |
DRP (mg/L) |
E.coli (MPN/100ml) |
NH4 (mg/L) |
NNN (mg/L) |
Turbidity (NTU) |
MCI |
Water Quality Index |
||||||
|
Awanui @ FNDC watertake |
82 |
ü |
0.017 |
û |
301 |
û |
0.010 |
ü |
0.039 |
ü |
6.0 |
û |
95 |
Fair |
|
Awanui @ Waihue Channel |
87 |
ü |
0.043 |
û |
309 |
û |
0.020 |
ü |
0.053 |
ü |
9.1 |
û |
85* |
Fair |
|
Hakaru @ Topuni Creek |
103 |
ü |
0.047 |
û |
302 |
û |
0.017 |
ü |
0.260 |
ü |
9.5 |
û |
82 |
Fair |
|
Kaeo @ Dip Road |
95 |
ü |
0.005 |
ü |
627 |
û |
0.010 |
ü |
0.045 |
ü |
6.4 |
û |
96 |
Fair |
|
Mangahahuru @ Apotu Rd |
97 |
ü |
0.027 |
û |
572 |
û |
0.020 |
ü |
0.350 |
ü |
6.9 |
û |
77* |
Fair |
|
Mangahahuru @ Main Rd |
96 |
ü |
0.010 |
ü |
227 |
û |
0.010 |
ü |
0.069 |
ü |
6.0 |
û |
102 |
Fair |
|
Mangakāhia @ Titoki Brdg |
95 |
ü |
0.006 |
ü |
237 |
û |
0.011 |
ü |
0.062 |
ü |
5.9 |
û |
100* |
Fair |
|
Mangamuka @ Iwiatua Rd |
94 |
ü |
0.030 |
û |
272 |
û |
0.005 |
ü |
0.007 |
ü |
1.0 |
ü |
107 |
Fair |
|
Manganui @ Mitaitai Rd |
82 |
ü |
0.039 |
û |
135 |
û |
0.012 |
ü |
0.173 |
ü |
9.4 |
û |
69* |
Fair |
|
Oruru @ Oruru Rd |
84 |
ü |
0.021 |
û |
292 |
û |
0.010 |
ü |
0.026 |
ü |
6.7 |
û |
73* |
Fair |
|
Otaika @ Otaika Valley Rd |
84 |
ü |
0.016 |
û |
596 |
û |
0.027 |
ü |
1.268 |
û |
5.1 |
ü |
No data |
Fair |
|
Paparoa @ walking bridge |
89 |
ü |
0.020 |
û |
573 |
û |
0.020 |
ü |
0.094 |
ü |
8.9 |
û |
80 |
Fair |
|
Punakitere @ Taheke |
100 |
ü |
0.017 |
û |
419 |
û |
0.010 |
ü |
0.407 |
ü |
6.2 |
û |
95 |
Fair |
|
Utakura @ Okaka Rd Bridge |
88 |
ü |
0.011 |
û |
327 |
û |
0.014 |
ü |
0.136 |
ü |
18.4 |
û |
71* |
Fair |
|
Victoria @ Thompsons |
94 |
ü |
0.016 |
û |
170 |
û |
0.010 |
ü |
0.008 |
ü |
2.0 |
ü |
111 |
Fair |
|
Waiharakeke @ Stringers |
95 |
ü |
0.016 |
û |
357 |
û |
0.014 |
ü |
0.117 |
ü |
8.6 |
û |
103* |
Fair |
|
Waiotu @ SH1 |
93 |
ü |
0.020 |
û |
377 |
û |
0.020 |
ü |
0.250 |
ü |
8.3 |
û |
75* |
Fair |
|
Waipao @ Draffin Road |
102 |
ü |
0.030 |
û |
620 |
û |
0.010 |
ü |
2.600 |
û |
2.7 |
ü |
101* |
Fair |
|
Wairua @ Purua |
92 |
ü |
0.016 |
û |
84 |
ü |
0.019 |
û |
0.342 |
ü |
8.4 |
û |
76* |
Fair |
|
Whakapara @ cableway |
97 |
ü |
0.020 |
û |
187 |
û |
0.010 |
ü |
0.262 |
ü |
6.2 |
û |
91* |
Fair |
|
Ruakaka @ Flyger Rd |
80 |
û |
0.087 |
û |
542 |
û |
0.038 |
ü |
0.385 |
ü |
18.3 |
û |
120* |
Poor |
|
Mangere @ Knight Rd |
84 |
ü |
0.054 |
û |
691 |
û |
0.040 |
ü |
0.596 |
û |
6.9 |
û |
76* |
Poor |
* Calculated using Macroinvertebrate Community Index soft bottom (MCI-sb)
Based on monthly monitoring over the period January 2007 to December 2011, three (8%) of the 36 sites monitored had a water quality index grade of ‘excellent, (Table 17). Two of the sites that were assigned this grade were located in catchments dominated by native forest. The remaining site, "Mangakāhia River at Twin Bridges" is located in a catchment composed of agriculture, and native and plantation forestry. All three sites are located in the upper reaches of the region's rivers and have a mix of volcanic and soft sediment geology.
Eleven sites (31%), draining a mixture of agriculture, native, and plantation forestry received a water quality grade of ‘good', indicating that median values for five of the six water quality variables in the water quality index were within their respective guideline values. The guideline value that the good sites did not meet was the indicator bacteria E.coli guideline for stock drinking water (≤126/100mL) (Table 18). The guideline value for stock drinking water is considered conservative and the council is unaware of any major issues regarding livestock health and water quality in the region. It should also be noted that while the sites exceeded the stock drinking water guideline, they were still within the higher trigger value for contact recreation (E.coli >550/100mL) indicating they are generally suitable for swimming.
Twenty sites (56%) were assigned a ‘fair' water quality grade. These sites are located in predominately agricultural catchments (Table 18), with one site in plantation forest, and two sites in a mix of native forest and agriculture. The guideline values for dissolved reactive phosphorus, E.coli, and turbidity were the variables ‘fair' sites most commonly exceeded (Table 17).
Two sites received a water quality grade of ‘poor' because median values for less than half of the six water quality variables in the water quality index were within their respective guidelines (Table 17), and in the case of the Ruakaka River, the median DO% value exceeded the guideline. Both poor sites exceeded the dissolved reactive phosphorus, E.coli and turbidity guidelines, and the Mangere River also exceeded the Nitrite-Nitrate Nitrogen guideline.
A summary of chemical water quality data at the 36 river water quality monitoring sites and a comparison with guideline values can be found in Appendix A.
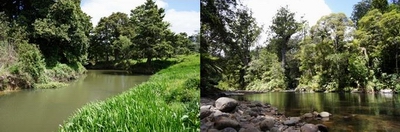 Mangere River (left) – poor water quality Waipoua River (right) – excellent water quality.
Figure 60: Percentage breakdown of overall water quality grade at river water quality monitoring sites
Figure 61: Surface freshwater quality classifications for the Northland region based on the River Water Quality Monitoring Network
Long-term water quality trends
Long-term trend analysis was carried out on River Water Quality Monitoring Network sites with more than five years of water quality data (24 sites). The data period used for the trend analysis was from January 2003 or when sampling began to the end of 2011. A summary of the results can be found in Table 19.
Overall there were several positive changes in water quality between 2003 and 2011. Improvements were seen across all nutrient parameters in particular total phosphorus with 13 out of the 24 sites recording a decreasing trend in concentration. Several sites exhibited decreasing trends across several nutrient parameters including Kaihū River, Mangakāhia River at twin bridges, Mangere River, Opouteke River, Punakitere River, Waipapa River and Waipoua River.
 Fencing to exclude livestock has contributed to a number of improving trends in water quality on the Punakitere River.
Decreasing trends in ammoniacal nitrogen at several sites is a good indication of improvements in point source discharges in the catchments. Many of the sites are situated in agricultural catchments and include the Kaeo, Mangere, Opouteke and Ruakaka rivers.
Positive trends in water clarity have been recorded at six sites with two of those sites having a corresponding positive trend in turbidity.
Degrading trends in turbidity have been observed at four sites; Mangahahuru Stream at Main Road and Apotu Road, Victoria River and Waitangi River at Waimate North.
Table 19: Trends for 24 River Water Quality Monitoring Network sites from 2003 or when records began to 2011. A green "smiley face" indicates an improving trend and a red "unhappy face" a deteriorating trend. An empty cell indicates no significant trend.
What is our lake water quality like?
The overall health of a lake can be determined by measurements of four key parameters (chlorophyll a, water clarity, total nitrogen and total phosphorus) to create a Trophic Level Indicator score. This score is then used to determine the trophic level of a lake, which falls into one of seven categories (Table 20).
Table 20: Values of variables that define the boundaries of different trophic levels (Burns et al.: 2000)
| Lake type | Trophic level | Chlα (mg/m3) | Clarity (m) | TP (mg/m3) | TN (mg/m3) |
| Ultra-microtrophic | 0.0 - 1.0 | 0.13 - 0.33 | 33 - 25 | 0.84 - 1.8 | 16 - 34 |
| Microtrophic | 1.0 - 2.0 | 0.33 - 0.82 | 25 - 15 | 1.8 – 4.1 | 34 - 73 |
| Oligotrophic | 2.0 - 3.0 | 0.82 - 2.0 | 15 - 7.0 | 4.1 – 9.0 | 73 - 157 |
| Mesotrophic | 3.0 - 4.0 | 2.0 - 5.0 | 7.0 - 2.8 | 9.0 - 20 | 157 - 337 |
| Eutrophic | 4.0 - 5.0 | 5.0 - 12 | 2.8 - 1.1 | 20 - 43 | 337 - 725 |
| Supertrophic | 5.0 - 6.0 | 12 - 31 | 1.1 - 0.4 | 43 - 96 | 725 - 1558 |
| Hypertrophic | 6.0 - 7.0 | > 31 | < 0.4 | > 96 | > 1558 |
 Lake Te Kahika on the Aupōuri Peninsula.
The five-year median Trophic Level Indicator scores for the 28 monitored lakes show that 64% of the lakes are eutrophic or worse, meaning that they have poor water clarity and high nutrient levels. Of these lakes, the majority are located in agricultural catchments. The lake that has the highest Trophic Level Indicator score (poorest water quality) was Lake Kapoai which is located just south of Dargaville. Four of the lakes are classed as oligotrophic (excellent water quality), including the three Kai Iwi lakes and Lake Te Kahika (Figure 62)
Figure 62: Five-year median trophic status for the 28 monitored lakes
Long-term lake water quality trends
Long-term trend analysis was carried out on the 28 lakes and showed that four of the lakes had significant improvements in trophic level indicator scores: these include Lakes Kahuparere, Ōmāpere, Waiporohita and Wainui. Five lakes had significant degrading trends in trophic level indicator scores, which includes Lake Kai Iwi (Table 21).
Table 21: Trends for the 28 monitored lakes from December 2005 to June 2011. Note: lakes with trends calculated over a ten year period. A green "smiley face" indicates an improving trend and a red "unhappy face" indicates a deteriorating trend. An empty cell indicates no significant trend, ND = no data, BD= below detection, ID= insufficient data.
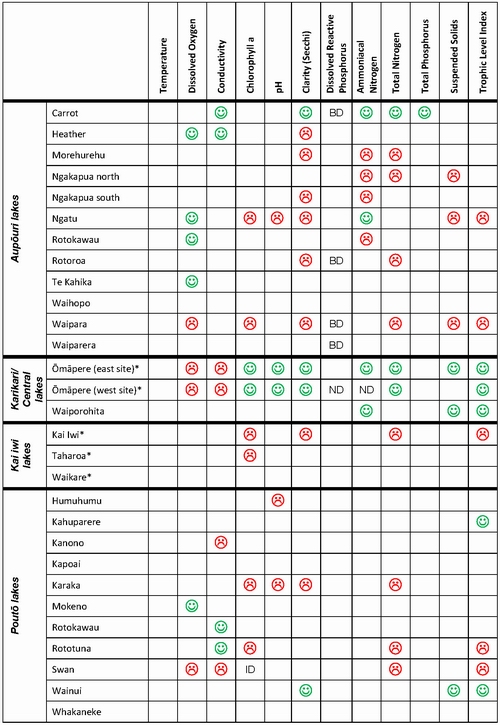
Twelve lakes (43%) recorded a significant trend in water clarity; four of which were improving trends and eight were deteriorating trends. Six of the lakes which had deteriorating water clarity also had corresponding trends in increasing algae concentrations.
What is our recreational freshwater quality like?
The Northland Regional Council, in conjunction with the district councils and Northland Health, survey the water quality at a number of the region's most popular freshwater swimming spots every summer. Up to 30 sites in lakes and rivers throughout Northland have been sampled weekly over the five summers in the 2007-2011 period to check whether the microbiological water quality meets guidelines for suitability for swimming (Table 22).
The bathing water quality is assessed according to concentrations of indicator bacteria: these do not cause disease themselves, but signal the potential presence of disease-causing pathogens. A high concentration of the indicator bacteria means that it is more likely that disease-causing organisms are present, therefore a potentially higher health risk. However, it does not mean that anyone swimming in the water at that time will actually be affected. Councils do not measure the pathogens directly because the technology to do this is not cost-effective or is unreliable.
Escherichia coli (E.coli) is used as an indicator for assessing health risk in freshwater for humans and livestock. The levels of E. coli are compared to the microbiological water quality guidelines for recreational users (less than 550 E. coli/100mL (Ministry for the Environment: 2003)), to determine whether the water is suitable for recreational use.
Table 22: Single sample guidelines for fresh water sites (Ministry for the Environment: 2003)
|
Enterococci count |
Category |
Response |
|
Sample < 260 per 100 ml |
Surveillance (considered suitable for swimming) |
|
|
260 < Sample < 550 per 100 ml |
Alert (considered potentially unsuitable for swimming) |
|
|
Sample > 550 per 100 ml |
Action (considered unsuitable for swimming) |
|
For more information visit the council website: www.nrc.govt.nz/swimmingWQreports
 Otamure Bay Stream.
Table 23: Freshwater grading system broken down into four categories
|
Category |
|
95-100% samples <550/100 ml E.coli |
|
90-95% samples <550/100 ml E.coli |
|
75-90% samples <550/100 ml E.coli |
|
<75% samples <550/100 ml E.coli |
Table 24: Statistics for the freshwater recreational bathing programme sites from 2007/08 to 2011/12
|
Site name |
Total No. of samples |
Median Value (E.coli/100mL) Compared to guidelines listed in |
Percentage of samples within guidelines listed in |
|
|
Aurere River at SH10 bridge |
12 |
194 |
75.0 |
|
|
Coopers Beach Stream at Below SH10 bridge |
21 |
2481 |
14.3 |
|
|
Hikurangi Lake |
25 |
20 |
100.0 |
|
|
Kaihū River at swimming hole |
37 |
98 |
81.1 |
|
|
Kaikou River |
25 |
309 |
72.0 |
|
|
Kapiro Stream at Purerua Road bridge |
39 |
341 |
71.8 |
|
|
Kerikeri Stone Store |
44 |
264 |
68.2 |
|
|
Lake Ngatu at south end |
17 |
10 |
100.0 |
|
|
Lake Rotopokaka (CocaCola) |
12 |
20 |
100.0 |
|
|
Lake Taharoa at Pump house |
30 |
10 |
100.0 |
|
|
Lake Waro at Launching Area, Hikurangi |
29 |
52 |
86.2 |
|
|
Langs Beach Stream at mid-beach ponding area |
26 |
948.5 |
30.8 |
|
|
Langs Stream below toilets |
28 |
314 |
64.3 |
|
|
Mangakāhia River above Twin Bridges |
38 |
217 |
73.7 |
|
|
Ocean Beach Stream |
22 |
1081 |
31.8 |
|
|
Omamari Beach Stream |
35 |
145 |
85.7 |
|
|
Otamure Stream |
44 |
1182.5 |
27.3 |
|
|
Otaua Stream |
36 |
386 |
66.7 |
|
|
Pacific Bay Stream at footbridge |
2 |
10086 |
50.0 |
|
|
Raumanga Stream |
48 |
284.5 |
77.1 |
|
|
Tirohanga Stream |
40 |
263.5 |
85.0 |
|
|
Victoria River |
38 |
249.5 |
78.9 |
|
|
Waiharakeke |
12 |
568.5 |
41.7 |
|
|
Waipapa River (Puketi) |
35 |
63 |
94.3 |
|
|
Waipapa Stream at swimming hole |
12 |
204 |
75.0 |
|
|
Waipapa Basin |
27 |
110 |
85.2 |
|
|
Waipoua River at Swimming hole at DOC HQ |
40 |
85.5 |
90.0 |
|
|
Waipū Beach at Stream at beach |
20 |
220.5 |
80.0 |
|
|
Waitangi at Lily Pond |
39 |
262 |
82.1 |
|
|
Whāngārei Falls |
51 |
512 |
52.9 |
Out of the 30 freshwater sites that have been sampled in 2007-2011, four sites (all lakes) were within guidelines on all sampling occasions. Two sites were within guidelines 90-95% of the time, 11 sites 75-90% of the time, and 13 sites were within the guidelines less than 75% of the time.
The council investigates poor water quality at problem sites within the region. This includes identifying the source(s) of contamination, sanitary surveys at sites where there is human contamination, and additional monitoring after rainfall to determine when sites are suitable for swimming again.
A total of 17 sites have now been investigated. Source tracking to isolate the sources of contamination at these sites has shown that 14 are intermittently contaminated by wildfowl, for example, ducks and/or gulls. Ten sites are contaminated by ruminant (herbivore) faecal material; five sites with dog faecal material and two sites by a human source of contamination. Follow-up sampling and sanitary surveys at the two sites with human contamination found no evidence of human faecal contamination.
Where the source of faecal contamination is natural (that is, from birds), little can be done to reduce the problem and permanent signage warning people of the potential health risk is used in some situations. In areas where the source of contamination is livestock, council staff work with landowners to implement land management options to ultimately reduce contamination.
It should be noted that even in rivers which originate in pristine forested catchments (for example, Waipapa and Waipoua rivers), high counts of the indicator bacteria E.coli have been observed after rainfall. The likely source of contamination is plant decay, or possibly wild animals like possums, pigs or goats. As a general rule, the council recommends that swimming should be avoided for two to three days after heavy rainfall.
How are we measuring up against our objectives?
The following are environmental results anticipated listed in the operational Regional Policy Statement.
Water quality suitable for desired purposes
• The majority of recreational bathing sites are generally acceptable for swimming and other freshwater recreational activities during dry weather. However, after heavy or prolonged rain, the waterways become unsuitable for several days.
• Water quality for aquatic ecosystems is highly variable. Guidelines are regularly exceeded in catchments with high intensity land use, whereas ecosystem health in native forested catchments is excellent. Lowland streams, especially in agricultural and urban areas, have poor ecosystem health.
• No freshwater body in Northland or New Zealand is likely to meet the NZ drinking water standard of less than 1 E. coli/100ml (Ministry of Health: 2005) without treatment.
• Water taken from most Northland freshwater bodies for stock drinking water is likely to exceed the stock water guidelines. However, the stock water guideline is considered overly stringent and to the council's knowledge the quality of stock drinking water in Northland is not a major problem.
Contaminants in water bodies reduced
• Overall there has been a reduction in contaminants at river water quality monitoring network sites. Reporting shows that the 2010/11 annual compliance with water quality guidelines of the sites was greater than the 2006/07 baseline for the five key parameters. This is supported by the results of trend analysis calculated for the sites with more than five years' worth of data (Table 17) here are improving trends for: total phosphorus at 54% of sites; dissolved reactive phosphorus at 46% of sites; total nitrogen at 25% of sites; and ammoniacal nitrogen at 33% of sites. However, there are a few declining trends; bacterial contamination is increasing at two sites and turbidity increasing at four sites.
• Poor water quality in Northland lakes is still being recorded with state and trend analysis indicating an increase in eutrophication. In 2010/11, 64% of lakes monitored were found to be eutrophic or worse (high nutrient and algal biomass with low water clarity). Trend analysis indicates that overall water quality is declining in lakes as there are more declining trends than improving trends. There are declining trends for: total nitrogen at 29% of sites; water clarity at 29% of sites; algal biomass at 21% of sites; and trophic level index scores at 18% of sites. However, improving trends in ammoniacal nitrogen, total nitrogen and trophic level index have been observed at 14% of sites.
• Farm dairy effluent treatment systems are by far the most numerous point source discharges to surface waters and land in Northland. There remains a significant level of non-compliance particularly by unconsented farms (Figure 57). Presently, 51% of systems discharge to land and 49% to surface water. Agricultural land use is the most significant source of non-point source pollution in Northland. However, the full extent that agricultural runoff contributes to the total pollution loading of the region's rivers and streams is not known.
• Over the last few decades, through industry amalgamations and improvements in wastewater treatment, pressures on Northland's waterways from industrial discharges have decreased significantly.
The adverse effects of contaminants in water bodies and coastal waters are avoided, remedied or mitigated
• As outlined above, although there are signs of improvement, the adverse effect of contaminants in water bodies and coastal waters remains a problem.
That all existing discharges of organic contaminants be via the best practicable option for treatment and disposal by the year 2004
• Some 740 farm dairy effluent resource consents were issued in the 2007-2011 period. All of the associated effluent systems have been rigorously assessed using a suite of criteria for "best practicable option". The criteria included industry guidelines, cow numbers, milking regime, local rainfall, soil types, land contour and financial considerations. Where systems were identified as needing upgrade, the upgrade and timeframes were included as conditions of consent.
That all new discharges of organic contaminants be via the best practicable option for treatment and disposal
• The same process as above has been followed with all new discharges.
Improved aquatic habitat
• Habitat quality at the majority of sites is marginal with 51% of river water quality monitoring network sites falling into this category, although more positive trends in habitat quality are apparent from the data than negative. Nine percent of sites fall into the poor category and two sites classed as optimal in 2012. Trends in habitat quality observed over five samples (taken in 2005, 2007, 2008, 2010 and 2012) indicate that habitat quality has improved at 10 sites, declined at two sites and remained stable at 15 sites. Sites with declining trends are lowland pastoral and urban sites and include the Ruakaka and Awanui rivers. Some of the changes since 2005 were inconclusive due to insufficient data and/or the subjectivity of the assessor.
What is being done?
Access to freshwater is essential for the well-being of people, the environment, and our economy. Effective management of freshwater means having the right qualities and quantities of water available, to support each of these wellbeings.
The Northland Regional Council has a broad programme for improving water quality, quantity and management in the region - Waiora Northland Water. Through Waiora Northland Water, we will protect and maintain freshwater quality in Northland to suit a range of needs and values.
In particular, Waiora Northland Water will implement the National Policy Statement for Freshwater Management in Northland. The national policy statement is about facilitating the setting of community objectives for freshwater management that will help us tailor our efforts, identify appropriate water standards, and monitor our progress towards completing our goals.
We know freshwater quality has a major influence on our coastal environment, so we are also taking an integrated approach. Our work on implementing the national policy statement will link to our work in the region's harbours, estuaries and coast. As part of the Northland Regional Council's development of its Long Term Plan 2012-2022, it adopted a staged programme to implement the national policy statement in the region. Water improvements will take time, will involve new approaches, and will not necessarily be achieved in one step. We will focus first on:
• Our outstanding water bodies (the Waipoua catchment and Kai Iwi Lakes);
• High priority water bodies (Waitangi, Mangere, and upper Whangārei Harbour catchments);
• All the other water bodies will also have interim or default limits, but these will be progressively reviewed and made more specific on a priority basis.
The range of freshwater management tools we'll use is likely to be as diverse as Northland's water bodies. For example, we'll continue to encourage good practice and promote it through our Environment Fund. In terms of policy, we've already set an overarching framework for implementing the national policy statement through our Proposed Regional Policy Statement for Northland. We have existing rules set out in our Regional Water and Soil Plan. Where necessary, we will introduce plan changes to update regulations and enforce rules to achieve the agreed objectives.
The council's Environmental Management Committee will maintain an overview of the coordinated efforts of many who will be involved in Waiora Northland Water. We will work with key stakeholders, including iwi, hapū and communities to identify values and interests in freshwater and management options. Where possible we will use existing groups and information.
You can access the National Policy Statement for Freshwater Management at the Ministry for the Environment's website: www.mfe.govt.nz
 Council staff measuring water quality.
State of the Environment Monitoring
Regional Water Quality Monitoring Network
Thirty-six sites are sampled on a monthly basis for physico-chemical parameters (four of these are part of the National River Water Quality Network and are sampled by NIWA) so that baseline levels and water quality trends can be assessed.
In addition, all sites are monitored annually for macroinvertebrates and assessed for habitat quality and quantity (ecosystem health) every second year.
Investigations are carried out at sites which show a decreasing water quality trend in order to identify the cause of the deteriorating water quality and resolve the problem.
Freshwater Recreational Bathing Programme
Since 1999/2000 the council has assessed water quality at several of Northland's popular freshwater swimming sites every summer between November and March. The sites are reviewed every year and changed as required. Sites are sampled weekly for E. coli to check whether the microbiological water quality is suitable for recreational use. Elevated results are passed on to the district councils and Northland Health to be followed up. Sites which have consistently poor water quality are investigated further using faecal source tracking, catchment mapping, and sanitary surveys where appropriate.
For more information go to www.nrc.govt.nz/swimmingWQreports
Lake Water Quality Monitoring Network
Thirty-one lakes are monitored four times a year for a range of parameters including total and dissolved nutrients, chlorophyll α, suspended solids, water clarity, pH, temperature and dissolved oxygen. Lake Ōmāpere is also sampled at least every two months. Lake condition monitoring and weed surveillance is also carried out, the majority surveyed on an annual basis.
Reconnaissance surveys and occasionally water quality sampling is carried out on lakes not currently in the network to establish their ranking based on the presence of indigenous and exotic flora and fauna and water quality status. If a high ecological ranking is given to a lake and/or issues concerning the lake have been raised then the lake may be added to the lake water quality monitoring network or a separate monitoring programme set up for the lake.
Farm Dairy Effluent Monitoring Programme
All dairy farms are monitored annually. Where a discharge to water is identified, water quality field tests are done and samples taken for laboratory analyses. Monitoring is timed to coincide with seasonal peak effluent loadings. All systems are assessed and assigned a compliance grade of full compliance, non-compliant or significant non-compliant. Where significant non-compliance is identified, council officers arrange on-farm meetings to discuss the non-compliance and to reach agreements on options for improvement/upgrade.
Forestry Earthworks and Harvesting Guidelines for Northland
Plantation forestry earthworks and harvesting are permitted under the council's Regional Water and Soil Plan for Northland, subject to conditions. New guidelines have been developed by the council and the RMA Forestry Development Group to help foresters meet those conditions. Free workshops have been held to help landowners better manage plantation forest.
For more information go to www.nrc.govt.nz/forestry
 Plantation forest harvesting on the Brynderwyn Range.
Environmental care groups
There are many environmental care groups throughout Northland that are taking action to enhance the environment. The overall aim of most of these groups is to enhance environmental quality, whether this is biodiversity or water quality, through a range of work such as pest and weed control, riparian planting and fencing off waterways and coastal areas, and raising public awareness about the environment.
Environment Fund
The Northland Regional Council Environment Fund has provided more than $4.2 million to help people improve and protect Northland's natural environment since 1996. The Environment Fund is used to assist with funding projects to restore and enhance the natural environment, including the fencing of native bush and waterways, including rivers, lakes and wetlands, and coastal dune management and restoration work, including planting of riparian vegetation and pest control.
For more information refer to the indigenous biodiversity chapter of this report or go to www.nrc.govt.nz/environmentfund
Earthworks workshops
The council offers a series of day-long sediment control workshops for developers, earthwork contractors and planners, during winter months. The aim of the workshops is to increase understanding on best management practices to reduce adverse effects on the environment from earthworks and introduce the latest sediment control methods. Sediment is one of the most serious and common contaminants of Northland's waterways because of the region's high rainfall, soil types and topography.
Education and public awareness
The council provides information to the general public and schools on environmental issues, environmental management and the role of the council, including surface water quality. This is carried out through exhibits at field days and shows, media releases, newsletters, council publications and workshops on regional environmental matters for the general public. At least 40 school visits by regional council environmental educators, teacher workshops and a youth summit are also carried out every year for teachers and school students.
Many schools, stream care groups and landowners have learnt how to check the quality of streams using the Stream Health and Monitoring Assessment Kit, which can be purchased from NIWA.
 Students monitoring stream health.
Site investigations
Lake Ōmāpere
Lake Ōmāpere is Northland's largest lake at 1160ha however it only has an average depth of 2m. The lake is situated in a relatively small catchment (2110ha), which is a mix of dairying, drystock farming and lifestyle properties.
The lake became highly enriched with nutrients as a result of runoff from surrounding land use over the last century. In the 1970s, oxygen weed (Egeria densa) was accidentally introduced and thrived in the nutrient rich waters. The weed quickly spread throughout the lake forming dense surface-reaching beds. The weed collapsed in 1985 causing severe blue-green algae blooms which reduced water clarity, formed surface scums, reduced oxygen levels and created unpleasant odours.
 Historical blue-green algal scums around the eastern edge of Lake Ōmāpere.
Silver carp were introduced into the lake in 1986 to control algal blooms and oxygen weed, however these were unsuccessful. By 1999, oxygen weed had increased again and covered the entire lake. The weed collapsed again in 2001/2002 and the algal blooms returned. Grass carp were released into the lake to control oxygen weed in 2000 and 2002 and had completely eradicated the weed from the lake by 2003. However, the lake was still highly enriched and suffered from severe algal blooms, particularly over summer.
The poor water quality in Lake Ōmāpere has affected the Utakura River and upper Hokianga Harbour since the weed collapsed in 1985. The poor water quality has made:
• The lake and river unsuitable as a water supply;
• Affected food resources, such as tuna from the lake and fish and shellfish, from the river and upper harbour; and
• Restricted recreational uses such as swimming and waka ama.
The Lake Ōmāpere Restoration and Management Project
The Lake Ōmāpere Restoration and Management Project was a joint initiative between the council and the Lake Ōmāpere Trust. The overall aims of the project were to develop and implement a voluntary Lake Management Strategy that would work towards improving the health of the lake and establish the Lake Ōmāpere Trustees in their role as kaitiakitanga. A number of management initiatives have been undertaken around the lake and include riparian planting and fencing, farm planning, and weed and pest control.
It is estimated that over 54 kilometres of streams, drains, wetlands and lake edge has been fenced to exclude stock over the duration of the project. Approximately 84% of the lake edge is now fenced with only two landowners that have not fenced their lake margin.
From 2005 to 2008, there were at least 11 planting days held with over 10,000 plants being put in the ground around the lake's margin, with many more planted outside of planting days. Planting days were carried out by volunteers, school groups, landowners, Conservation Corps, Corrections Department Community Service Workers and Lake Ōmāpere Trustees.
Lake water quality
Water quality monitoring has been undertaken by the council in the lake since 2001 and prior to this, it had been sampled by NIWA since 1992. Monitoring was usually carried out on a bimonthly basis however during summers when algal blooms were severe monitoring was carried out every month.
Trend analysis on the past 10 years of data (2001 to 2011) indicates that water quality is improving in Lake Ōmāpere. Significant improving trends have been recorded in chlorophyll a, clarity, total nitrogen, trophic level index and suspended solids (Figure 64).
Figure 63: Trophic level indicators for both Lake Ōmāpere sites from 2001 to 2011
It is difficult to determine the extent to which restoration efforts around the lake have contributed to the improvements in lake quality and whether these improvements will be long lasting as similar improvements have been seen in the past and the internal nutrient load is still significant. However, a significant decline in nutrients has occurred in the lake and it is likely that a proportion of these nutrients have been flushed out via the outlet. It has also been suggested that a proportion of the nutrients have been retained by the freshwater mussel population in the lake. Planktonic algae use the nutrients and the mussels filter algae from the water.
Continuing work preventing aquatic weed incursions will further improve water quality and prevent the lake from transitioning between macrophyte dominated and algae dominated phases.
Other research projects
Investigative sampling has been undertaken at three Northland rivers that have on-going water quality problems; Mangere, Otiria and Waipū rivers. Monitoring programmes were set up in these catchments to try to identify the potential sources of contamination. Monitoring was carried out on a fortnightly or monthly basis and involved sampling at a number of sites in the catchment to help identify problem areas. Findings from these programmes will be used by the council to promote improvements in the problem areas of these catchments to improve water quality.
For more information go to www.nrc.govt.nz/riverdata
References
Australian and New Zealand Environment and Conservation Council (1992). Australian water quality guidelines for fresh and marine waters. National Water Quality Management Strategy Paper No. 4, Australian and New Zealand Environment and Conservation Council, Canberra.
Australian and New Zealand Environment and Conservation Council (2000). Australian and New Zealand guidelines for fresh and marine water quality, volume 1, the guidelines. Agriculture and Resource Management Councils of Australia and New Zealand, Canberrra.
Ballantine D., Booker D., Unwin M. and Snelder T. (2010). Analysis of national river water quality data for the period 1998–2007. Report No. CHC2010-038 prepared for the Ministry for the Environment by NIWA, Christchurch.
Blaschke, P. et al. (2008). Quantification of the flood and erosion reduction benefits, and costs of climate change mitigation measures in New Zealand. Blaschke and Rutherford Environmental Consultants. Ministry for the Environment.
Boothroyd, I.K. and Stark, J.D. (2000). Use of invertebrates in monitoring. In: Collier, K.J. and Winterbourn, M.J. editors. New Zealand stream invertebrates: ecology and implications for management. New Zealand Limnological Society, Christchurch. Pp 344–373.
Larned, S.T.; Scarsbrook, M.R.; Snelder, T.H., Norton N.J. (2005). Nationwide and regional state and trends in river water quality 1996-2002. National Institute of Water and Atmospheric Research, Christchurch.
Ozane, R. (2012). State of the Environment – surface water quality in Otago 2006-2011. Otago Regional Council.
Ministry for the Environment (2003). Microbiological Water Quality Guidelines for Marine and Freshwater Recreational Areas. Ministry for the Environment, Wellington.
Ministry of Health (2005). Drinking water standards for New Zealand 2005. Published by the Ministry of Health. Wellington: New Zealand.
Northland Regional Council (2002). Regional Policy Statement for Northland. Produced by the Northland Regional Council. Whāngārei: New Zealand.
Northland Regional Council (2011). Recreational swimming water quality in Northland – Summer 2010-2011.
Pierre, A.; Morar, S.; Milne, J.R., Greenfield, S. (2012). River and stream water quality and ecology in the Wellington Region – State and trends. Greater Wellington Regional Council.
Parliamentary commissioner for the Environment (March 2012). Water Quality in New Zealand: Understanding the Science.
Stark, J.D. (1985). A Macroinvertebrate Community Index of water quality for stony streams. Water and Soil Miscellaneous Publication No 87. National Water and Soil Conservation Authority, Wellington. P.53.
Stark, J.D. (1993). Performance of the Macroinvertebrate Community Index: effects of sampling method, sample replication, water depth, current velocity, and substratum on index values. New Zealand Journal of Marine and Freshwater Research 27: 463–478.
Stark, J.D. (1998). SQMCI: a biotic index for freshwater macroinvertebrate coded-abundance data. New Zealand Journal of Marine and Freshwater Research 32: 55–66.
Stark, J.D., Boothroyd, I. K. G., Harding, J. S., Maxted, J. R. and Scarsbrook, M. R. (2001). Protocols for sampling macroinvertebrates in wadeable streams. New Zealand Macroinvertebrate Working Group Report No. 1. Prepared for The New Zealand Ministry for the Environment. Sustainable Management Fund Project No. 5103. P.57.
Stark, J.D. and Maxted, J.R. (2004). Macroinvertebrate Community Indices for Auckland's softbottomed streams and applications to SOE reporting. Report prepared for Auckland Regional Council. P.59.
Stark, J.D. and Maxted, J.R. (2007). A biotic index for New Zealand's soft-bottomed streams. New Zealand Journal of Marine and Freshwater Research 41: 43–61.
Teague, B. (2011). Salmonella typhimurium outbreaks in dairy herds. Proceedings of the Society of Dairy Cattle Veterinarians of the New Zealand Veterinary Association Annual Conference: 7.19.1–7.19.6.
Appendix A
Table 25: Summary of chemical water quality data and comparison with guideline/trigger values at 36 River Water Quality Monitoring Network sites between January 2007 and December 2011. Median values that do not comply with a guideline value are shown in bold font.
Due to the size of Table 25 it has been converted to pdf format
 Download Table 25: Summary of chemical water quality data and comparison (PDF 151 KB) (151KB)
Table 26: Summary of physical and microbiological water quality data and compliance with guideline/trigger values at 36 River Water Quality Monitoring Network sites between January 2007 and December 2011. Median values that do not comply with a guideline value are shown in bold font.
Due to the size of Table 26 it has been converted to pdf format