Groundwater
What do we want for our groundwater?
The operative Regional Policy Statement for Northland details existing council and community objectives for each natural and physical resource in our region. The objectives relating to groundwater management are:
• The maintenance or enhancement of the water quality of natural water bodies and coastal waters to be suitable, in the long-term, for specified purposes;
• The reduction and minimisation of the quantities of contaminants entering water bodies and coastal waters;
• Avoid, remedy or mitigate the adverse effects of discharges of contaminants on the traditional, cultural and spiritual values of water held by tangata whenua;
• The maintenance of water flows and levels in natural water bodies;
• The sustainable use of groundwater resources; and
• The efficient use and conservation of water resources.
The operative Regional Policy Statement also states the anticipated environmental results, as a consequence of implementing the policies and methods to achieve the groundwater management objectives:
• Water quality suitable for desired purposes;
• Contaminants in water bodies reduced;
• Adverse effects of contaminants in water bodies and coastal waters are avoided, remedied or mitigated;
• Protection of important freshwater habitats, particularly wetlands from reductions in surface water and groundwater levels;
• Sustainable and efficient use of water resources of Northland;
• Preservation of the natural character, intrinsic, ecosystem and amenity values of natural water bodies to the extent that these depend on water levels and flows; and
• Increased awareness of water conservation and greater implementation of water conservation practices.
Note: the operative Regional Policy Statement is currently being reviewed. The proposed Regional Policy Statement (2013) is available at www.nrc.govt.nz/newRPS
What are the issues affecting groundwater?
Reduction in quantity and quality of groundwater by pumping, land use and climatic changes, and inappropriate bore construction are the major pressures on groundwater resources in Northland.
Groundwater use
The use and pressures on groundwater are continually changing in line with land use changes from traditional farming to horticulture and subdivision for lifestyle blocks, along with increased demand on public water supply due to population growth and increasing tourism. Groundwater takes that meet the permitted activity rules set out in the Regional Water and Soil Plan do not require resource consent. The majority of these water takes are for domestic and stock drinking requirements.
Resource consents to take groundwater and to install bores are monitored to provide information on the cumulative allocation in aquifers. A summary of resource consents to take water; bores registered with the council; and volumes allocated per aquifer are provided in Table 29. There are currently no allocation limits set for groundwater resources (aquifers) within the Regional Water and Soil Plan.
Table 29: Groundwater take consents, registered bores and water allocated by consent (cubic metres per day) for Northland aquifers
| Aquifers | Number of consents | Number of bores | Allocation (m3/day) |
| Aupōuri | 60 | 583 | 19,762 |
| Coopers/Cable | 5 | 89 | 815 |
| Taipā | 2 | 59 | 80 |
| Russell | 7 | 176 | 186 |
| Kaikohe | 8 | 48 | 1519 |
| Matarau | 4 | 38 | 153 |
| Other small coastal aquifers | 20 | 444 | 708 |
| Glenbervie | 17 | 72 | 743 |
| Three Mile Bush | 8 | 99 | 750 |
| Maunu | 33 | 198 | 3204 |
| Maungakaramea | 8 | 35 | 737 |
| Ruāwai | 3 | 178 | 710 |
| Mangawhai | 12 | 103 | 658 |
| Tara | 5 | 13 | 612 |
| Outside "at risk" aquifers | 60 | 2338 | 17,920 |
| Total | 252 | 4473 | 48556 |
| Change since 2007 SOE report | -27 | +726 | -1046 |
Figure 71 shows registered bores and the volume allocated (m3/day) by groundwater take consents, however prior to 1999, bore logs were submitted to the council on an informal basis. Accordingly, not all existing bores are registered with the council.
Figure 71: Registered bores and the volume allocated (m3/day) by groundwater take consents
Groundwater in Northland is taken for a variety of uses, with the two major uses being horticultural irrigation and industry.
Fifty-three percent of consents are for horticultural irrigation and 8% of consents are for industrial purposes. By volume, horticultural irrigation accounts for 50% whereas industrial purposes account for 26%.
Climate and land use changes
The National Institute of Water and Atmospheric Research Ltd (NIWA) predicts likely increases in temperature and changes in rainfall trends as a result of climate change. This is likely to lead to a reduction in aquifer recharge rates and increased potential for saltwater intrusion in coastal aquifers.
Changes in land use can affect the recharge, abstraction and quality of the groundwater. This effect may also vary over time. For example, the development of forestry over an aquifer recharge area may not result in any changes to the recharge in the initial few years but when the canopy is closed, a significant amount of precipitation is intercepted by the trees and this reduces the recharge to the underlying aquifer. This can lead to a decline in the groundwater level and the amount of water flowing through the aquifer.
Northland's east coast has a large number of small coastal aquifers. Housing development in these areas can result in saltwater intrusion into the aquifer, due to reduced recharge and increased use. Unreticulated housing development above aquifers can also increase the risk of groundwater contamination due to inappropriate or poorly maintained onsite effluent disposal systems.
Inappropriate bore construction and maintenance of bores can result in deterioration of groundwater quality and quantity by:
• Aquifer cross contamination , that is, mixing of aquifers of different water quality; and
• Contamination from the surface due to open, unsealed or poorly sealed bores.
What is our groundwater resource?
Groundwater quantity
Groundwater is a valuable resource to Northland being used mainly for irrigation, industrial and drinking water supplies. Groundwater also contributes to the recharge and base flow of rivers and lakes through seeps, springs and wetlands.
In Northland, groundwater resources vary in both quantity and quality, depending on the geology, soils, land use and rainfall. Geologically, the aquifer systems of Northland can be grouped into four main types:
• Jurassic greywacke;
• Cretaceous sandstone;
• Cainozoic basalt; and
• Quaternary sand, shell and/or gravel.
The majority of groundwater in the region is abstracted from basalt aquifers around Whāngārei and Kaikohe and from a sand/shell aquifer in the Far North. Small shallow sand/gravel aquifers and less productive greywacke aquifers are also contributing to the total groundwater abstraction in the region.
In general, the basalt aquifers are semi-confined and the shallow sand aquifers are unconfined. Information on the basic characteristics of groundwater resources has been gathered from drilling and pumping test programmes carried out throughout Northland. A summary of aquifer characteristics for the principal groundwater resources is shown in Appendix C.
Rainfall is considered to be the main source for groundwater recharge to the aquifers in the region. Lake water loss is considered to be a minor source of recharge in some areas of Northland (for example, Pakaraka and Aupōuri).
Basalt aquifers
The basalt aquifers in Northland generally have relatively rapid infiltration due to the fractured nature of the geology and the existence of scoria cones. The majority of the recharge occurs at the scoria cones due to the presence of clay/ash or weathered layers above the basalt. Groundwater discharge from the basalt aquifers is largely by spring flow originating on the edge of the basalt fields. These aquifers have considerable storage and the spring flow generally remains during dry periods. Spring flow is a major contribution to stream base flow in the basalt areas.
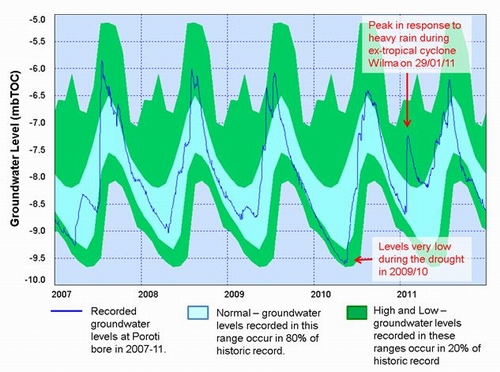
The groundwater levels in the basalt aquifers generally show seasonal variation with higher levels recorded in late winter to early summer and lower levels in late summer to early autumn. Groundwater levels for the monitoring bores located in basalt areas range between 0.5 to 23 metres below ground level. Seasonal variations in the range of 2-14m have been recorded. The seasonal variations in groundwater levels in the basalt aquifers are a direct result of the rainfall variation. During 2007-2011, groundwater levels were at their lowest in May 2010 due to summer drought conditions together with high water demand.
Figure 72: Typical groundwater levels and envelope plots (metres below top of casing) recorded at Poroti west recorder site (Basalt aquifer) from 2007-2011
Sand/shell or gravel and alluvial aquifers
In unconfined sand aquifers recharge from rainfall is generally rapid and intense. There is a minimal rainfall runoff contributing to stream flows in the areas where these aquifers occur. In the Aupōuri Peninsula, the sand aquifer contributes little to the stream base flow as the groundwater level is typically below the stream bed level. The sand aquifers predominantly discharge at or near the coast.
Monitoring bores located in the Mangawhai sand aquifer and Ruāwai alluvial aquifer indicate that the groundwater levels oscillate seasonally with highest levels in the spring and lowest levels toward the end of autumn. The groundwater level response to the rainfall events is relatively fast while groundwater level recession is quite slow, lasting for a few months, similar to the basalt aquifer response.
In general, most of the monitoring bores in the Aupōuri aquifer show a delayed response to rainfall ranging from a few months to more than six months depending on the aquifer hydraulic properties at the site and depth to water table.
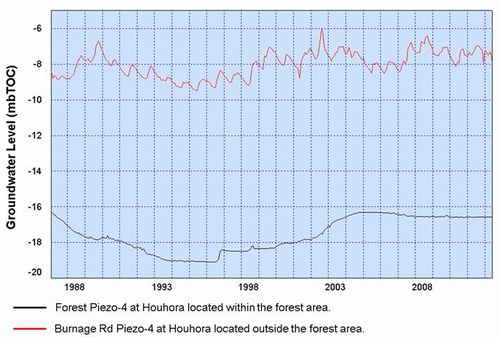
The results of groundwater level monitoring for two piezometer sites from 1987-2011 are shown in Figure 73. Both sites respond differently to rainfall recharge. Burnage Road Piezo-4, located outside the forest area, shows a strong seasonal rainfall recharge response whereas Forest Piezo-4 at Houhora located within the forest area, shows long-term rainfall variations with only minimum seasonal change. The difference in the groundwater levels in forested and non-forested areas suggests that afforestation has had a noticeable effect on the groundwater levels and recharge into the aquifer.
Figure 73: Groundwater levels (metres below top of casing) at two different sites in the Aupōuri aquifer
Based on various studies undertaken in Northland, the most likely range of rainfall recharge rates for the different type of aquifers have been estimated. These estimates are given in Table 32.
Table 32: Summary of recharge rates by aquifer type
| Aquifer type | Recharge estimate | Reliability |
| Basalt | 5-49% | Low - High |
| Scoria cone | 55-65% | Low |
| Alluvium | 4.2-40% | Low - Moderate |
| Sand | 10-30% | Low |
| Gravel | 26-52% | Moderate |
| Sandstone | 1-10% | Low |
| Greywacke | 1-5% | Low - Moderate |
Groundwater quality
The quality of groundwater can be described through the analysis of physical, chemical and microbiological parameters. Groundwater quality can be influenced by a number of human factors such as land use (for example, effluent disposal and increased use of nutrients for agriculture or horticulture) and groundwater abstraction in some areas. Natural parameters such as the source of the recharge (rainfall or river), the aquifer geology and residence time of water in the aquifer also influence groundwater quality.
The council monitors a total of 57 bores across the region for a range of variables, including electrical conductivity, pH, E. coli, major ions, nutrients, and trace metals. This is done at quarterly intervals at 39 sites; seven of them as part of the National Groundwater Monitoring Programme and 32 as part of the Regional Groundwater Quality State of Environment Programme. Six specific groundwater investigations are also carried out on six aquifers – Ruāwai, Russell, Taipā, Whatitiri, Maungakaramea and Mangawhai, where a total of 18 sites are monitored monthly or quarterly.
Groundwater quality is generally good throughout Northland with the majority of samples meeting the national standards for drinking water (Ministry of Health: 2005).
 A Northland Regional Council Monitoring Officer measuring the groundwater level at Russell.
Nitrate
Based on median values recorded over 2007/11 (Figure 74), 26 of 39 (66.7%) monitoring bores had low concentrations of nitrate (<3 mg/L-N). Ten monitoring bores (25.6%) had moderate concentrations of nitrate (3–7 mg/L-N). A further three bores, located in the Maungakaramea and Whatitiri basalt aquifers and the Oakura coastal aquifer, show median nitrate concentrations in the relatively high range (7-11.3 mg/L-N). However, none of the median nitrate concentrations for the monitoring bores were above the Drinking Water Standards for New Zealand, (Ministry of Health: 2005) maximum acceptable value of 11.3 mg/L-N.
Figure 74: Median nitrate concentrations recorded in groundwater quality monitoring bores sampled over 2007/11
Nitrate levels in several of the basalt aquifers fluctuate seasonally. Higher nitrate concentrations occur during winter when higher seasonal rainfall exacerbates leaching of nitrogen to the water table. The elevated nitrate levels measured in Maungakaramea and Whatitiri basalt aquifers are likely to be caused by animal waste, discharge of dairy effluent to land and/or fertiliser use.
The absence of organic material in these basalt aquifers means that nitrates are likely to be persistent as there is little potential for reduction through de-nitrification. Recent age analysis indicates that these aquifers have a mean resident time of 45 years. This suggests that the nitrates present in the groundwater may largely be a result of historic land use activities that occurred around 45 years ago. However, seasonal fluctuations suggest nitrate levels are also influenced by recent nitrate sources. Further age distribution analysis of groundwater is required to assess the risk of nitrate levels in the aquifers exceeding drinking water standards in the future.
Microbiological indicator – Escherichia coli (E. coli)
Escherichia coli is used as an indicator organism for contamination of drinking water by faecal material. The drinking water maximum acceptable value for E. coli is less than one E.coli per 100mL, so a positive sample indicates exceedance of the standard.
Sources of E.coli in groundwater include effluent disposal and agricultural land use activities such as dairying and livestock farming. Soil can act as a barrier and reduce the risk of microbial contamination of groundwater. However, direct contamination can occur due to poorly constructed bores and inappropriate or poorly maintained sewage effluent disposal systems. E. coli was detected in 18 bores on three or more occasions during the 20 rounds of water sampling over the period 2007-2011.
Most of the exceedances of the drinking water standards occurred in bores of coastal areas where small communities rely on septic tanks for sewage disposal or on onsite wastewater treatment systems for effluent disposal.
Iron and manganese
Iron and manganese occur naturally in groundwater depending on the geology. Elevated concentrations of iron and manganese found in different aquifers are commonly the result of natural processes, for example, interaction with iron-rich sediments. Excessive iron and manganese concentrations in groundwater gives water a rusty brown appearance, and can result in staining, irrigation system blockages and a general bad taste. The national drinking water standards (Ministry of Health: 2005) sets out the guideline values for iron and manganese for aesthetic purposes, and also the maximum acceptable value (standard) for health purposes for manganese, as shown in Table 33.
During the monitoring period 2007-2011, 21% and 33% of the sites had median levels of iron and manganese above their aesthetic guidelines for human consumption, and one site at Whananaki North had median manganese levels above the health-related standard.
The majority of sites that exceed the guidelines for iron and manganese are fed mainly from sand and gravel aquifers. There were no specific increasing trends in iron and manganese at these sites over the 2007-2011 monitoring period.
Table 33: Compliance of median iron (mg/L) and median manganese (mg/L) with standards (Drinking Water Standards New Zealand, Ministry of Health: 2005) in 39 Northland groundwater monitoring bores from 2007-2011
Guideline/standard |
Compliance level |
Iron (Fe) |
Manganese (Mn) |
||
| No. of sites | % | No. of sites | % | ||
Aesthetic guidelines Fe (0.2mg/L) - Mn (0.04mg/L) |
Non-compliance | 8 | 21 | 13 | 33 |
| Full compliance | 31 | 79 | 26 | 67 | |
Drinking standards Mn (0.4mg/L) |
Non-compliance | n/a | n/a | 1 | 3 |
| Full compliance | n/a | n/a | 38 | 97 | |
Sodium, chloride and conductivity (saltwater intrusion)
Monitoring of groundwater level, chloride, sodium and electrical conductivity is undertaken to check for seawater intrusion. The majority of coastal bores monitored have higher electrical conductivity, chloride and sodium levels than inland basalt aquifers, due to leaching of salts from marine sediments. One site, located at Pataua South, had median levels above the aesthetic guidelines for human consumption (Drinking Water Standards of New Zealand, Ministry of Health: 2005).
There is greater potential for seawater intrusion of coastal aquifers during summer when groundwater levels decline due to increased abstraction and/or decreased recharge caused by below average rainfall.
For more information refer to the New Zealand Guidelines for the Monitoring and Management of Sea Water Intrusion Risks on Groundwater (PDP Ltd: 2011).
Pesticides
The council participates in the national surveys of pesticides in groundwater conducted by the Institute of Environmental Science and Research at four-yearly intervals. In 2010, pesticides were analysed from 12 bores, most of which were located on horticultural land. Although pesticides were detected at four bores, levels of concentrations were well below the maximum acceptable value for national drinking water standards (Ministry of Health: 2005).
For more information refer to the National Survey of Pesticides in Groundwater 2010 (Close and Skinner: 2011).
Age testing
Understanding the mean age of groundwater (mean residence time) is important for interpreting the water quality results and the potential effects of land use on groundwater quality. Twenty-five bores were sampled in the 2007-2011 period in order to determine the mean age of groundwater. All these samples were collected from the state of the environment water quality monitoring network bores and analysed for tritium, chlorofluorocarbon and sulphur hexafluoride isotopes.
Preliminary results of sampling indicate that the mean residence time for different Northland aquifers range from three years to more than 225 years. Re-sampling for tritium is required for most of the sites to ensure accurate interpretation of the results.
What is being done?
Monitoring
Monitoring of groundwater resources in Northland can be divided into three main areas:
• State of the Environment monitoring – monitoring of groundwater levels and groundwater quality;
• Compliance monitoring: monitoring of drilling activities and groundwater takes; and
• Specific groundwater investigations.
The primary objectives of the state of the environment monitoring is to gain a regional perspective on baseline water quantity and quality of different aquifers and trends in groundwater quantity and quality over time as a result of climate, land use and groundwater abstraction. Monitoring also ensures the management of the groundwater resources in Northland is sustainable and consistent with the objectives and policies of the operative Regional Policy Statement and regional plans. Identification of any issues in particular aquifers through monitoring would lead to specific groundwater investigations.
Groundwater quantity
Long-term groundwater level data are essential to evaluate and forecast changes over time in groundwater resources. At present, groundwater levels are monitored at 10 sites by automatic recorders and at a further 78 sites manually. Out of the 78 manual sites, 41 are monitored at monthly intervals and the rest of the sites are measured at quarterly intervals. All monitoring sites are shown in Figure 74. The records collected from these sites are used to identify the groundwater level responses to seasonal and long-term changes in groundwater resources.
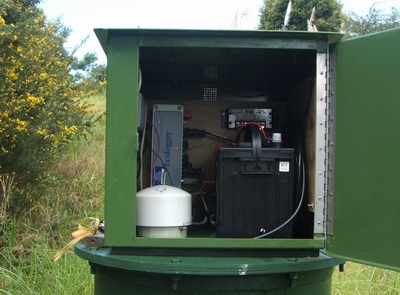 The Northland Regional Council groundwater automatic recorder at Coopers Beach.
Groundwater quality
The current regional network for groundwater quality involves the sampling from a total of 39 State of the Environment and National Groundwater Monitoring Programme sites, as described in "What is our groundwater resource?"
Specific groundwater investigations
The council undertakes specific groundwater investigations where a potential issue has been identified, for example, elevated nitrate or increased risk of saltwater intrusion in coastal areas. The following six aquifers are the subject of current investigations – Taipā, Ruāwai, Russell, Whatitiri, Maungakaramea and Mangawhai (Table 34).
The reports on these aquifers and other groundwater investigations are available on the council's website: www.nrc.govt.nz/groundwaterReports
Table 34: Summary of groundwater investigations in specific Northland aquifers
| Aquifer and use | Issue | Comments and Compliance with New Zealand drinking water standards |
| Taipā Domestic |
Saltwater intrusion and nitrate | Nitrate is still elevated but did not exceed standards during 2007/11. Saline indicators were well below standards. |
| Ruāwai Domestic, stock, public drinking water |
Saltwater intrusion and iron | Chloride, sodium and iron concentrations remain elevated. Median chloride and sodium levels exceeded the standards at two sites and the median iron concentrations at all six sites have exceeded the standards during 2007/11. The high iron is a result of natural processes. Sampling has been reduced from 2012. |
| Russell Domestic |
Saltwater intrusion and bacterial | Saline indicators are well below standards. The standards for E.coli were not exceeded frequently during 2007/11 – this is likely to be a result of the sewage reticulation system. Sampling has been reduced from 2012. |
| Whatitiri Domestic, horticultural, irrigation, stock drinking |
Nitrate | Nitrate is still elevated but has not exceeded standards during 2007/11. |
| Maungakaramea Domestic, horticultural, irrigation, stock drinking |
Nitrate | Nitrate is still elevated and exceeded standards on two occasions at one site and nine occasions at a second site during 2007/11. Seasonal trends are evident and potential sources are being investigated. |
| Mangawhai Domestic |
Nitrate | Nitrate is occasionally elevated and exceeded standards on one occasion during 2007/11. Potential sources are being investigated. |
Groundwater/surface water interaction
Understanding groundwater/surface water interaction where groundwater feeds the base flow to streams is critical for the sustainable management of the water bodies.
A review of mathematical approaches for calculating the effects of groundwater abstraction on stream depletion was undertaken to assess their appropriateness for use in Northland. A tool was then developed to predict stream depletion rates in the Northland basalt and to help assess level of allocation in combined groundwater/surface water catchments.
For more information refer to the report ‘Groundwater/surface water integrated management: Maunu-Maungatapere-Whatitiri basalt aquifers.pdf' available on the council's website: www.nrc.govt.nz/groundwaterReports
Policy documents
The Regional Soil and Water Plan for Northland details the objectives, policies and rules associated with groundwater management in the region. The plan recognises 36 basalt and coastal aquifers, and a geothermal aquifer as potentially ‘at risk' due to high water demand, surrounding land use, surface water interaction or proximity to seawater and septic tank discharges. Aupōuri sand/shell aquifer and Ruāwai alluvial aquifer have also been classified in the plan as sensitive to bore construction. The locations of these aquifers are shown in Figure 75.
Figure 75: Aquifers identified as "at risk"
The rules in the Regional Water and Soil Plan restrict groundwater takes, use, diversions and drilling activities depending on the potential effects of the activities.
The rules permit groundwater takes for reasonable stock and domestic requirements provided specific criteria are met. The criteria, among other things, limit the daily volume of groundwater that can be taken depending on the location and the potential for adverse effects as a result of the take. For example, smaller volumes are permitted to be taken from coastal ‘at risk' aquifers. In the event the permitted criteria specified in the rules cannot be met, then resource consent to take groundwater is required from the council.
The plan also formulates specific conditions and standards for bore construction, bore closure and alteration to avoid or minimise potential adverse effects. It is a requirement that, within one month of final completion of a bore, a bore completion report (driller's bore log) is submitted to the council so that the bore can be registered in the council's GIS-integrated bore database.
Education and advice
The council provides information on Northland's groundwater resources to the public by way of media releases, pamphlets and publishing all available reports on its website.
The council also provides advice on the importance of appropriate construction and proper maintenance of bores to prevent groundwater pollution. The council's bore and groundwater quality databases are frequently updated. Data on these databases are available to the public upon request.
How are we measuring up against our objectives?
The following are the anticipated environmental results relevant to groundwater quality listed in the operational Regional Policy Statement:
Water quality suitable for desired purposes
Objectives 17.3.1 of the RPS and 7.4.1 of the Regional Water and Soil Plan state that groundwater be potentially usable for water supply and protection of uses of receiving water bodies. The following points demonstrate the current situation and steps taken to avoid groundwater quality degradation:
• In general, groundwater in Northland is of a high enough quality to allow it to be consumed without treatment. The results from groundwater quality monitoring indicate that the majority of determinants analysed for each sample are well below New Zealand drinking water standards/guidelines, however elevated concentrations of nitrates, manganese, iron, sodium and chloride (saline intrusion) and bacteria have occurred at some sites.
• The council undertakes appropriate groundwater quality investigations where potential issues have been identified from groundwater quality monitoring, for example, elevated nitrate or increased risk of saltwater intrusion in coastal areas. There are currently six aquifers in Northland that are subject to specific investigation – Ruāwai, Taipā, Maungakaramea, Mangawhai, Russell and Whatitiri.
Contaminants in water bodies reduced
The main threats to groundwater in terms of contaminants are nitrate, saline intrusion and faecal bacteria. The following points demonstrate the outcomes and efforts made by the council to reduce the contaminants in groundwater:
• The median nitrate-nitrogen concentrations in all aquifers sampled during 2007-2011 are below the NZ drinking water standard of 11.3 mg/L nitrate-nitrogen.
• Poor bore-head construction can result in groundwater contamination. All new bores require a consent which ensures that bore heads are constructed to a certain standard to prevent contamination occurring.
• As part of the renewal of existing discharge consents, an assessment is undertaken on the actual effect of the discharge on water quality and whether the treatment process needs to be improved to reduce the concentration of contaminants being discharged.
The adverse effects of contaminants in water bodies and coastal waters are avoided, remedied or mitigated
• The council undertakes regional groundwater quality monitoring programmes to assess baseline water quality of the different aquifers in Northland and to identify any trends in groundwater quality over time as a result of the climate, land use and groundwater abstraction.
• Groundwater take consents that could potentially result in seawater intrusion are required to have groundwater samples analysed twice per year for chloride concentration.
• A number of saline indicator recorder sites have been established to monitor the risk of saline intrusion.
Protection of important freshwater habitats, particularly wetlands from reductions in surface water and groundwater levels
• Section 25 of the Regional Water and Soil Plan specifies the rules for the taking, use and diverting of groundwater. A groundwater take will be considered likely to cause an adverse effect on the environment where it changes the seasonal or annual range in water level of any indigenous wetland to an extent and manner that may adversely affect the wetland's natural ecosystem. Through these provisions and the consenting process, council can ensure protection of important freshwater habitats is occurring.
Sustainable and efficient use of water resources of Northland
• The Regional Water and Soil Plan outlines management practices aimed at sustainable and efficient use of groundwater resources in Northland. Some of the tools used in this regard are:
- recognition of "at risk aquifers";
- groundwater level and spring flow monitoring;
- control of taking groundwater through the resource consent process; and
- investigations to better understand the resources.
• Resource consents for taking groundwater generally specify the volumes and rates permitted to ensure the resource is allocated in a sustainable manner.
• Water allocation is not currently provided for within the Regional Water and Soil Plan as no allocation limits have been set for the use of water resources. The plan currently only includes ecological flows.
• Those with permitted water takes are being encouraged to provide their take information to the council. This enables the council to start to understand the cumulative effects of permitted water takes within a catchment and give some level of protection for the individual existing water takes.
Preservation of the natural character, intrinsic, ecosystem and amenity values of natural water bodies to the extent that these depend on water levels and flows
• Results of groundwater level monitoring show that there are no groundwater deteriorating trends in Northland aquifers.
Increased awareness of water conservation and greater implementation of water conservation practises
• Resource consents to take groundwater generally have conditions imposed that require the maintenance of water systems to minimise or avoid water loss by leakage. Every effort is made to have a meter installed on groundwater takes so that accurate measurements of water can be recorded.
• The council promotes efficient irrigation methods by assessing the water volumes applied for against industry standards and best practice guidelines.
References
Ministry of Health (2005). Drinking water standards for New Zealand 2005 (revised 2008). Published by the Ministry of Health, Wellington, New Zealand.
Northland Regional Council (2002). Regional Policy Statement for Northland. Produced by the Northland Regional Council. Whāngārei, New Zealand.
Northland Regional Council (2007). Regional Water and Soil Plan for Northland. Produced by the Northland Regional Council. Whāngārei, New Zealand.
Northland Regional Council (2007). State of the Environment Report. Published by Northland Regional Council. Whāngārei, New Zealand.
PDP Limited (2011). New Zealand Guidelines for the Monitoring and Management of Sea Water Intrusion Risks on Groundwater.
Close, M; Skinner, A. (2011). National Survey of Pesticides in Groundwater 2010.
Sinclair Knight Merz for the Northland Regional Council (2012). Groundwater/Surface Water Integrated Management: Maunu-Maungatapere-Whatitiri Basalt Aquifers.
Summary table and reports of the different groundwater investigations, the area/aquifer covered, the key findings and recommendations in Northland are available on the council's website: www.nrc.govt.nz/groundwaterReports
Appendix C
Table35: Summary of the aquifer characteristics for principal aquifers in Northland
| Aquifer (zone) | Broad lithologic description | Status | Saturated thickness (m) | Transmissivity (m2/day) | Storativity |
| Aupōuri (Lower Aupōuri peninsula) |
Predominantly quartz and feldspar sands overlying limestone/ sandstone/mud stone | Semi- confined to confined | 12-90 | 12-850 | 0.01-0.00002 |
| Coopers Beach | Tangihua volcanic overlain with sandstone/mud stone | Semi- confined to confined | 26-97 | 12-25 | 0.0016-0.0000034 |
| Kerikeri/ Kaikohe |
Basalt overlying cretaceous siltstone | Semi confined | 50 | 50-175 | 0.025-0.00072 |
| Whāngārei (Matarau) | Basalt flows, cones and dikes overlying sandstone/mud stone | Semi unconfined | 5-70 | 108-430 | |
| Whāngārei (Glenbervie) |
Taheke basalt overlying greywacke/ interbeded sandstone and mud stone | Semi confined | 30-80 | 2-39 | 0.002 |
| Whāngārei (Maunu) | Taheke basalt overlying sandstone/mud stone | Semi unconfined | 8-58 | 30-89 | 0.002-0.0006 |
| Whāngārei (Maungatapere) |
Basalt with scoria overlying sandstone/mud stone | Semi confined | 11-58 | 25-45 | |
| Whāngārei (Whatitiri) |
Taheke basalt overlying sandstone | Confined | 4-30 | 25-4000 | 0.00004-0.0003 |
| Whāngārei Maungakaramea |
Basalt overlying Micaceous sandstone | Semi unconfined | 18-36 | 2-400 | 0.027 |
| Whāngārei (Three mile bush) |
Basalt with scoria overlying sandstone/mud stone | Semi unconfined | 12-46 | 2-489 | 0.038 |
| Mangawhai | Consolidated unweathered sands with quartz alluvial mud and gravel | Unconfined | 5-9 | 250-700 | 0.04 |
| Mangawhai | Non-calcareous sandstone thinly or thickly bedded with mud stone | Confined | 9-99 | 1-27 | 0.0016-0.00015 |
| Taipā | Sand feldspathic with some quartz | Unconfined | 6 -7 | 90 – 150 | 0.085-0.2 |
| Tara | Basalt flow with underlying sedimentary rocks | Semi unconfined | 4-20 | 38-66 | |
| Russell | Gravels overlying Waipapa group greywacke | Unconfined to semi unconfined | 148-176 | ||
| Russell | Waipapa group greywacke | Semi-confined to confined | 0.1-170 | 0.0018-0.0003 | |
| Ruāwai | Alluvium/sand and gravel | Unconfined to confined | 3-6 | 14-132 | |
| Other shallow coastal aquifers | Predominantly sands/alluvial mud and gravel. | Unconfined |