12.3 What is the state of our rivers and streams?
One of the objectives as set out in the Regional Policy Statement and Regional Water and Soil Plan for Northland is to maintain and enhance water quality of lakes, rivers and streams to be suitable, in the long term, and after reasonable mixing of any contaminant with the receiving environment and disregarding the effect of any natural events, for the purposes below as may be appropriate;
· Aquatic ecosystems.
· Contact recreation.
· Water supplies.
· Aesthetic and cultural purposes.
The classification of water bodies in Northland will be carried out in the future as more information and data becomes available, as resources within the Council increase and when community support is gained. Therefore, in this report the water quality of many rivers, streams and lakes that are already monitored is compared to the most relevant guidelines to establish the proportion of monitored water bodies that are suitable for each purpose. This includes sites sampled as part of the National and Regional River Water Quality Monitoring Networks and the Recreational Bathing Water Quality Monitoring Programme and annual macroinvertebrate monitoring. Also where possible this report will cover whether this water quality is improving, stable or deteriorating.
Water quality for contact recreation
Waterways are not always safe for recreational activities, as they can sometimes become contaminated with human or animal effluent, which contains large numbers of organisms capable of causing illness. The most common sources of bacterial contamination are human sewage, stormwater and rural run-off, which can include bacteria from stock and feral animals.
Samples are analysed for the pollution indicator bacteria, Escherichia coli (E. coli) following the recommended methods in the ‘Microbiological Water Quality Guidelines for Marine and Freshwater Recreational Areas' (MFE 2002). In this report the results are compared to the action mode guideline of 550 E. coli/100mL (MFE 2002).
 Recreational bathing sites
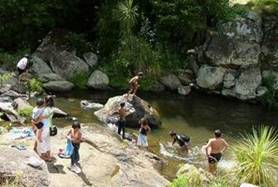
The Northland Regional Council, in conjunction with the district councils and Northland Health, survey the water quality at a number of the region's most popular freshwater swimming spots every summer. One of these is Kapiro Stream in the mid north, as shown in the photograph (right).
Twenty-one sites on lakes and rivers throughout Northland have been sampled weekly for the past five summers to check whether the microbiological water quality is safe for swimming.
The results for these 21 sites is presented in table 2 (below) including the number of samples, median, Hazen 95th percentile (as recommended by the MFE guidelines) and the percentage of samples that comply with the 550 E. coli/100mL action mode guideline. Note: Six sites have been sampled for less than five years, which is indicated in brackets next to the site.
Table 2: Statistics for recreational bathing programme sites for the last five seasons (unless stated otherwise in brackets next to the site).
| Site | Number of samples | Median | Hazen 95th percentile | % of samples that comply with 550 E. coli/100mL |
| Lake Ngatu at launch site | 50 | 5 | 134 | 98% |
| Lake Taharoa at Promenade Point | 54 | 5 | 39 | 100% |
| Lake Taharoa at pump house | 53 | 5 | 104 | 100% |
| Lake Ngatu at South end | 50 | 10 | 110 | 98% |
| Waipoua River (2) | 24 | 41 | 719 | 96% |
| Kaihu River | 52 | 121 | 4884 | 81% |
| Waipapa Stream | 53 | 122 | 779 | 94% |
| Omamari Beach Stream (4) | 46 | 167 | 1168 | 85% |
| Waitangi River | 55 | 193 | 2106 | 89% |
| Kerikeri River | 54 | 211 | 2504 | 76% |
| Kapiro Stream (4) | 42 | 222 | 803 | 88% |
| Mangakahia River at Twin Bridges | 54 | 246 | 3879 | 72% |
| Raumanga Stream | 55 | 250 | 3719 | 71% |
| Tirohanga Stream | 55 | 272 | 1586 | 85% |
| Otaua Stream (3) | 36 | 282 | 5138 | 69% |
| Hatea River at Whangarei Falls | 54 | 352 | 3836 | 72% |
| Lake Waro, Hikurangi | 51 | 770 | 6317 | 31% |
| Wairoa Stream | 51 | 770 | 6317 | 31% |
| Ocean Beach Stream (3) | 35 | 794 | 6867 | 40% |
| Langs Beach Stream (3) | 36 | 1194 | 4543 | 31% |
| Otiria Stream | 54 | 1211 | 4097 | 11% |
The sites can be split into compliance categories based on how many samples comply with the recreational bathing guidelines in each year, following the national reporting methods (MFE 2007). Table 3 (below) shows the number of sites in each category as a percentage of the total number of sites sampled in that summer, which was 14 sites in 2003-04, 20 in 2004-05, 22 in 2005-06 and 25 in 2006-2007.
Table 3: Percentage of the recreational bathing sites in each compliance category for the four summers from 2003 to 2007.
Compliance category |
What does this mean? |
Proportion of sites in each compliance category |
|||
| 03-04 | 04-05 | 05-06 | 06-07 | ||
| 95-100% samples comply | Between 95% and 100% of samples taken over the bathing season complied with guidelines. Sites in this category have typically good water quality and are generally safe for recreation. | 29% | 40% | 14% | 32% |
| 90-94% samples comply | Between 90% and 95% of samples taken over the bathing season complied with guidelines. | 21% | 10% | 9% | 8% |
| 75-89% samples comply | Between 70% and 90% of samples taken over the bathing season complied with guidelines. | 21% | 20% | 32% | 28% |
| 0-74% samples comply | More than 25% of samples taken over the bathing season did not comply with guidelines. Sites in this category have typically poor water quality and are often not safe for recreation. | 29% | 30% | 45% | 32% |
In all summers, except 2005-2006, at least a quarter of the sites sampled were generally safe for recreational use. However, every year at least a quarter of the sites have typically poor water quality that is frequently not safe for swimming.
This is slightly worse than nationally, with 40 to 50% of the sites sampled throughout New Zealand having typically good water quality (95 to 100% sample compliance) and less than 15% having poor water quality (MFE 2007).
Many of the recreational bathing sites in Northland now have sufficient data to assess their suitability for recreation grade (SFRG) following the guidelines (MFE 2002). Other than the two lakes, Ngatu and Taharoa, all sites in Northland have an interim SFRG of poor or very poor, as shown in figure 14 (below). A few of these sites have consistently high bacterial levels regardless of rainfall such as Otiria Stream near Moerewa, Wairoa Stream in Ahipara and two small streams flowing on to beaches (one at Ocean Beach and one at Langs Beach) and these grades are due to contamination mostly as a result of run-off during rainfall. The Council and Northland Health recommend that you do not swim for several days after heavy rain or if the water is turbid.
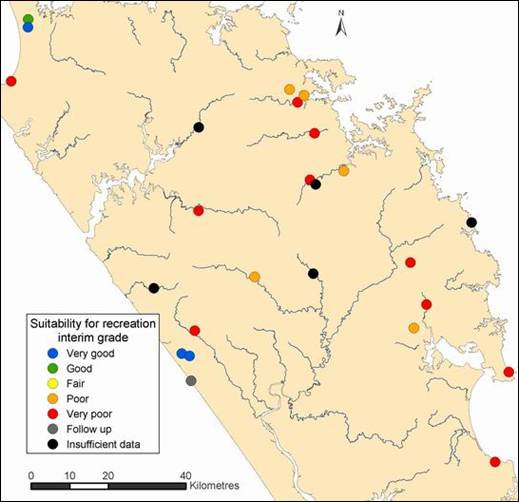
Figure 14: Suitability for recreation interim grade (SFRG) for the 25 bathing sites sampled in 2006-2007. Note: Grades can only be calculated for sites with at least three summers of data.
The majority of the recreational bathing sites are generally acceptable for swimming and other freshwater recreational activities during dry weather, but after heavy or prolonged rain, the waterways become unsuitable for several days. The exceptions to this are Langs and Ocean Beach Streams, Otiria and Wairoa Streams, which are all generally unsuitable for freshwater contact in all conditions.
River Water Quality Monitoring Network sites
The bacteriological water quality results from 21 sites in our region's River Water Quality Monitoring Network (RWQMN) can also be assessed against the recreational bathing guideline of 550 E. coli/100mL to check their suitability for swimming. The following three sites are in both the RWQMN and recreational bathing programme; Waipoua River, Waipapa River and Mangakahia at Twin Bridges.
The results for the bathing season (November to March), as recommended by the MFE guidelines, for these 21 sites is presented in table 4 (below), including the number of samples in November to March since analysis for E. coli started in December 1999, median, Hazen 95th percentile (as recommended by the MFE guidelines) and the percentage of samples that comply with the action mode guideline.
Table 4: Statistics for RWQMN sites for the bathing seasons between December 1999 and March 2007. Note: Sampling started after December 1999 for some sites, as shown in brackets below.
| Site | Number of samples | Median | Hazen 95th percentile | % of samples that comply with 550 E. coli/100mL |
| Waipoua River (Jul 02) | 25 | 74 | 673 | 96 |
| Waipapa River at Puketi Forest | 32 | 91 | 1632 | 94 |
| Wairua River at Purua | 35 | 130 | 1480 | 83 |
| Opouteke River | 38 | 146 | 1587 | 84 |
| Manganui River (Aug 01) | 28 | 128 | 6760 | 82 |
| Kaihu River (Jul 02) | 25 | 108 | 556 | 96 |
| Waitangi River at Watea | 35 | 122 | 1160 | 89 |
| Victoria River | 38 | 261 | 2513 | 79 |
| Mangakahia River at Twin Bridges | 38 | 212 | 1821 | 82 |
| Mangahahuru Stream at Main Rd (Jul 05) | 10 | 384 | 836 | 90 |
| Mangakahia River at Titoki | 34 | 195 | 1460 | 77 |
| Whakapara River | 39 | 147 | 3969 | 82 |
| Awanui River at FNDC water take (Mar 02) | 26 | 276 | 1420 | 85 |
| Waiotu River at SH1 (Mar 00) | 36 | 318 | 9384 | 69 |
| Punakitere River (Aug 01) | 30 | 321 | 3076 | 77 |
| Awanui River upstream of Waihue channel | 39 | 374 | 2206 | 72 |
| Waiarohia Stream at Second Ave (Jul 05) | 10 | 567 | 24193 | 50 |
| Mangahahuru Stream at Apotu Rd | 39 | 780 | 5978 | 33 |
| Waitangi River at Waimate | 39 | 816 | 3306 | 36 |
| Mangere River | 39 | 519 | 14200 | 54 |
| Waiarohia at Whau Valley Rd (Jul 05) | 10 | 1318 | 3654 | 0 |
Two of the 21 RWQMN sites have 95% or more of their summer (November to March) samples in compliance with the recreational bathing guideline – Waipoua and Kaihu Rivers. A further two sites have at least 90% of their summer samples in compliance with the guideline – Waipapa at Puketi Forest and Mangahahuru at Main Road.
Seven of the 21 sites (33%) have less than 75% of their summer samples compliant with the guidelines, as shown in table 5 (below), which indicates that these sites are often not safe for swimming.
Table 5: Percentage of the 21 RWQMN sites in each compliance category
| Compliance category | What does this mean? | Proportion of sites in each compliance category Jan 00 to Dec 06 |
| 95-100% samples comply | Between 95% and 100% of samples taken over the bathing season complied with guidelines. Sites in this category have typically good water quality and are generally safe for recreation. | 9.5% |
| 90-94% samples comply | Between 90% and 95% of samples taken over the bathing season complied with guidelines. | 9.5% |
| 75-89% samples comply | Between 70% and 90% of samples taken over the bathing season complied with guidelines. | 47.6% |
| 0-74% samples comply | More than 25% of samples taken over the bathing season did not comply with guidelines. Sites in this category have typically poor water quality and are often not safe for recreation. | 33.3% |
The RWQMN sites are similar to the recreational bathing sites, with approximately a third often not suitable for swimming, as shown in red in figure 15 (below). There are slightly more recreational bathing sites than RWQMN sites in the category of 95% to 100% of samples compliant with guidelines because the recreational bathing sampling includes relatively pristine lake sites, which have better microbiological water quality than the river sites.
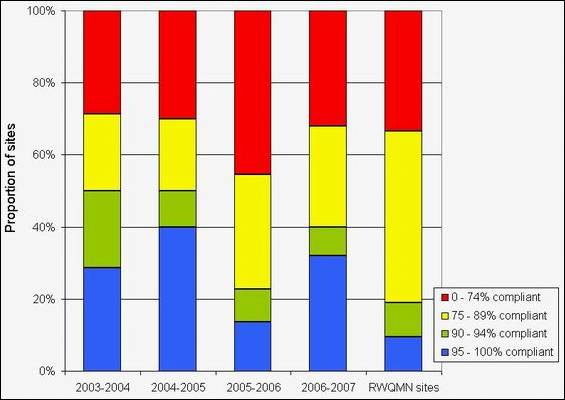
Figure 15: Proportion of recreational bathing sites every summer from 2003-2004 to 2006-2007 and proportion of RWQMN sites for summer results from 1999 to 2007 in each compliance category.
RWQMN sites in native forest or mostly native or exotic forest catchments have fewer samples that exceed the 550 E. coli/100mL action mode level such as Waipoua, Waipapa (Puketi) and Kaihu Rivers, and Mangahahuru Stream at Main Road, than sites in agricultural land use as shown in figure 16 (below).
Of the 14 RWQMN sites with sufficient data to analyse long term trends, only one had a significant trend. Mangere Stream showed a meaningful increase in E. coli of 118 MPN/100mL from 2000 to 2006 (NRC 2007). This consistently elevated and increasing trend in E. coli will be investigated further, see case study 3 for more information.
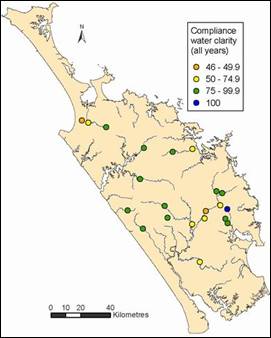
Another indicator which can be used to assess the suitability of a site for contact recreation is water clarity. Elevated bacterial levels are typically associated with turbid water (low clarity). Aesthetics of swimming in clear water is important as most people perceive clear water as being unpolluted. The Regional Water and Soil Plan (RWSP) for Northland (NRC 2004), in section 7.6.8, states that visual clarity should not fall below 1.6 metres for contact recreation purposes. Only five of the 21 RWQMN sites have water clarity greater than 1.6 m on at least 50% of sampling occasions, as shown in figure 17 (below). Based on this many of the RWQMN sites do not meet swimming suitability guidelines, which is consistent with the E. coli results.
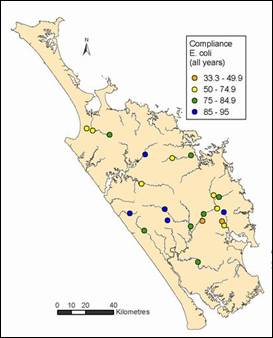
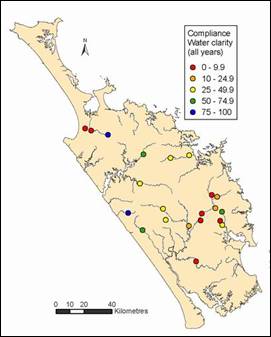
Figure 16: Percentage of samples for each site that meet the suitability for swimming guideline of 550 E. coli/100mL (MfE 2002) for 21 RWQMN sites (left). Figure 17: Percentage of samples for each site that meet the water clarity guideline of 1.6 m (NRC 2007) for 21 RWQMN sites (right).
Water quality for aquatic ecosystems
The medians for all parameters at each site for 2006 and all years are in tables 11 and 12 respectively in appendix B.
The data from the last 10 years for all our RWQMN sites can be compared to the ANZECC trigger values for the protection of aquatic ecosystems in New Zealand (ANZECC 2000).
It is important to note that the trigger values are used to assess the risk of adverse effects on the ecosystem and when results are outside trigger values further investigation is required to determine whether there are adverse effects on the environment and to what extent. There are two sets of trigger values; one for upland rivers, which only includes one site in the network (Waipoua River), and one for lowland rivers as shown in table 6 (below).
Table 6: Trigger values for NZ lowland and upland rivers (ANZECC 2000)
| Parameter | Trigger values for lowland rivers | Trigger values for upland rivers |
| Dissolved oxygen (% Saturation) | 98 - 105 | 99 – 103 |
| Water clarity (m) | > 0.6 | > 0.8 |
| Turbidity (NTU) | < 5.6 | < 4.1 |
| Dissolved reactive phosphorus (mg/L) | < 0.01 | < 0.009 |
| Total phosphorus (mg/L) | < 0.033 | < 0.026 |
| Nitrate, nitrite nitrogen (mg/L) | <0.444 | <0.167 |
| Ammoniacal nitrogen (mg/L) | < 0.021 | < 0.01 |
| Total nitrogen (mg/L) | < 0.614 | < 0.295 |
| pH | 7.2 – 7.8 | 7.3 – 8.0 |
 Dissolved oxygen
Only one of the 21 RWQMN sites comply with the ANZECC trigger value range for dissolved oxygen (DO) on more than 50% of sampling occasions as shown in figure 19 (right). This is Waitangi River at Watea, which complies with the DO guideline range on 71% of sampling occasions.
Figure 18: Percentage of samples that comply with the ANZECC trigger values for dissolved oxygen (% saturation) for each of 21 RWQMN sites (right).
The Awanui River site above Waihue channel has the lowest dissolved oxygen with a median of 85% for 2006. However sites with high dissolved oxygen are as much of a concern as those with low because DO often has strong diurnal cycles. Super-saturated oxygen conditions during the day are usually followed by low oxygen (anoxic) levels at night (refer to diurnal patterns below). This has been found in other areas of New Zealand (NRC 2007).
Diurnal patterns
Dataloggers (datasonde) were deployed at the two RWQMN sites on the Mangahahuru Stream: Main Road in the headwaters and Apotu Road further downstream. The dataloggers were deployed for approximately a week at both sites simultaneously and programmed to measure and record dissolved oxyg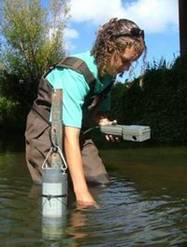 en every 30 minutes.
NRC staff member checking calibration of datasonde for DO with handheld meter (right).
Both sites showed a clear diurnal cycle in dissolved oxygen with peaks between 3 and 4pm and lows between 6 and 7am as shown in figures 19 and 20 (below). More importantly these results highlight the difference in DO cycles between the two sites. The less impacted Main Road site has a small range with its dissolved oxygen fluctuating by about 10% throughout the cycle, while the Apotu Road site has a much greater range of about 75%. This is most likely a result of the large mats of oxygen weed at the Apotu Road site, which produce copious amounts of oxygen during the light (day time) phase of photosynthesis but consume oxygen during the dark (night time) phase of photosynthesis.
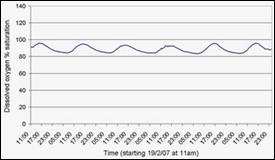
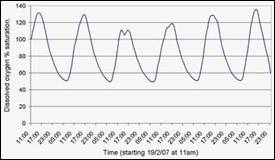
Figures 19: Dissolved oxygen (% saturation) from 11am on 19 February 2007 at Mangahahuru Stream at Main Rd (left). Figure 20: Similarly dissolved oxygen (% saturation) at Apotu Rd (right).
Nutrients
 Mangere Stream has the highest nutrient levels of the 21 RWQMN sites, with the highest median ammoniacal nitrogen, nitrate nitrite nitrogen, total nitrogen, dissolved reactive phosphorus and total phosphorus for 2006. Sites with predominantly native forest or exotic forest in their upstream catchments have the lowest nutrient levels such as Victoria, Waipapa, Waipoua and Opouteke River sites and Mangahahuru Stream at Main Road.
Ammoniacal nitrogen
Three headwater sites complied with the ammoniacal nitrogen ANZECC trigger value on all sampling occasions as shown in figure 21 (right); Waipapa River, Waiarohia Stream at Whau Valley and Mangahahuru Stream at Main Road. Mangere River only complied with the guideline on 13% of sampling occasions. Note the Waipoua River site does appear to perform as well as the other headwater sites because it is the only site that has been compared to the stricter ANZECC trigger value for upland rivers.
Figure 21: Percentage of samples that comply with the ANZECC trigger values for ammoniacal nitrogen for each of 21 RWQMN sites (right).
Nitrogen
Five sites comply with the ANZECC trigger value for oxides of nitrogen (or otherwise known as nitrate nitrite nitrogen - NNN) on all sampling occasions as shown in figure 22 (below). They are Victoria, Waipoua, Waipapa and Opouteke River sites and the site at the FNDC water take on Awanui River. Mangere River complied with the NNN trigger value on 15% of sampling occasions.
Mangahahuru Stream at Main Road is the only site that complies with ANZECC trigger value for total nitrogen (TN) on all sampling occasions as shown in figure 23 (below). Three sites exceeded the trigger value for TN on over 75% of sampling occasions; Punakitere River, Mangere Stream and Waiarohia Stream at Whau valley.
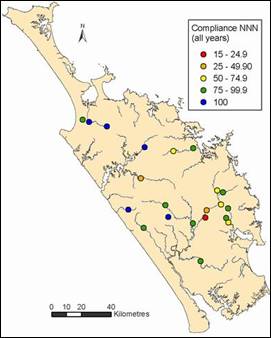
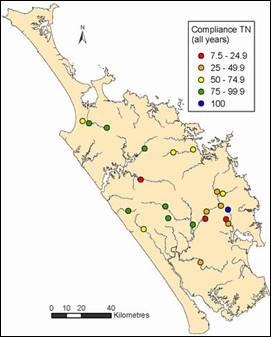
Figure 22: Percentage of samples that comply with the ANZECC trigger values for nitrate, nitrite nitrogen for 21 RWQMN sites (left) Figure 23: Similarly total nitrogen for 21 RWQMN sites (right).
Phosphorus
The 21 RWQMN sites had similarly poor compliance with both the dissolved reactive phosphorus (DRP) and total phosphorus (TP) trigger values as shown in figures 24 and 25 (below). One site (Mangahahuru Stream at Main Road) complied with the DRP trigger value on all sampling occasions and no sites complied with the TP trigger value on all sampling occasions.
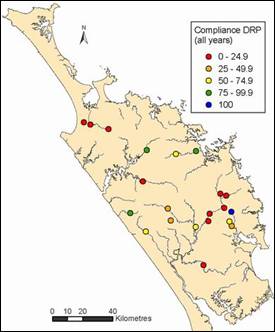
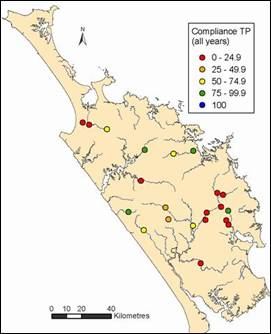
Figure 24: Percentage of samples that comply with the ANZECC trigger values for dissolved reactive phosphorus for 21 RWQMN sites (left). Figure 25: Similarly total phosphorus for 21 RWQMN sites (right).
There were 10 and 11 sites that complied with the DRP and TP trigger values respectively on less than 25% of sampling occasions. Three sites complied with both DRP and TP trigger values on less than 5% of sampling occasions: Mangere, Awanui at Waihue Channel and Wairua at Purua.
Water clarity and turbidity
Thirteen of the 21 RWQMN sites comply with the ANZECC guidelines for water clarity for the protection of aquatic ecosystems on over 75% of sampling occasions, as shown in figure 26 (below). Only two sites comply with the guideline on less than 50% of sampling occasions; Awanui above Waihue channel and Wairua at Purua. However, tighter water clarity guidelines are used for waters classified for the purpose of contact recreation (WASP) as discussed above, which includes many of Northland's rivers.
Less then 25% of sampling occasions for Waiotu River, Wairua at Purua and Waiarohia at Whau Valley comply with the ANZECC guideline for turbidity, as shown in figure 27 (below), while seven sites comply with the ANZECC guidelines over 75% of the time.

Figures 26: Percentage of samples that comply with the ANZECC trigger values for water clarity for 21 RWQMN sites (left) Figure 27: Similarly turbidity for 21 RWQMN sites (right).
Suspended solids
An investigation is being carried out to determine if forest harvesting is increasing sediment loads in the Opouteke River. An extra sample has been collected at three of the RWQMN sites for the last two years and analysed for suspended solids. The sites include Opouteke River which has significant areas of forest being felled and two reference sites: Waipoua River (native forest) and Mangakahia River at Twin Bridges (native and exotic forest with some pasture).
The initial two years of results suggest that Opouteke River does not have a higher sediment load than Mangakahia or Waipoua, as shown in figure 28 (below). However, this first two years of data has not captured any significant storm events, which is when you would expect to get particularly high sediment loadings.
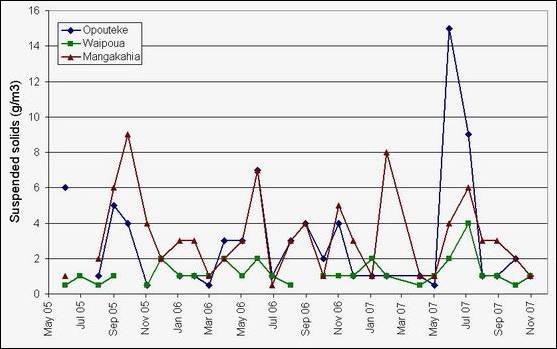
Figure 28: Suspended solid levels (g/m3) in Opouteke, Waipoua and Mangakahia Rivers.
Heavy metals in Waiarohia Stream
Sampling for heavy metals in stream sediments was established in November 2006 from the Waiarohia Stream in Whangarei, to investigate the effects of urban land use. Two sites are sampled; one at Whau valley, which is the upstream or background site and the other at Second Avenue, which is the downstream site. The Waiarohia Stream between these two sites is heavily influenced by road run off and urban stormwater. Sediment samples are collected every three months and analysed for heavy metals.
The results for the first five sampling occasions are presented in table 7 (below). The results are compared to the ANZECC sediment quality guidelines for the protection of aquatic ecosystems (also in table 7). None of these initial results exceed the high trigger values for the protection of aquatic ecosystems. However a few results (shown in italics and red) exceed the low trigger values.
Table 7: Heavy metal levels (mg/kg) in stream sediments from two Waiarohia Stream sites, compared to the ANZECC trigger values.
|
|
Second Ave site |
Whau valley site |
ANZECC values |
|||||||||
|
|
Nov 06 |
Feb 07 |
May 07 |
Aug 07 |
Nov 07 |
Nov 06 |
Feb 07 |
May 07 |
Aug 07 |
Nov 07 |
Low |
High |
|
Arsenic |
8 |
5 |
6 |
6 |
7.8 |
10 |
9 |
12 |
13 |
7.5 |
20 |
70 |
|
Cadmium |
0.2 |
0.1 |
0.1 |
<0.08 |
0.1 |
0.1 |
0.3 |
0.1 |
0.09 |
0.07 |
1.5 |
10 |
|
Chromium |
21 |
21 |
18 |
<30 |
<22 |
13 |
20 |
18 |
<30 |
<22 |
80 |
370 |
|
Copper |
42 |
26 |
27 |
22 |
25 |
18 |
33 |
23 |
21 |
16 |
65 |
270 |
|
Mercury |
0.3 |
<0.1 |
<0.1 |
<0.3 |
<1.1 |
0.3 |
0.4 |
0.2 |
<0.3 |
<1.1 |
0.15 |
1 |
|
Nickel |
15 |
17 |
15 |
14 |
11 |
10 |
15 |
13 |
14 |
9.6 |
21 |
52 |
|
Lead |
50.5 |
31.9 |
35.2 |
20 |
26 |
19.3 |
31 |
23.1 |
19 |
15 |
50 |
220 |
|
Zinc |
338 |
242 |
161 |
<200 |
180 |
99 |
189 |
98 |
<200 |
<30 |
200 |
410 |
These initial results show that for most heavy metals there is very little difference between the upstream and downstream site. However, both lead and zinc have been slightly higher at the downstream site.
It is likely that the slightly elevated mercury levels are of natural origin, especially as they are higher at the upstream site. The elevated zinc levels at the downstream site are possibly a result of leaching from galvanised steel in the stream or runoff from roads and roofs, while the slightly elevated lead levels are most likely a result of road runoff.
The dataset is limited, so care should be taken with this interpretation of the results. Sampling will continue at these two sites and other sites will be investigated in the future.
 Macroinvertebrates
Stream macroinvertebrates can be used as an indicator of stream health and are monitored annually at each RWQMN site. A summary of the 2007 results for the 24 RWQMN sites sampled is in table 13 in appendix C. Some of the key findings are presented below.
For detailed information on the methods used and the results see the following report available on the Regional Council website: ‘Northland Macroinvertebrate Monitoring Programme – 2007 Monitoring Report' (Pohe and Hall 2007) at the following link:
http://www.nrc.govt.nz/Resource-Library-Summary/Research-and-reports/Rivers-and-streams/
The Macroinvertebrate Community Index (MCI) and Semi-Quantitative Macroinvertebrate Community Index (SQMCI) scores can be used as an indicator of organic pollution based on the interpretation of Boothroyd and Stark (2000), shown in table 8 (below).
Table 8: Interpretation of MCI and SQMCI (adapted from Boothroyd and Stark 2000)
| Interpretation | MCI | SQMCI |
| Clean water | > 120 | > 6.0 |
| Possible mild pollution | 100 – 119 | 5.0 – 5.9 |
| Probable moderate pollution | 80 – 99 | 4.0 – 4.9 |
| Probable severe pollution | < 80 | < 4.0 |
Of the 24 sites only two had MCI scores indicative of clean water in 2007. These were two native forest sites: Waipapa at Puketi forest and Waipoua at SH12, as shown in figure 29 (below). Five sites had MCI scores less than 80 in 2007 indicative of severe organic pollution: Waitangi at Watea, Mangahahuru at Apotu Rd, Mangere, Waiotu and Kaihu.
The SQMCI takes into account the number of individuals in each taxon and therefore is considered to be a more accurate reflection of stream health than the MCI. Of the 24 sites four had SQMCI scores indicative of clean water: Waipapa at Puketi forest, Waipoua, Victoria and Waitangi at Waimate, as shown in figure 30 (below). Six sites had SQMCI scores less than four in 2007 indicative of severe organic pollution: Waitangi at Watea, Mangahahuru at Apotu Rd, Waiotu, Mangakahia at Twin Bridges, Opouteke and Kaihu.
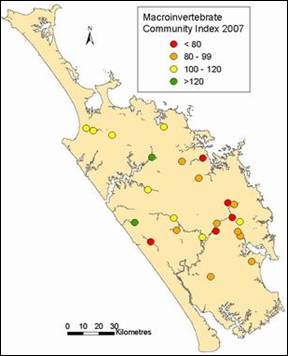
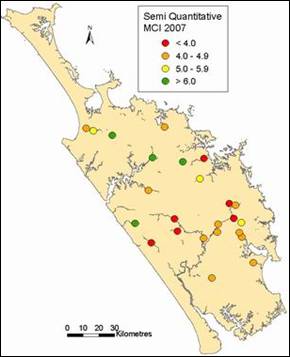
Figure 29: Macroinvertebrate Community Index (MCI) scores for the 24 RWQMN sites sampled in February and March 2007 (right). Figure 30: Semi Quantitative MCI scores for the 24 RWQMN sites sampled in 2007 (left).
Macroinvertebrate monitoring has been carried out since 1997 at most of these RWQMN sites. Of the 22 sites with sufficient data, three have shown an overall decrease in stream health during this time: Waiarohia at Whau Valley, Waiotu (only sampled since 2004) and Opouteke, while only one has shown an overall improvement in stream health during this time: Waipoua River.
Stream habitat assessments
Every second year quantitative and qualitative habitat assessments are carried out at all RWQMN sites. The qualitative assessment involves assigning scores based on aquatic habitat abundance and diversity, variation in flow (hydrologic heterogeneity), channel alteration, bank stability, percentage of shade and integrity of the riparian vegetation. The results for each of these parameters for each site is presented in table 13 in appendix C.
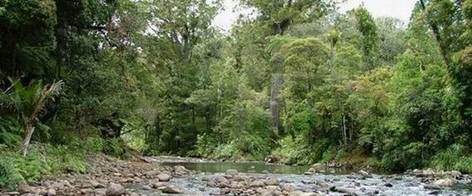
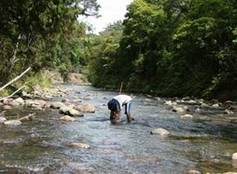
Waipoua River has optimal quality stream habitat, with mature native riparian vegetation.
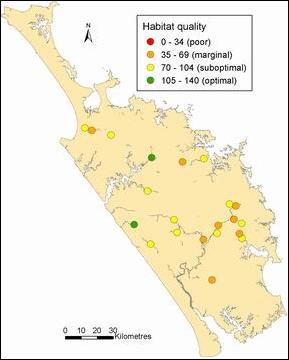 The overall habitat quality for each RWQMN site in 2007 is presented in figure 31 (right). Only two of the 21 sites have optimal stream habitat: Waipapa in Puketi forest and Waipoua River. No sites have poor habitat quality overall, although many have poor habitat for some of the parameters, particularly riparian vegetation and channel shade (see table 13 in appendix C).
For more information on the quantitative and qualitative habitat assessments refer to the full report available on the Regional Council website at the following link:
www.nrc.govt.nz/Resource-Library-Summary/Research-and-reports/Rivers-and-streams/
Figure 31: Overall stream habitat quality for the 21 RWQMN sites assessed in 2007 (right). Note: The results for Victoria and Manganui Rivers are from 2005.
Long-term trends in water quality
Trend analysis was carried out on all data for 18 of the RWQMN sites. Some of the key trends are presented below. For detailed information on the methods used and the results, see the following report available on the Regional Council website: ‘Northland River Water Quality Monitoring Network: 2006 State and Trends' (NRC 2007) at the following link:
www.nrc.govt.nz/Resource-Library-Summary/Research-and-reports/Rivers-and-streams/
Eight sites show a meaningful decrease in nitrate/nitrite nitrogen levels as shown in figure 32 (below), while the following four sites show meaningful decreasing trends in total nitrogen: Waipoua, Manganui, Mangere and Wairua at Purua as shown in figure 33 (below).
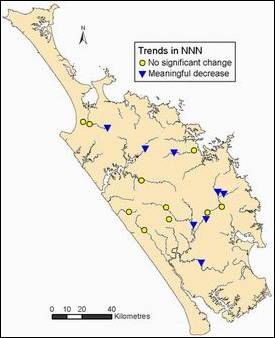
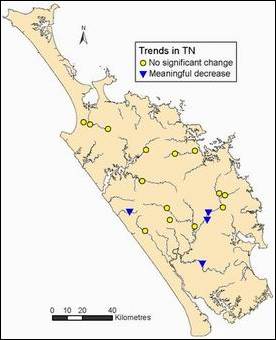
Figure 32 (left): Significant and meaningful trends in nitrate/nitrite nitrogen for all data for 18 RWQMN sites. Figure 33 (right): Significant and meaningful trends in total nitrogen for all data for 18 RWQMN sites.
Nine of the 18 sites show meaningful decreasing trends in dissolved reactive phosphorus, while two sites show meaningful increasing trends (Waipoua and Manganui Rivers) as shown in figure 34 (below). Total phosphorus exhibited meaningful decreases at six sites and meaningful increases at three sites, as shown in figure 35 (below).
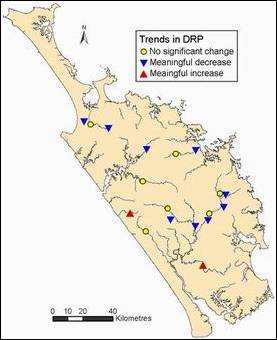
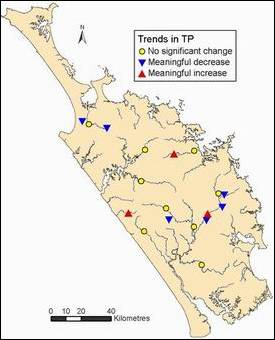
Figure 34 (left): Significant and meaningful trends in dissolved reactive phosphorus for all data for 18 RWQMN sites. Figure 35 (right): Significant and meaningful trends in total phosphorus for all data for 18 RWQMN sites.
With over 90% of the Waipoua River catchment in native forest, results suggest the slightly elevated phosphorus levels are likely to be natural, as a result of catchment geology (NRC 2007). However, it is currently unknown why the phosphorus levels have increased in Waipoua River over the last five years. This trend will be re-assessed next year and investigated further if it persists.
There were several other positive trends detected at some sites during the trend analysis such as decreasing trends in ammoniacal nitrogen at several sites and increasing trends in water clarity at three sites that had a corresponding decreasing trend for turbidity: Waipapa River, Mangahahuru at Apotu Road and Mangere Stream (NRC 2007). These positive trends for ammoniacal nitrogen and water clarity/turbidity, suggest improvements have occurred in point source discharges upstream of these sites. It is also encouraging that overall many of these positive trends were found in the rivers ranked as having the worst water quality (NRC 2007).
Other than the increasing trends in E. coli and nutrients already discussed above, the other most noteworthy negative trends found were: Increasing dissolved oxygen at five sites, increasing conductivity at three sites and increasing pH at nine sites (NRC 2007). The cause of this increasing pH is currently unknown and is not consistent with elsewhere in New Zealand. All of these negative trends will be investigated further.
Water quality for water supplies
Water quality for human drinking water
Some Northlanders in rural areas use untreated water from rivers and streams for their domestic supply – including drinking water. Based on the results from the RWQMN and recreational bathing programme there would be no rivers in Northland, including rivers in pristine native forested catchments, which have microbiological water quality that meets the NZ drinking water standard of less than 1 E. coli/100mL (MoH 2005). Note this standard is the maximum acceptable value for microbiological contamination for drinking water leaving a treatment plant. Therefore water taken directly from rivers and streams in Northland is not suitable for human drinking water without treatment.
Water quality for stock drinking water
Again based on the results from the RWQMN and recreational bathing programme very few rivers and streams have microbiological water quality that meets the guidelines for stock drinking water. We have used the most recent guideline relevant to NZ from the ANZECC guidelines (ANZECC 2000). The guideline states "drinking water for livestock should contain less than 100 thermotolerant (faecal) coliforms per 100mL (median value). The assumption has been made that the faecal coliform levels will be greater in a sample than E. coli and therefore if the median number of E. coli exceed this trigger value then it can be assumed that the number of thermotolerant coliforms would also exceed the value.
The medians of all E. coli data only meet the trigger value for four of the 37 different recreational bathing and RWQMN sites (shown in tables 2 and 4). They are Lakes Ngatu (Far North) and Taharoa (one of the Kai Iwi Lakes) and Waipoua River at SH12 and Waipapa River in Puketi Forest.