12.2 What are the pressures on streams and rivers in our region?
Point source discharges
As of 1 January 2007 there was about 1,100 discharges to water and a further 1,150 discharges to land authorised by resource consents in Northland. These have the potential to contaminate surface water and include farm dairy effluent discharges, municipal sewage discharges, stormwater and other agricultural and industrial discharges. Figures 1 and 2 (below) show the approximate number and type of consented discharges to surface water and land in Northland at 1 January 2007.
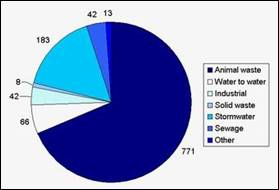
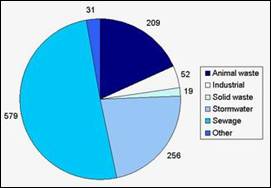
Figure 1: Type and number of discharge consents to water as at 1 January 2007 (left). Figure 2: Type and number of discharge consents to land as at 1 January 2007(right).
Although the number of consents to discharge is much high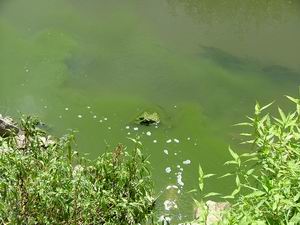 er for animal waste (predominantly farm dairy effluent), the actual volume discharged and associated contaminated load is much greater for sewage (human) discharges.
Potentially toxic blue green algae in a point source discharge from an oxidation pond treating municipal sewage (right).
The number of consents to discharge to land and surface water in Northland has steadily increased over the last 10 years as shown in figure 3 (below).
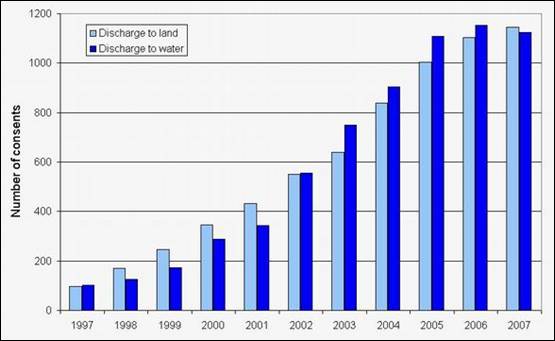
Figure 3: Number of discharge to surface water and land consents at 1 January each year.
Many of the new consents granted from 2001 to 2005 were for existing farm dairy effluent discharges.
Farm dairy effluent discharges
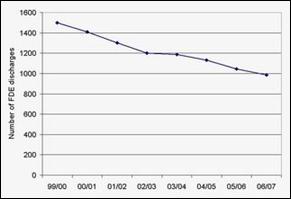 Dairy farm numbers have consistently decreased over the last seven years as shown in figure 4 (right), due to farm amalgamations for efficiency reasons and conversion to other land use such as subdivision for housing, horticulture and beef farming. A drive for higher production has in the main caused higher intensity farm practices with feed pads and imported supplementary feed resulting in increased cow numbers per hectare.
Figure 4 (Right): Approximate number of FDE discharges in Northland by milking season.
At the commencement of the 2006/07 dairy season there were 985 farm dairies in Northland. This included those milking cows for calf rearing but not supplying a milk processor. Of these, 711 were authorised by resource consent to discharge treated farm dairy effluent to water. The other 274 farms had undertaken to comply with the "Permitted Activity" criteria for land disposal (as documented by Rule 16.1 of the Regional Water and Soil Plan for Northland).
Potential adverse affects from dairy effluent discharges include:
· Increased nutrient loadings promoting nuisance biological growths.
· High ammonia levels which are toxic to fish species.
· Microbial contamination rendering the water unsuitable for human or stock drinking, contact recreation and/or shellfish collection from downstream estuaries.
· Increased suspended solids reducing water clarity and smothering aquatic life.
· Decreased oxygen concentration, which is required by aquatic life for respiration.
The objective of the Farm Dairy Effluent monitoring programme is to minimise and reduce the impacts of farm dairy effluent on water quality in Northland.
All consented farms are monitored annually. Where a discharge to water is identified, water quality field tests are done and samples taken for laboratory analysis. Non-consented farms are visually inspected annually. Monitoring is timed to coincide with seasonal peak effluent loadings.
Based on the visual inspections and water quality test results all systems are assessed and assigned a compliance category as either:
· Full compliance - Meets all the criteria for a permitted activity or complies with all the conditions of resource consent.
· Minor non-compliance - Some maintenance or improved management required.
· Significant non-compliance - Improved maintenance/management required and potential for or obvious pollution.
Where significant non-compliance is identified, NRC officers arrange on-farm meetings to discuss the non-compliance, assess options for improvement and agree on timeframes for system upgrades. Formal enforcement action is taken in cases where negligence has caused pollution or when agreed works have not been done and repeat significant non-compliance occurs.
There has been a steady improvement in compliance as demonstrated by the monitoring results from the 2003/04 to 2006/07 seasons in figure 5 (below).
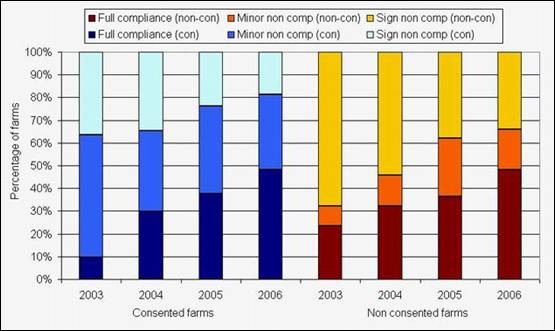
Figure 5: Percentage of compliance for both consented and non consented FDE discharges from 2003 to 2006.
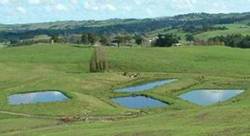
 Treatment ponds
Pond systems consist of a minimum of two ponds with the first being typically three to five metres deep and the second being shallow, normally around 1 m depth. In the first pond solids settle to the bottom and microbes digest the organic matter reducing the loading by up to 70%. The microbes in the first pond thrive in anaerobic conditions (that is, with no oxygen) and release gases such as methane and carbon dioxide. In the second pond algae produce oxygen in excess of their own requirements. Microbes use the oxygen to further breakdown the organic matter in the effluent. The microbes in the second pond thrive in aerobic conditions (that is, with oxygen).
 With increasing use of feed pads, larger herds and more cows per hectare many treatment/disposal systems have required major upgrades and high capital input. Multiple pond systems with constructed wetlands are more common. Land application from high volume treatment or storage ponds is also being widely practised. Where receiving water volumes are low, land application is the only practicable option to consistently achieve compliance.
Land application
Land application only works where the storage volume is large enough to enable effluent application to be deferred when weather and soil conditions are unsuitable.
Herd homes
About 20 farms in Northland have installed Herd HomesTM over the last few years. These consist of a slatted concrete floor over a sealed concrete basement. The homes are roofed and set up for feeding of supplements and for standoff.
The environmental benefits of the system include that the effluent is collected and stored in the basement as a semi-solid for application to land, replacing solid fertilisers and reducing nutrient run-off and leaching. There are also additional benefits associated with reduced water usage and reduction of pasture and soil damage.
Currently a similar system (Dairy YardTM) is being trialled at several dairies to replace traditional concrete holding yards, with the aim of reducing water use and effluent volumes, while increasing nutrient recycling.
Industrial discharges
Historically, industrial discharges (such as dairy factories and meat-processing industries) have been a major contributor to localised contamination of surface water quality in Northland. Some still existing industrial works were sited and constructed at a time when little importance was placed on water quality.
However, through industry amalgamations there are now few major discharges from industry to water or land in Northland and those that remain have been substantially improved over time.
As of January 2007 there were 94 consented industrial discharges in Northland, of which 52 are discharge to land consents and 42 are discharge to water consents.
Figure 6 (below) shows the percentage of site visits for industrial discharge consents in the different compliance categories of full compliance, minor and significant non-compliance. This includes stormwater discharges to both land and water from timber treatment plants and landfills. Most of the compliance monitoring for industrial discharges include self monitoring by the consent holder and audit monitoring by the Regional Council either on a quarterly or monthly basis. Minor operators are usually only monitored once a year.
The percentage of significant non-compliance increased between 2003 and 2006 but there was no significant non-compliance reported out of 163 site visits in 2006/2007.
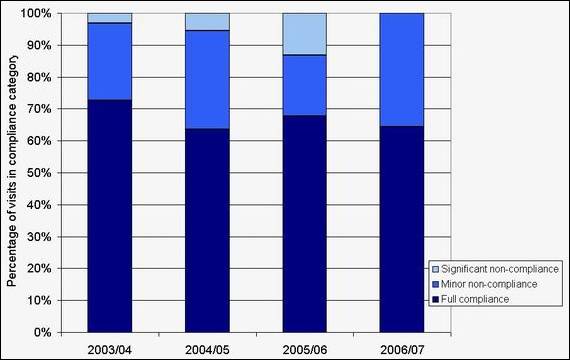
Figure 6: Percentage of site visits for industrial discharge consents in the different compliance categories of full compliance, minor and significant non-compliance.
Sewage waste discharges
The disposal of wastewater generated from Northland residents, visitors and industry places pressure on surface water resources. Inadequate wastewater management can create risks for the following:
· Public health, via contamination of recreational, food gathering and drinking waters with disease-causing microbial pathogens (including bacteria, viruses and potentially toxic algae).
· Environmental health, via discharge of nutrients and toxic chemicals.
· The local economy, via effects on commercial shell fisheries and tourism.
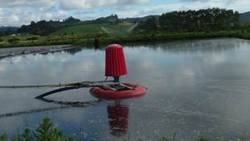
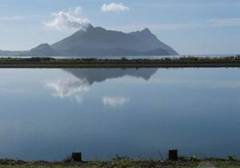 The majority of wastewater generated in Northland is collected and treated in communal wastewater treatment systems that are owned and operated by the three district councils. These systems generally consist of a sewer system, with pumps, which discharge into an oxidation pond, such as Ruakaka oxidation pond shown in the photograph (right). The treated effluent is then discharged into a wetland prior to entering natural water bodies.
These communal wastewater treatment systems range from simple pond systems such as the Kaipara District Council's Maungaturoto system, from which the discharge often contains relatively high bacterial levels of several thousand faecal coliforms to the Far North District Council's Kawakawa system which uses mechanical treatment, including disinfection, that meets the resource consent condition of less than 200 faecal coliforms on most occasions. For more information on the different systems in Northland check out table 1 (below).
Treated effluent is then discharged to land or into rivers or estuaries, with the potential for contamination of surface water. Possible effects on water quality include:
· Increased nutrient levels (leading to proliferation of algal growth).
· High bacteria numbers (increased human health risk).
· High levels of ammonia (toxic to fish).
· Lowered dissolved oxygen.
· Discoloration of surface waters.
· Degraded macroinvertebrate communities.
· Trace metals and chemical contaminants from Trade Waste Consents, which can be toxic to fish and macroinvertebrate communities.
Table 1: Municipal sewage discharges in 2007, including treatment and receiving environment of treated effluent.
| Community | Treatment method | Receiving environment |
| Far North | ||
| Ahipara | Oxidation ponds, then constructed wetland | Catchment drain |
| Awanui | Activated sludge, UV disinfection then constructed wetland | Awanui River |
| Hihi | Activated sludge, then constructed wetland | Catchment stream |
| Kaeo | Oxidation ponds, then constructed wetland | Kaeo River |
| Kaitaia | Oxidation ponds | Awanui River |
| Kaikohe | Oxidation pond, then constructed wetland | Natural wetland being a tributary of the Wairoro Stream |
| Kawakawa | Oxidation ponds, bioreactor and clarifier, sand filter and UV disinfection | Kawakawa River |
| Kerikeri | Fixed film rotating biological contactors, UV disinfection | Natural wetland, Kerikeri inlet |
| Kohukohu | Septic tank effluent collected then piped to an oxidation pond, then to constructed wetland | Hokianga Harbour |
| Opononi | Oxidation ponds, then constructed wetland | Hokianga Harbour |
| Paihia | Oxidation ponds, then to modified natural wetland | Natural wetland, Kerikeri inlet |
| Rawene | Oxidation ponds, then to constructed wetland | Hokianga Harbour |
| Russell | Treatment system, UV disinfection to deep bores | Russell Groundwater |
| Taipa | Aerated ponds then Oxidation ponds, then to constructed wetland | Catchment drain, Parapara R |
| Whatuwhiwhi | Aerated pond, wetland to dispersal drain | Karikari swampland |
| Whangarei | ||
| Hikurangi | Oxidation ponds, then constructed wetland | Mangahahuru Stream |
| Ngunguru | Oxidation ponds, then constructed wetland and UV disinfection | Unnamed stream |
| Oakura (excluding proposed expansion) | Septic tanks with up-flow rock filter and constructed wetlands | Oakura bay |
| Portland | Oxidation ponds, wetland | Tokotoki creek, Whangarei H. |
| Rangiputa | Oxidation ponds to ground via soakage pond | Lake Rotokawau catchment |
| Ruakaka | Oxidation ponds, then constructed wetlands | Land (sandhills) |
| Tutukaka | Recirculating sand filter system denitrification and, UV disinfection | Trib of Tutukaka Harbour |
| Waipu | Aerated pond, then constructed wetland | Land (sandhills) |
| Whangarei | Trickling Filters, Activated sludge, filtration with disinfection, then to constructed wetland | Limeburners Creek, Whangarei Harbour |
| Kaipara | ||
| Kaiwaka | Aerated ponds, then to wetland | Kaiwaka River |
| Mangawhai (proposed) | Activated sludge with filtration and disinfection, then to storage ponds. | Irrigation on farm land. |
| Maungaturoto | Aerated pond | Otamatea estuary, Kaipara H. |
| Te Kopuru | Aerated pond, then constructed wetlands | Wairoa R, Kaipara Harbour |
| Dargaville | Aerated pond, then constructed wetland | Wairoa R, Kaipara Harbour |
Over recent years there has been a trend of increasing the level of treatment including disinfection to deal with pathogens entering into water.
Figure 7 (below) shows the percentage of site visits for sewage discharge consents in the different compliance categories of full compliance, minor and significant non-compliance. This includes sewage discharges to land and water from domestic on-site, communal and municipal systems. The municipal sewage discharge consent compliance monitoring include self monitoring by the consent holder and audit monitoring by the Regional Council either on a quarterly or monthly basis, while communal systems for small communities, marae, schools, camping grounds, cafes and motels are monitored every one to three years at the time of peak loads. Domestic on-site systems for households are usually only inspected once, after being in operation for one to two years.
The compliance rate for site visits for sewage discharge consents has remained reasonably static over the last four years, with the percentage of site visits reported as significantly non-compliant ranging from 2.5% in 2005/2006 to 6.7% in both 2003/2004 and 2004/2005, as shown in figure 7 (below).
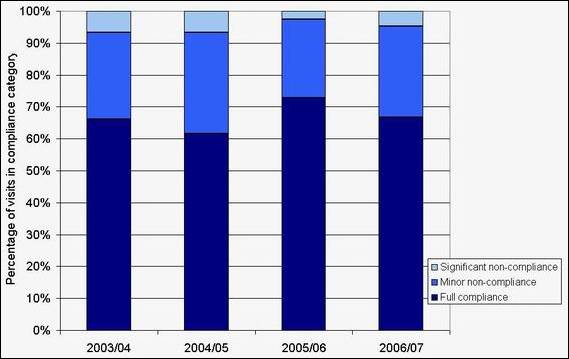
Figure 7: Percentage of site visits for sewage discharge consents in the different compliance categories of full compliance, minor and significant non-compliance.
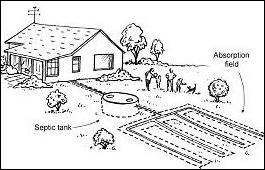 A significant proportion of domestic wastewater, particularly in the Far North and Kaipara District, is discharged "on-site" on individual properties. It is estimated that there are approximately 20,000 on-site systems in Northland, servicing around 30% of the population. The majority of onsite systems involve septic tanks and soakage fields, although there has been a recent trend to use more advanced treatment systems which produce a better effluent quality.
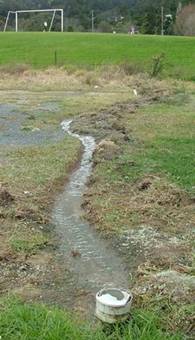
If properly maintained, the environmental effects of septic tanks are usually minimal. However, potential problems exist where the density of septic tanks is high, or where effluent soakage is poor or excessive. There are some coastal areas where sandy soils allow effluent to contaminate groundwater. Areas with clay soils or hard pans may prevent adequate soakage, resulting in surface discharges and effluent runoff.
 As of 1 January 2007 there were 620 wastewater discharges authorised by Northland Regional Council resource consent, 93% of those discharges being to land and the remaining 7% to water. The vast majority of onsite wastewater discharges are covered by the permitted activity rules of the RWSP.
A number of resource consents have been issued in recent years to provide for wastewater discharges from subdivisions where the wastewater is treated and disposed of collectively. A number of these subdivisions have allowed development to occur in areas prior to provision of reticulated sewerage services (e.g. Mangawhai and Ruakaka).
In the last five years the Council has recorded 432 incidents associated with sewage spills in addition to non-compliance issues associated with consented discharges.
The incidents have ranged from break down of major sewage pump stations or pipes through to failure of individual on-site systems. During this same period the Council has undertaken formal enforcement on 32 occasions to address wastewater issues.
Stormwater
When it rains stormwater run-off picks up and carries many different contaminants that have accumulated during dry periods on roads, car parks, footpaths and roofs, usually without – or with very little – treatment into nearby streams, rivers or estuaries. This includes contaminants such as trace metals, hydrocarbons, nutrients, sediment and pathogens from faecal material.
Many people are not aware that stormwater is often discharged directly to our water bodies without treatment. It is not uncommon for car washing detergents, paints and other products to get washed directly into stormwater systems. Even a very small quantity of some pollutants in stormwater can drastically alter the quality of a stream. Fish, insects and plant life can be killed and habitats destroyed.
Stormwater discharges for urban areas are typically authorised by discharge consents based on a stormwater management plan. These management plans have historically tended to focus on the capacity of the stormwater system to receive runoff, with little attention given to stormwater quality.
As of 1 January 2007 there were approximately 440 stormwater consented discharges in Northland, of which 58% were for discharges to land. These include discharge consents for urban areas, industrial sites and quarries as well as shorter term discharge consents for earthworks associated with subdivision development, forest clearing and road works. The discharge consents for quarries and earthworks are at least 60% of the 440 stormwater consents, with the main pressure from these consents being erosion and sediment run-off.
Compliance monitoring for stormwater discharge consents held by the District Councils for urban areas, includes self-monitoring by the District Councils and audit monitoring by the Regional Council one to four times a year. All monitoring is carried out in first flush events. Figure 8 (below) shows the percentage of Regional Council site visits for urban stormwater discharge consents in the different compliance categories of full compliance, minor and significant non-compliance.
The percentage of significant non-compliance has increased over the last three years for stormwater discharges, as shown in figure 8 (below). However, this is likely to be related to the increase in audit monitoring by the Regional Council (the number of site visits per year has almost doubled in the last four years), which has increased the opportunity of detecting significant non-compliance.
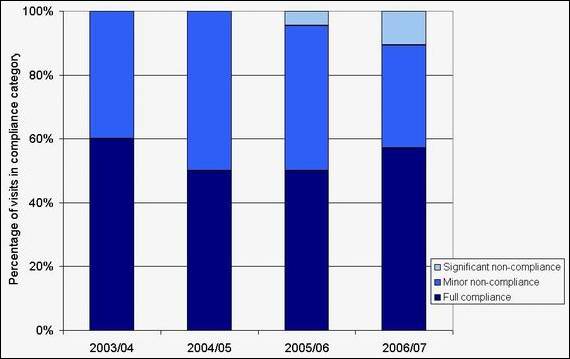
Figure 8: Percentage of site visits for stormwater discharge consents in the different compliance categories of full compliance, minor and significant non-compliance.
For more information on stormwater monitoring, check out case study 1 in this chapter.
Diffuse surface run off
Non-point source discharges are diffuse sources of contaminants that originate from large areas of land, and cannot be traced to one single fixed point of origin. Non-point source pollution occurs when rainfall washes animal excreta, sediments, nutrients and other pollutants from the surface of the land into streams, rivers and lakes. Pollution of groundwater can also occur when contaminants are leached through the soil into groundwater. Non-point source discharges include:
· Stormwater runoff (not pipe outlets).
· Sediment from earthworks and vegetation clearance.
· Stock excreta.
· Residue from fertiliser and agrichemicals.
· Leachate from contaminated sites.
· On-site wastewater systems.
Most non-point source discharges don't require or have resource consent. Of those that do require resource consent, such as quarries, significant earthworks and vegetation clearance. With the application of the TP90 erosion and sediment control guidelines (ARC 1999) in Northland, the diffuse surface run-off from many of these sites is collected into ponds and discharged from a particular point, therefore becoming a point source discharge. These are mostly consented activities, for which compliance is presented below.
Figure 9 (below) shows the percentage of site visits for land use consents in the different compliance categories of full compliance, minor and significant non-compliance. This includes consents for vegetation clearance, earthworks, quarries and bridge/culvert construction. As discussed above, these consents, in most cases, involves the collection of diffuse surface run-off for treatment, thus leading to a point source discharge.
Compliance monitoring for forest harvesting, roading and stripping is done once or twice a year based on the activities. For example, harvesting is usually monitored in winter, while stripping is monitored in summer. Compliance monitoring for quarries is one to two times a year, while compliance monitoring for earthworks and bridge/culvert construction depends on the activity but is usually once or twice while the work is being carried out and a final inspection at the completion of the work.
The percentage of significant non-compliance has decreased over the last four years for land use consents, as shown in figure 9 (below). This is likely to be due to an increase in environmental awareness among consent holders, forestry companies and earthworks operators, as a result of the Regional Council taking formal enforcement action on non-compliance and education through workshops, field days and site visits.
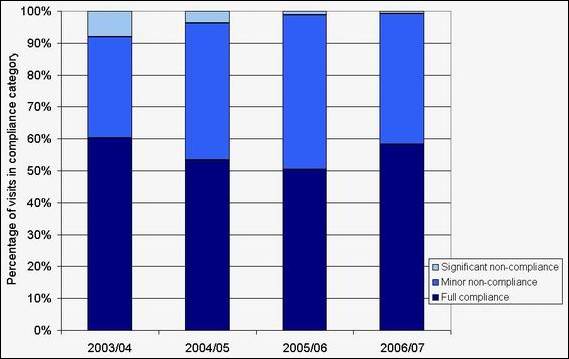
Figure 9: Percentage of site visits for land use consents in the different compliance categories of full compliance, minor and significant non-compliance.
Agricultural land use
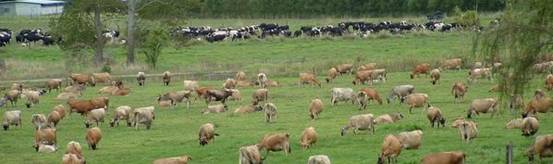
 Approximately 50% of land in Northland is in pastoral land use (Land Cover Database, 2002) and presumably grazed by stock. As a result agriculture is the most significant source of non-point source pollution. Major contaminants of concern include:
· Organic matter (sourced from faecal contamination).
· Sediment (as a result of deforested slopes converted to pasture and bare land).
· Nutrients (sourced from dung and urine, excess fertiliser).
· Pathogens (disease-causing organisms sourced from dung and urine).
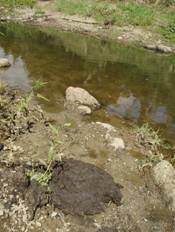
These are largely washed off the land during rainfall, but direct livestock access to streams can also degrade water quality by both damaging stream banks and directly excreting in waterways.
Beef and dairy cattle farming are a major component of the Northland agricultural base, with around 869,000 head of stock at June 2006 (Statistics New Zealand, 2006). Dung and urine from livestock are a major source of nutrients (nitrogen and phosphorous), pathogens and oxygen-consuming organic matter. Stock numbers provide an indication of the effluent loading into surface water.
As shown in figure 10 (below), total numbers of sheep decreased significantly from about 1.3 million in 1990 to 522,000 in 2002. Since 2002 the sheep numbers have fluctuated around 520,000. The trend for beef cattle numbers is not quite so obvious. There have been several small increases and decreases in beef cattle numbers over the last 16 years with an overall decrease of about 100,000. However, beef cattle numbers have actually been on the increase for the last two years.
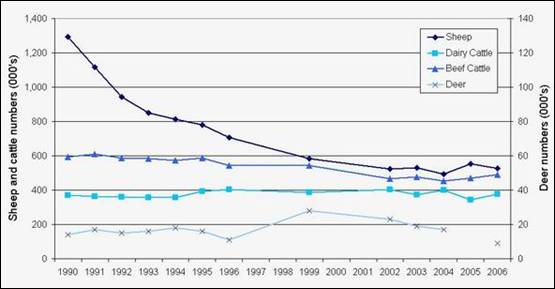
Figure 10: Livestock numbers (000's) from 1990 to 2006, including sheep, dairy and beef cattle (left axis) and deer (right axis).
Deer numbers peaked in 1999 at 28,000 and have since dropped to 9,000 on 30 June 2006, the lowest numbers since 1990.
As discussed in the farm dairy effluent section, the number of dairy farms in Northland has decreased over the last eight years. However, this is not the case for the number of dairy cows. Unfortunately there are some gaps in the data between 1996 and 2002 but there is no obvious trend in dairy cattle numbers in Northland for the last 10 years, fluctuating between 343,000 and 405,000. In recent years there has been a trend towards fewer herds, but with larger herd sizes and therefore increased localised concentrations in livestock numbers.
Greater numbers of livestock per hectare can lead to greater dung and urine loading on pasture with an increased possibility for organic matter, nutrients and pathogens to enter surface and groundwater.
Fertiliser application also poses a threat to surface water quality if applied incorrectly. If excess fertiliser is applied the nutrients not taken up by plants can easily leach into ground and surface water. Fertiliser usage in Northland has fluctuated over the last five years. For example, 216,000 tonnes of urea, lime and Diammonium phosphate (DAP) was applied in Northland in 2004 compared to 235,000 tonnes (of urea, lime and DAP) applied in 2002 (Statistics NZ).
For more information on fertiliser usage in Northland check out the Land and Soils chapter.
Most of Northland's lowland rivers typically exhibit elevated levels of phosphorous and nitrogen. All river water quality monitoring network sites with catchments dominated by agricultural land use often have elevated nutrient levels. These sites are shown to the right of figure 11 (below). The percentage of each land use type with the total catchment area for each Regional Water Quality Monitoring Network (RWQMN) site is presented in table 9 in appendix A.
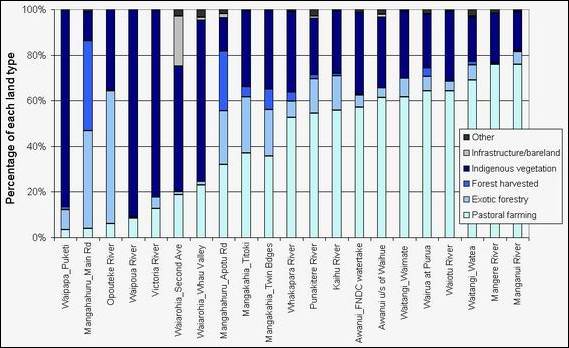
Figure 11: Percentage of different land use types for the RWQMN sites.
The results from a survey of spray contractors and horticulturalists in Northland in 2007 were used to assess the risk of surface water in Northland being contaminated with agrichemicals (pesticides and herbicides). The limited results found that there is a localised but high risk of surface water potentially being contaminated with some agrichemicals, in some areas of Northland (Stewart 2008). The report recommends initial sampling that targets surface water at high risk of contamination to determine the extent of the problem and whether a long term routine monitoring programme is required.
The detailed report "A Risk Assessment of potential contamination of Surface Water by Agrichemicals in Northland" is available on the Regional Council website at the following link:
http://www.nrc.govt.nz/Resource-Library-Summary/Research-and-reports/Rivers-and-streams/
Environmental incidents
Environmental incidents – such as oil or sewage spills, contaminated stormwater, illegal water takes or dead stock – can have a detrimental impact on surface water quality in Northland. The regional council has operated a 24/7 Environmental Hotline service since November 1993, where people can report environmental pollution.
The number of incidents reported to the council affecting inland waters and their recorded impact on the environment is shown in figure 12 (below). The numbers of incidents was highest in 1994 and 1995, decreasing from 1996 to 2002 and has been increasing since 2003, with 266 incidents being reported to the council in 2006. Every year less than 20% of the incidents are recorded as having a significant or large impact on the environment.
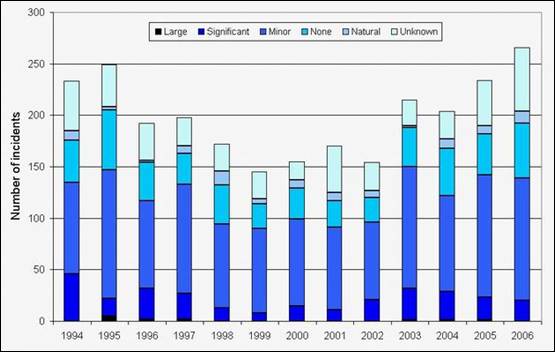
Figure 12: Number of environmental incidents affecting inland waters and their impact on the environment.
This more recent increase in the number of incidents being reported to the council is most likely as a result of a combination of factors such as an increased awareness of environmental quality by the public and increased development, including higher intensity farming and subdivision developments. This can be seen in figure 13 (below), with an increase in the proportion of stormwater and other contaminated discharge incidents over the last three years and an increase in the proportion of earthworks and vegetation clearance incidents over the last five years.
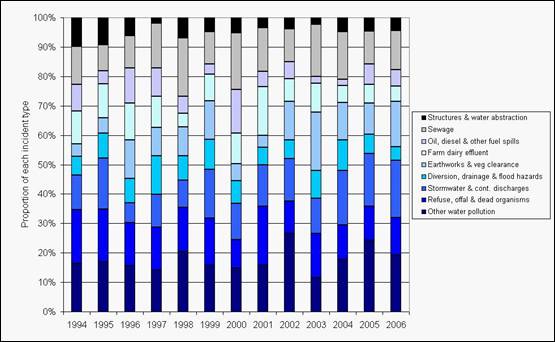
Figure 13: Proportion of the different types of environmental incidents affecting inland waters.
Climate change
In August 2006, the National Institute of Water and Atmospheric Research Ltd (NIWA) carried out a comprehensive assessment on the impact of climate change and climate variability on Northland's water resources based on all available literature. The assessment considered natural climate variability in the Northland region and the potential effects of predicted climate changes over the next 50 to 80 years.
The main points of the assessment were:
· All predictions suggest an increase in temperature, particularly during the winter.
· Overall annual rainfall may not change. However, rainfall trends for the next 30 to 80 years are for increased dry periods (droughts) and more frequent high-intensity rainfall events (floods).
· The influence of a potential increase in droughts causing more frequent, extended and more significant low flow events in our rivers and the effect on water quality and freshwater ecosystems.
· The effect of more frequent and intense rainfall events on erosion, affecting water quality and freshwater ecosystems.
Additional work is required to assess the potential effects of increased drought frequencies and extreme rainfall events on surface water flows such as the environmental response to increased low flows and increased sediment loadings as a result of more extreme rainfall events.