8.7 Case study 1: Whangaroa Harbour Study
An investigation was established in the Whangaroa Harbour in 2003 to identify faecal contamination in the harbour and sources of this contamination. Historically the closure criteria for the operation of the marine farms was brought into question as a result of high results during normal sampling by Northland Health on behalf of the oyster farmers and the New Zealand Food Safety Authority. Frequent events of bacterial contamination were occurring when they were not expected, threatening the operating classification of the harbour for commercial growing of oysters.
In July 2003 a sampling programme was developed which included 12 sites around the harbour, five sites in the Kaeo River catchment and five sites at the mouth of other freshwater inputs to the harbour. These are marked with a circle in figure 23 (below). These 22 sites were sampled monthly for physio-chemical and microbiological parameters. The five sites within the Kaeo River catchment were sampled to establish a data profile up the catchment, to determine likely contamination sources.
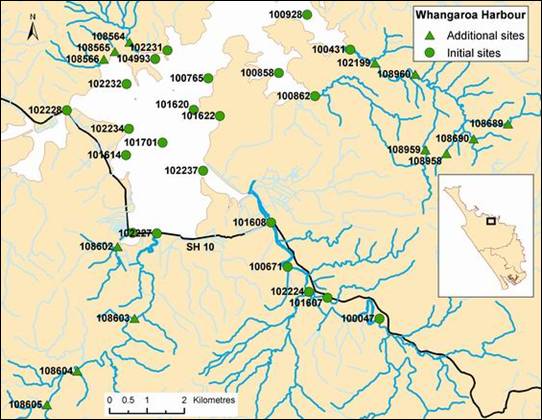
Figure 23: Sampling sites included in the Whangaroa Harbour study.
In October 2005 this data was reviewed and it was found that microbiological water quality deteriorated as you moved down the Kaeo River catchment, as shown in figure 24 (below).
The worst site was below the Kaeo Wastewater treatment plant (site 100671) with a median E. coli level of 932/100ml as shown in table 10 (below). However microbiological water quality was also impacted above the Kaeo township. The most likely source is faecal contamination carried in surface runoff from agricultural farming and where stock have access to the river. Faecal contamination from septic tanks and feral animals is also a possibility.
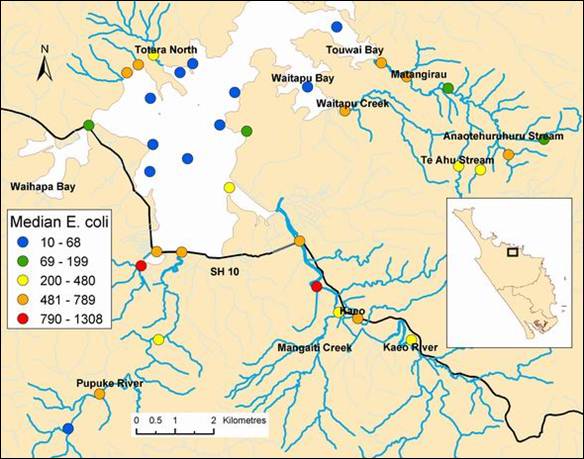
Figure 24: Median E. coli (n/100mL) results at Whangaroa Harbour study sites. Note: Results also available in table 10 (below).
This highlighted that there are several sources of faecal contamination in the Kaeo River and that the cumulative effects of these different sources as you move down the catchment is leading to elevated bacterial levels entering the Whangaroa Harbour, particularly after heavy rain.
Meetings have been held with key stakeholders to follow up on the findings of this initial sampling, including Far North District Council, Northland Regional Council, Department of Conservation, landowners, Te Rununga O Whangaroa, Federated Farmers, Northland Health and stakeholders from the marine farming industry. Key areas identified as requiring action were the discharge consent for Kaeo's treated wastewater, onsite disposal systems, land management of stock access to waterways and farm dairy effluent discharges, boat pump-out and dumping facilities, pest control and shellfish harvest management.
Table 10: Median E. coli (n/100mL), turbidity (ntu), proportion of freshwater (%) and number of samples for all sites in the Whangaroa Harbour study. Note: Median E. coli results also shown in figure 24 (above).
| Site | Description | Median E. coli | Median turbidity | Median % freshwater | Sample number |
| 100765 | North of Whangaroa marina | 10 | 3.4 | 2.0 | 42 |
| 100858 | Middle of Waitapu Bay | 10 | 4.0 | 1.7 | 42 |
| 100928 | Midway of Touwai Bay | 10 | 3.2 | 2.6 | 42 |
| 101620 | North corner of marine farm | 10 | 4.8 | 2.6 | 42 |
| 101701 | South corner of marine farm | 10 | 7.1 | 5.4 | 42 |
| 102231 | Totara North jetty | 10 | 4.7 | 2.9 | 39 |
| 101614 | Near Waitaruke drain outflow | 31 | 8.8 | 4.3 | 42 |
| 102234 | Ferguson Point | 31 | 9.8 | 3.4 | 42 |
| 104993 | Middle of Lane Mill Bay | 31 | 5.6 | 2.9 | 42 |
| 102232 | West of Cape Horn | 41 | 8.5 | 5.4 | 42 |
| 108605 | Pupuke River at culvert beside road | 68 | 4.2 | 99.9 | 16 |
| 102228 | Entrance of Waihapa Bay | 109 | 11.4 | 8.9 | 43 |
| 108689 | Headwaters of Anaotehuruhuru Strm | 115 | 7.4 | 99.9 | 8 |
| 101622 | Whangaroa Rd culvert before turnoff | 166 | 6.8 | 47.4 | 40 |
| 108960 | Touwai Strm at Matangirau School Rd | 199 | 4.1 | 99.9 | 8 |
| 108564 | Unnamed trib near Campbell Rd | 347 | 6.1 | 64.9 | 18 |
| 102224 | Mangaiti Stream at Dip Rd | 400 | 6.1 | 99.7 | 26 |
| 100047 | Kaeo River at Green Lane | 428 | 4.3 | 99.7 | 25 |
| 102237 | Near Kaeo River mouth | 434 | 11.3 | 82.0 | 26 |
| 108959 | Headwaters of Te Ahu Stream | 472 | 5.2 | 99.9 | 8 |
| 108958 | Whakare Stream at Huia Road | 477 | 7.5 | 99.9 | 8 |
| 108603 | Pupuke River at Weber Rd footbridge | 480 | 4.6 | 99.9 | 16 |
| 100431 | Touwai Stream near stream mouth | 547 | 4.8 | 80.0 | 43 |
| 108690 | Headwaters of Whakare Stream | 552 | 6.4 | 99.9 | 8 |
| 101608 | Kaeo River at SH 10 bridge | 559 | 8.4 | 96.0 | 26 |
| 108604 | Pupuke River at Mangapa Rd bridge | 562 | 3.4 | 99.9 | 16 |
| 102199 | Touwai Stream at Wainui Rd bridge | 594 | 4.5 | 98.6 | 8 |
| 100862 | Waitapu creek below road bridge | 598 | 7.8 | 50.3 | 43 |
| 102227 | Pupuke River at SH 10 bridge | 613 | 9.2 | 75.1 | 43 |
| 108565 | Unnamed trib at Totara School Rd | 635 | 9.1 | 20.0 | 18 |
| 101607 | Kaeo River below fire station | 679 | 5.3 | 99.7 | 26 |
| 100436 | SH 10 Bridge at Weber Rd | 695 | 10.8 | 40.3 | 43 |
| 108566 | Unnamed trib at Gangway Rd | 789 | 7.6 | 97.1 | 18 |
| 100671 | D/strm of Kaeo Sewage discharge | 932 | 7.7 | 99.7 | 25 |
| 108602 | Unnamed trib at Weber Rd | 1308 | 6.8 | 34.9 | 16 |
Following these findings, sampling on the Kaeo River ceased in October 2005 and sampling efforts were shifted to other contributing catchments of the Whangaroa Harbour. This includes 33 sites on the Pupuke River, Touwai Stream, Waitapu Creek and small tributaries in the Totara North area, marked by a triangle in figure 23 (above). The initial results for these sites show there are some areas of concern in terms of faecal contamination. For example the unnamed tributary that flows into the upper Whangaroa Harbour by Weber Road (sites 108602 and 100436), Waitapu Creek (site 100862) and two unnamed tributaries in Totara North (sites 108566 and 108565).
An analysis was carried out to see if there was any relationship between turbidity or salinity and E. coli levels. No relationship was found between turbidity and E. coli as shown in figure 25 (below).
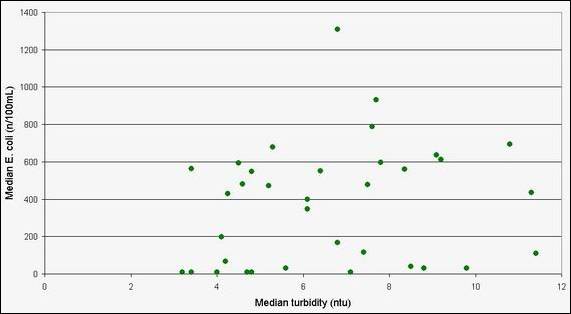
Figure 25: Median turbidity (ntu) against median E. coli (n/100ml) for all Whangaroa Harbour study sampling sites.
However, there appears to be a relationship between E. coli levels and the proportion of freshwater, as shown in figure 26 (below). The trend line in figure 26 has been fitted to the ‘normal sites' dataset (shown in green) which has an equation of y=5.58x0.99 (R2=0.93). This shows that higher E. coli levels tend to be associated with freshwater sites, while lower E. coli levels with saline sites.
There are a few exceptions to this trend, which are shown in red and blue in figure 26. The two sites shown in blue (108605 and 108689) have reasonably low E. coli levels and are both headwater sites. Their surrounding and upstream land use is predominantly native shrub and low intensity farming and therefore there are limited sources for faecal contamination.
At the other end of the scale, the sites shown in red have relatively high E. coli levels considering the low proportion of freshwater at these sites. This includes the unnamed tributary that flows into the upper Whangaroa Harbour by Weber Road (sites 108602 and 100436), Waitapu Creek (site 100862) and an unnamed tributary in Totara North (site 108565).
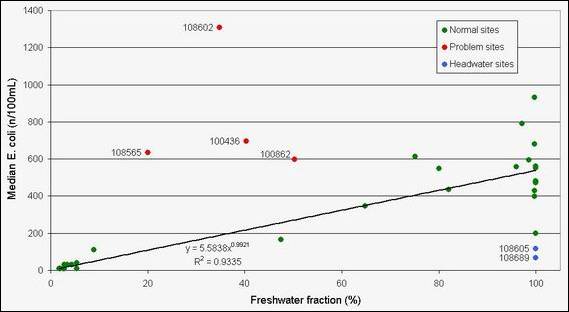
Figure 26: Median freshwater fraction (%) against median E. coli (n/100ml) for all Whangaroa Harbour study sampling sites.
These problem sites will be investigated further in the future. Other microbial tracking methods will be used to assist with identifying the source of contamination such as testing for fluorescent whitening agents, which originate from laundry detergents and is an indication of the presence of human wastewater, and possibly faecal sterols, which can narrow the source of the contamination to humans, herbivores or other.
In summary, the Whangaroa Harbour sampling to date has shown that the Kaeo River is a significant source of faecal contamination to the Harbour and that the sources of this contamination are varied and cumulative as you move down the catchment. Key stakeholders are currently working together to improve water quality in the Kaeo River. Sampling will continue in other catchments of the Whangaroa Harbour to identify other sources of faecal contamination.