Compliance assessments 2010-2011
Monitoring requirements are different for each consented activity and are based on how long the activity lasts, the scale of the activity and the potential for it to adversely affect the environment.
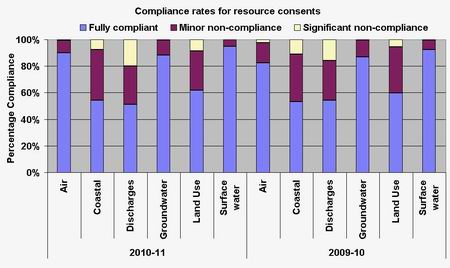
In 2010-2011, 3533 monitoring visits were made by regional council staff. The graph below breaks these monitoring visits into the consented activity by type, and compares compliance rates to 2009-2010.
Compliance assessment results
Activities with the highest rate of significant non-compliance were those relating to the discharge of a contaminant into the environment – including farm dairy effluent. Coastal activities had the second highest rate of significant non-compliance.
Significant non-compliance in relation to coastal activities was due to aquaculture and the condition of oyster farms in some harbours. This situation is being addressed by a central government initiative.
Coastal structures requiring maintenance also contributed to the instances of significant coastal non-compliance. The third highest rate of significant non-compliance was for land-use activities and includes earthworks undertaken without adequate sediment controls.