Results 2010-2011
Within this section…
Results of the monitoring programmes are assessed against water quality standards outlined in the Northland Regional Coastal Plan (RCP), the Australian and New Zealand Guidelines for Fresh and Marine Water Quality (ANZECC) and the Ministry for the Environment (MfE) Microbiological Water Quality Guidelines.
Bay of Islands
In general, low levels of Enterococci were recorded at sites in the Bay of Islands Harbour. A high percentage of samples were also within guideline values for both dissolved oxygen and turbidity (Figure 2).
However, a high percentage of samples were above guideline values for nutrients, particularly nitrite-nitrate nitrogen and dissolved reactive phosphorus. Samples collected from sites close to freshwater inputs – such as the Kawakawa River, Kerikeri River, Waitangi River and Waipapa River – were more frequently above guideline values than samples collected from more open water.
Click the image below to view a larger version in pdf format (284 kb)
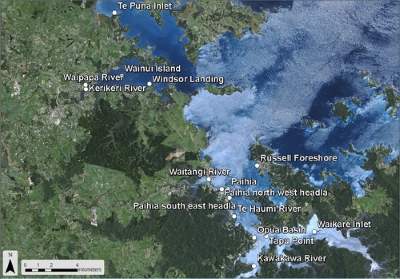 Figure 1: Location of water quality monitoring sites in Bay of Islands 2010-2011.
Physical properties
There was lower compliance this year of dissolved oxygen levels – 83 percent compared to 100 percent in 2009-2010 (Figure 2) (possibly due to a higher number of storms that contributed organic material to the sea. This material degrades naturally over time but the process uses oxygen from our waters to do so.)
Turbidity levels improved with 90 percent of samples collected during 2010-2011 within the guideline value, compared to 79 percent in 2009-2010. It is unknown why turbidity levels have improved in 2010-2011 compared to the 2009-2010 drought year.
Bacteria
More storms and rainfall in 2010-2011 increased the amount of runoff in catchments so a lower compliance level of Enterococci – 90 percent compared to 96 percent in 2009-2010 (Figure 2) – was due to increased inputs. Samples with levels of bacteria above the guideline values were collected after rainfall events.
Nutrients
Samples within guideline values during 2010-2011 were:
· 52 percent of dissolved reactive phosphorus;
· 67 percent of ammonium;
· 85 percent total phosphorus; and
· 33 percent of nitrite-nitrate nitrogen samples
Sites where water samples were above the guideline values for ammonium and nitrite-nitrate nitrogen included the Kawakawa, Waipapa, Waitangi and Kerikeri Rivers, the Opua Basin and Paihia.
Sites where water samples were above the guideline value for total phosphorus included the Kawakawa River, Waikare Inlet, Te Haumi River and Windsor Landing. Poorest water quality was associated with runoff from rural catchments into estuaries.
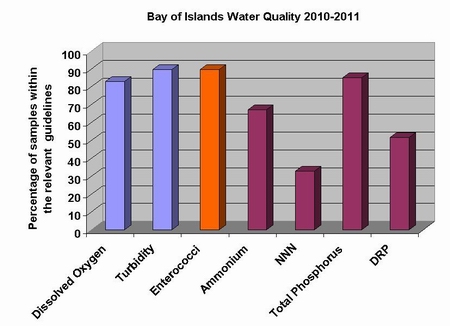
Figure 2: Percentage of water samples collected from Bay of Islands within guideline values in 2010-2011.
Whāngārei Harbour
In general, samples collected from sites in the Hātea River – particularly between the Town Basin and Kissing Point – were more frequently above guideline values than those collected from the outer harbour, from One Tree Point to Mair Bank.
Levels of nutrients were high and above the nutrient guideline values on all sampling occasions from five sites in the Hātea River. Water samples collected from these sites were also above the guideline for bacteria more frequently than samples taken from sites in the outer harbour.
Click the image below to view a larger version in pdf format (236 kb)
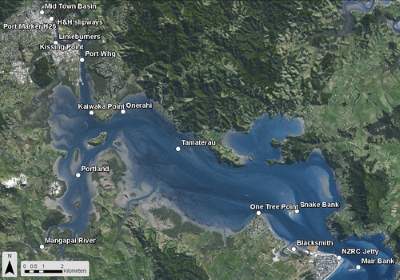 Figure 3: Location of water quality monitoring sites in Whāngārei Harbour in 2010-2011.
Physical properties
Overall, 91 percent of samples collected were within the guideline value for dissolved oxygen during 2010-2011 (figure 4), compared to 88 percent in 2009-2010.
Samples collected from sites in the Hātea River (upper harbour) were less likely to meet the guideline values for dissolved oxygen and turbidity than samples collected from the outer harbour due to inputs from both urban and rural areas. For turbidity, 85 percent of samples collected during 2010-2011 were within the guideline value, compared to 95 percent in 2009-2010.
Bacteria
Eighty-seven percent of samples collected during 2010-2011 were within the guideline value for Enterococci bacteria (figure 4), compared to 96 percent in 2009-2010. Samples with levels of bacteria outside of the guideline values were typically collected after rainfall events.
Nutrients
Levels of nutrients in the Whāngārei harbour were high (figure 4):
· 44 percent of samples collected were within the guideline values for total phosphorus;
· 25 percent of dissolved reactive phosphorus samples;
· 45 percent of ammonium samples; and
· 31 percent of nitrite-nitrate nitrogen samples were within the guideline values.
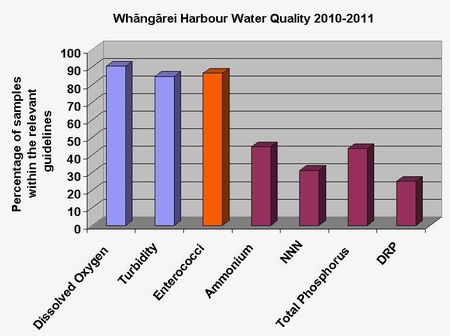
Figure 4: Percentage of water samples collected from Whāngārei Harbour within guideline values in 2010-2011.
Kaipara Harbour
In general, samples collected from sites near freshwater inflows – particularly Burgess Island, Kaupau Point and Wahiwaka Creek – more frequently exceeded the guideline values than samples collected from the outer harbour (Tamatea Channel, ŌRuawharo River and Five Fathom Channel). This was particularly apparent for nutrients.
Physical properties
Overall 92 percent of samples collected were within the guideline value for dissolved oxygen in 2010-2011 (figure 6) compared to 100 percent in 2009-2010.
For turbidity, 89 percent of samples collected during 2010-2011 were within the guideline value, compared to 92 percent in 2009-2010.
Click the image below to view a larger version in pdf format (219 kb)
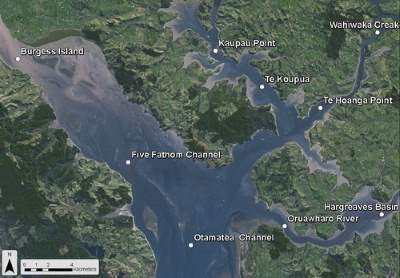 Figure 5: Location of water quality monitoring sites in Kaipara Harbour in 2010-2011.
Bacteria
Of samples collected from the harbour during 2010-2011, 98 percent were within the guideline value for Enterococci (figure 6), compared to 97 percent in 2009-2010.
Wahiwaka Creek was the only site to record levels of bacteria above the guideline.
Nutrients
In 2010-2011:
· 53 percent of samples collected from the harbour were within the guideline value for total phosphorus – compared to 53 percent in 2009-2010;
· 23 percent were within the guideline for dissolved reactive phosphorus;
· 43 percent for ammonium; and
· 44 percent for nitrite-nitrate nitrogen.
The highest levels of nutrients were recorded at Wahiwaka Creek, Kapua Point and Burgess Island.
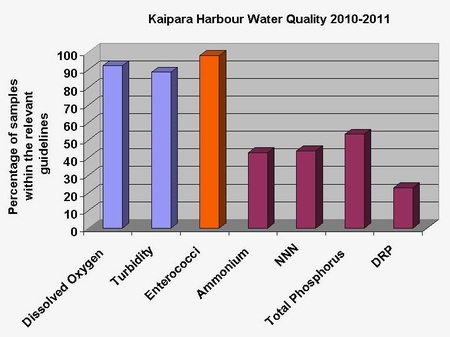
Figure 6: Percentage of water samples collected from Kaipara Harbour within guideline values in 2010-2011.
Case Study – Whāngārei Harbour
The council has conducted water quality monitoring in the Whāngārei Harbour since 1990. A recent review of this data and other historical data recorded in the Whāngārei Harbour showed:
· A decreasing trend in faecal coliform levels at eight sites in the Hātea River, with the biggest decrease recorded at three sites near Limeburners Creek between 1986 and 1991. This is most likely due to the major upgrade of the main wastewater treatment plant.
· Enterococci peak levels show a decrease over time, which is likely to be as a result of further improvements in the wastewater treatment plant; and
· The recent recovery of seagrass also suggests that water clarity and turbidity levels have significantly improved in the mid to outer harbour.
Levels of nutrients have only been measured since 2008 and so there is currently insufficient data to investigate any changes in these parameters over time.