Compliance assessments 2009-2010
Within this section…
Monitoring requirements are different for each consented activity and are based on how long the activity lasts, the scale of the activity and the potential for it to adversely affect the environment.
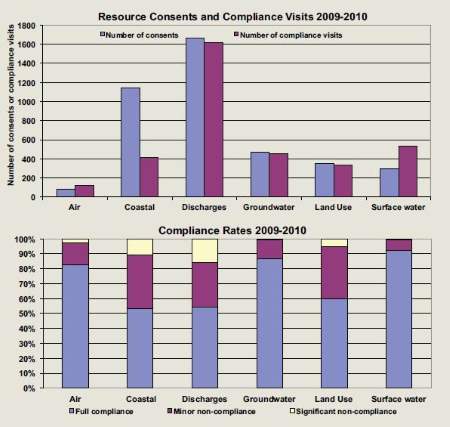
In 2009-2010, 3482 monitoring visits were made by Regional Council staff. This was 698 more than 2008-09. The graph below breaks these monitoring visits down into the consented activity by type. The number of monitoring visits undertaken for each activity largely reflects the number of consents issued for that activity.
Compliance assessment results
Activities with the highest rate of significant non-compliance were those relating to the discharge of a contaminant into the environment (including farm dairy effluent). Coastal activities had the second highest rate of significant non-compliance. Significant non-compliance in relation to coastal activities could include a structure that is not the consented size. The third highest rate of significant non-compliance was for land-use activities and includes earthworks undertaken without sediment control.