Results 2009-2010
Within this section…
Results from the monitoring programme are assessed against the water quality standards outlined in the Northland Regional Coastal Plan (RCP), the Australian and New Zealand Guidelines for Fresh and Marine Water Quality (ANZECC guidelines) and the Ministry for the Environment (MfE) Microbiological Water Quality Guidelines as follows:
|
Parameter |
Units |
Guideline value/range |
|
Dissolved Oxygen (DO) |
% Saturation |
80 |
|
Turbidity |
NTU |
5-10 |
|
Faecal Coliform |
MPN/100mL |
<150 |
|
E. coli |
MPN/100mL |
260 |
|
Enterococci |
n/100mL |
140 |
|
Ammonia |
mg/L |
0.015 |
|
Total phosphorus (TP) |
g/m3 |
0.03 |
|
Total nitrogen (TN) |
g/m3 |
0.3 |
MPN = most probable number; NTU = Nephelometric Turbidity Units
Bay of Islands
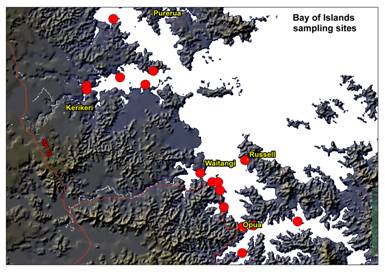
Map: Bay of Islands sampling sites
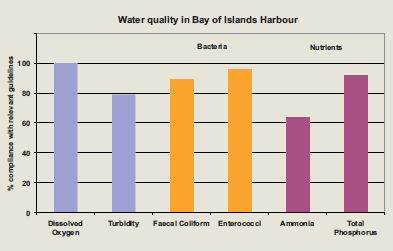
In general, low concentrations of Enterococci and faecal coliforms were recorded in the Bay of Islands, but nutrient levels tended to be high and were often above water quality guideline values. Dissolved oxygen levels were 100% compliant with guidelines. Turbidity was 79% compliant with guidelines.
Bacteria – levels of Enterococci were low throughout the harbour and 96% compliance with MfE guidelines was achieved. Concentrations of faecal coliforms were 89% compliant with MfE guidelines. Non-compliance results coincided with a significant rainfall event prior to the July 2009 sampling.
Nutrients – concentrations of total phosphorus were 92% compliant with guideline values. Sites that exceeded guideline values were; Kerikeri River entrance, Kerikeri Inlet (south side of Waiunui Island), Ōpua Basin, Russell foreshore, Waikere Inlet (west side of Marriot Island) and the upper Kawakawa River. Non-compliance at these sites coincided with a significant rainfall event in July 2009. Non-compliance at a number of sites on other sampling dates appears to be site specific and did not relate to rainfall events. The level of compliance for ammonia concentrations within the Bay of Islands was 64% and ammonia levels were high at sites in the Waitangi River, Kerikeri Inlet and the upper reaches of the Kawakawa River. The majority of non-compliance occurred in July and September 2009 following heavy rainfall. The high nutrient levels found within the Bay of Islands requires further investigation.
In comparison, during 2008-09 the levels of compliance for the Bay of Islands was 99% for Enterococci, 78% for total phosphorus and 63% for ammonia.
Whāngārei Harbour
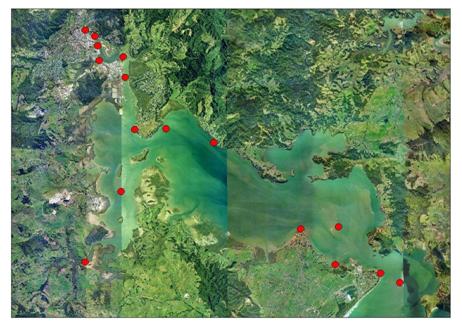
Map: Whangarei Harbour sampling sites
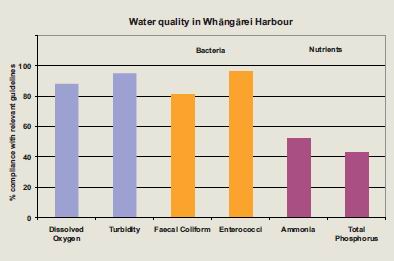
In general, higher levels of nutrients and faecal coliforms were recorded at sites in the upper Whāngārei Harbour (between Onerahi and the Town Basin) and a decrease in concentrations at sites towards the harbour entrance. Dissolved oxygen was 88% compliant with guidelines, and turbidity was 95% compliant with guidelines.
Bacteria – levels of Enterococci were low throughout the harbour and 96% compliance with MfE guidelines was achieved. Concentrations of faecal coliforms were 81% compliant with MfE guideline values. Non-compliance occurred predominantly at sites in the Town Basin, the Waiarohia Canal and the Hātea River. The Town Basin site did not meet guideline values for faecal coliforms at any time during sampling. Investigations are underway to identify sources of faecal matter at these sites.
Nutrients – concentrations of total phosphorus were 43% compliant with guideline values. The sites with the highest number of non-compliance were located in the Mangapai River, Kaiwaka Point, Kissing Point, Limeburners Creek, the Town Basin, the Hātea River and Waiarohia Canal. These sites (with the exception of Kaiwaka Point) did not comply with the guidelines at any time during 2009-2010 sampling. Ammonia concentrations were high and the overall level of compliance for Whāngārei Harbour with guideline values was 52%. Ammonia concentrations were high at Kaiwaka Point, Kissing Point, Limeburners Creek, Mid Town-Basin, Port Whāngārei, Waiarohia Canal and the Hātea River and the majority of these sites did not comply with guideline values at any time during 2009-2010 sampling. In July 2009 most sites in the Whāngārei Harbour did not comply with the ammonia guideline values, which coincided with a significant rainfall prior to sampling. The high levels of nutrients found within Whāngārei Harbour require further investigation.
In comparison during 2008-09 the levels of compliance in Whāngārei Harbour was 99% for Enterococci , 39% for total phosphorus and 41% for ammonia.
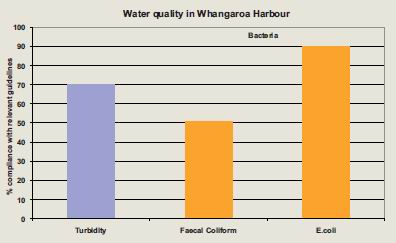
Whangaroa Harbour
Bacteria – E. coli levels were 90% compliant with MfE guidelines at all sites and non-compliance appeared to be due to high volumes of land runoff during a large storm event in October 2009. However, concentrations of faecal coliforms were only 51% compliant with MfE guidelines, with most non-compliance recorded during winter months and after heavy rain, e.g. October 2009.
Sediments – turbidity levels were 70% compliant with guideline values. The highest turbidity levels were measured at the site west of Cape Horn and at the mouth of Waitaruke drain. The largest increase in turbidity was associated with the October storm. Further investigation of run-off and rivers are a priority for 2010-2011.
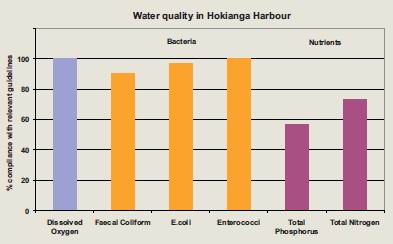
Hokianga Harbour
In general, there were low levels of faecal bacteria in the harbour, but nutrient levels were high and were often above water quality guideline values. Dissolved oxygen was 100% compliant with guidelines.
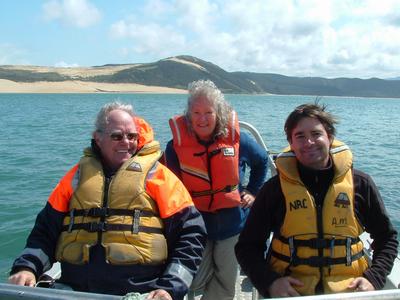
Photo: Regional Council staff and volunteers sampling Hokianga Harbour
Nutrients – overall, compliance with the total phosphorus guideline level was 57% and concentrations of total phosphorus were highest at all sites in June 2009. High concentrations were also recorded at sites near river mouths, during months with high rainfall, e.g., Oraoa & Mangamuka River, Waihou River, Waima River, South Kohukohu, Rāwene, Orira River, south of Ruapapaka Island and Whirinaki River. Total nitrogen concentrations were 73% compliant with water quality guidelines. Sites where concentrations exceeded guideline levels were in the upper reaches at Waihou River, mouth of the Oraoa and Mangamuka Rivers, Rāwene, Orira River, mouth of the Waima River, Mangamuka River and south of Ruapapaka Island. Non-compliance tended to occur during the winter months.
Bacteria – levels of Enterococci were low throughout the harbour and 100% compliance with MfE guidelines was achieved. Levels of E. coli were also low and 97% compliance with guideline levels was recorded. Faecal coliform levels were also low and 90% compliance was achieved. However, concentrations of E.coli in shelfish were only 66% compliant with New Zealand guidelines for shellfish. Non-compliance generally coincided with heavy rainfall events in June and October 2009.
Kaipara Harbour
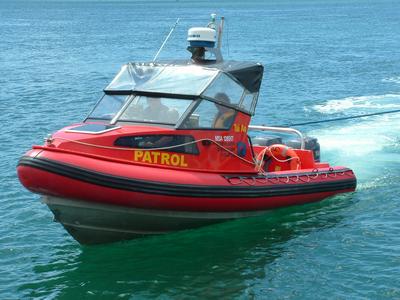
Photo: Regional Council staff monitoring Kaipara Harbour
In general, higher concentrations of nutrients and faecal bacteria were recorded in the upper reaches of the harbour with a decrease in concentrations towards the harbour entrance.
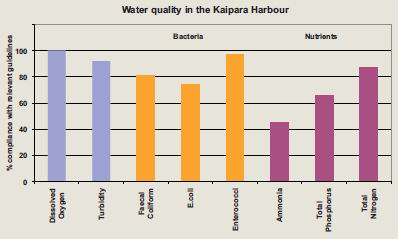
Nutrients – concentrations were generally highest in the northern inflows, specifically nitrate-N and total phosphorus, at Wahiwaka Creek and Oruawharo River, but organic nitrogen concentrations were highest in the southern inflows. The level of compliance with the ammonia guideline was 45% and ammonia concentrations were high at nearly all sites during the winter. Three sites regularly failed to meet the total nitrogen guideline; Wairoa River (at Burgess Island), Wahiwaka Creek and Five Fathom Channel. Overall there was 87% compliance with the nitrogen guideline. Two thirds of all sites met the total phosphorus water quality guideline.
Bacteria – only one site exceeded the MfE guideline for Enterococci, at Wahiwaka Creek. E. coli levels were elevated during May 2009 and were highest in the Wahiwaka Creek inflows and inflows into Hargreaves Basin followed by the Arapaoa River and the outer Oruawharo River. Overall there was 81% compliance with Faecal coliform guidelines, 74% compliance with E. coli guidelines and 97% compliance with Enterococci guidelines.
Sediments – the highest suspended solid concentrations were measured during short rainy periods throughout the harbour. Turbidity levels were also measured and 92% compliance was achieved against turbidity guidelines. The highest levels of suspended solids and turbidity were measured after one large storm in November 2009. There is not a direct relationship between turbidity levels and suspended solids in waters and that is why some sites exceed the guideline levels and others do not. Hence, turbidity levels can be high but sediments in the water may be only partly contributing to the overall load.