2009-2010 results
Within this section…
Biological communities
In the five estuaries monitored in 2009-2010, more than 22,000 individuals were indentified belonging to 94 species. The biological communities at each monitoring site were found to be distinctly different from each other and there is some evidence that the biological communities in the sediments may have been influenced by human activities.
The abundance of species that are known to be sensitive to human disturbance was generally lower at sites where concentrations of metals and nutrients were elevated. Conversely species that are tolerant to human disturbance were generally more abundant at sites with elevated levels of nutrient and metal contamination. Sediment particle size itself is known to influence biological communities and so further analysis is therefore being undertaken to understand how the sediment quality and sediment particle size is influencing the biological communities.
Nutrients
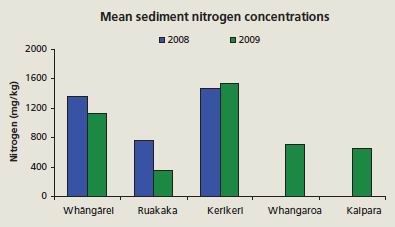
There are currently no national guideline values for sediment nutrient concentrations in New Zealand. However, nutrient concentrations in the Whāngārei harbour and Kerikeri Inlet were high in comparison to concentrations recorded in similar monitoring programmes elsewhere in New Zealand.
Concentrations of both phosphorus and nitrogen were high at sites in the Hātea River, Mangapai River, Waipapa River, Kerikeri River and Kahoe River, and at levels that suggest these environments are ‘enriched'. Nutrient enrichment can lead to excessive plant growth, which can in turn cause a rapid reduction in water quality, harmful algal blooms, shellfish contamination, fish kills and a reduction in biodiversity. Nitrogen concentrations in Ruakaka and Whāngārei Harbour were lower than in 2008 but phosphorus concentrations in Whāngārei and Ruakaka had increased in comparison to 2008 levels.
Metals
In 2009, sediment metal concentrations complied with ANZECC guidelines at all of the monitoring sites. These metal concentrations have not changed markedly since 2008. Nickel concentrations have decreased in the three estuaries monitored in 2008 and 2009 (Whāngārei, Ruakaka and Kerikeri) and copper and zinc concentrations in Ruakaka Estuary sediments were lower than levels recorded in 2008.
However, in the Hātea River, Whāngārei, relatively high concentrations of copper, zinc and lead were recorded and in the Kerikeri and Waipapa Rivers in the Kerikeri Inlet, concentrations of chromium, copper, nickel and zinc were also relatively high, compared to levels reported in similar monitoring programmes elsewhere in New Zealand.
The Hātea River is located in a highly modified urban catchment, where metal concentrations are to be expected while the Kerikeri Inlet has a predominately rural catchment, with little urban or industrial land use, so higher levels are more unexpected. Runoff from roading, urban areas, agricultural and horticultural land, and stormwater discharges are all likely sources of metal contamination in these systems. Further investigation is needed to identify the sources of metal contamination in Kerikeri Inlet and the Hatea River.
Copper is used in roofing, drain pipes, antifouling paint for ships hulls, fungicides, electrical wiring, electronics, wood preservatives, and agrichemicals, and these are all possible sources of copper found in estuaries. Zinc is used in galvanised roofs, drainpipes, house paints, marine antifouling paint, tyres and some agrichemicals such as fertilizers and pesticides. Chromium is used in electronic components, paints, as a wood preservative and as corrosion protection in zinc plated steel. Nickel is predominately used as an alloy in metals, including stainless steal and is also used in nickel-cadmium batteries, paints and computer components. Metals are also found naturally for example in volcanic soils, so soil erosion may therefore also contribute to metal concentrations in our harbours and estuaries.
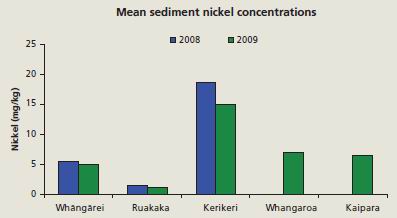
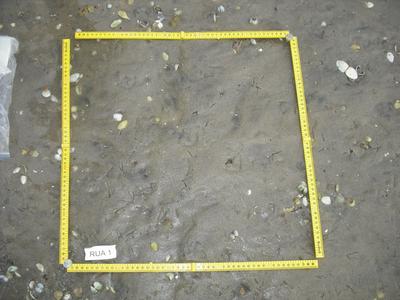
Photo: Quadrat used to sample the number of animals