Results 2008-09
Within this section…
Key Points 2008-09
· Water clarity has improved at 4 sites and decreased at 2 sites
· There has been no change in E. coli compliance
· Only 1 site has increased nitrogen
· Phosphorus levels are decreasing at 11 sites
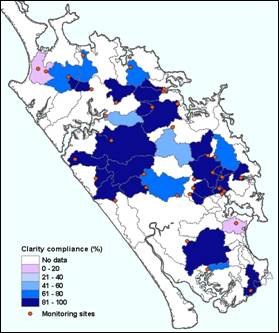
Water Clarity
Water clarity measures how clear or cloudy the water is. It indicates how much sediment or other suspended solids (such as algae or faecal material) the water is carrying. In New Zealand, the guideline for water clarity is to be able to see more than 0.6m through the water.
Trend analysis indicates that water clarity has increased (improved) at four sites. The improvement in water clarity could be as a result of increased streamside planting or better land management in the surrounding catchments. An improvement in the quality of direct discharges in these catchments may also be a factor. Water clarity is decreasing in the Awanui River (upstream of the Waihue channel) and Victoria River, which may be due to land-use changes in the catchment.
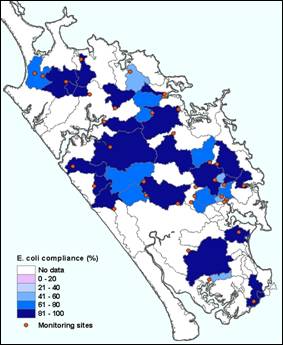
Bacteria
Low levels of bacteria are present in freshwater bodies as a result of natural processes, such as plant decay. However, land-use practices and human activity can increase the levels of bacteria in freshwater bodies above safe levels. Levels of the indicator bacteria E. coli are monitored in all RWQMN sites and the results are compared to the ‘Microbiological Water Quality Guidelines for Marine and Freshwater Recreational areas'.
Trend analysis indicates that there are currently no significant trends in bacterial levels (E. coli) in any of the RWQMN sites studied. This means that sites with levels of E. coli within the recommended guidelines are not declining, but it also means that sites with levels of E. coli above the recommended guidelines are not improving.
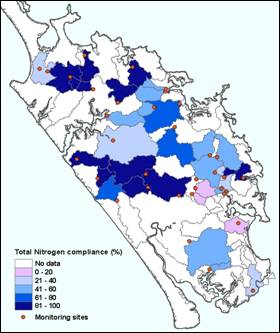
Total Nitrogen
Nitrogen is needed by aquatic plants for growth and is naturally present in freshwater bodies. Manmade sources of nitrogen - for example, run-off from animal feedlots and fertilised fields, or treated wastewater being returned to streams - can increase levels of nitrogen in the receiving water above the recommended guidelines. In New Zealand, the guideline for total nitrogen in freshwater is < 0.614mg/L.
High nitrogen levels can cause ‘eutrophication' of a water body, which can lead to excessive growth of aquatic plants (including pests) and algae (‘algal blooms'). An unpleasant odour and taste to the water, as well as reduced water clarity, often accompany this process.
Trend analysis shows that levels of total nitrogen (TN) are decreasing in the Mangere, Punakitere and Wairua Rivers. This could be as a result of improving farm management practices, including streamside planting and better fertiliser application. It could also be as a result of better quality direct discharges, for example, discharges of farm dairy effluent. Only one site, Waitangi at Waimate, appears to have increasing levels of TN. This is a worrying trend that needs to be investigated.
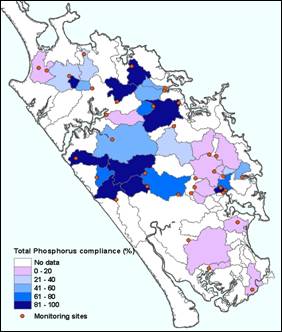
Total Phosphorus
Phosphorus exists naturally in freshwater systems, however additional phosphorus can enter freshwater from discharges, such as wastewater from sewage treatment plants; stormwater, agricultural, and land clearance runoff, as well as from within the water system itself, e.g. erosion of rock and sediments from riverbanks.
In freshwater systems, phosphorus is the main nutrient that limits the growth of algae and plants. Excessive phosphorus can therefore lead to increased plant and algal growth, with similar effects to that of excessive nitrogen. In New Zealand, the guideline for total phosphorus in freshwater is < 0.033mg/L.
Trend analysis indicates that total phosphorus (TP) levels are decreasing at 11 sites, with no sites showing a significant increase. However, phosphorus levels are still of concern in the RWQMN as compliance with the ANZECC guidelines is very poor, with only 9 of the 35 sites complying for more than 81% of the time.
For more information go to http://www.nrc.govt.nz/riverdata