Macroinvertebrate Monitoring
Within this section…
Different stream macroinvertebrates (aquatic animals such as insects, worms and snails) show different responses to changes in their environment, such as water quality or low flows, and different species show different tolerances to pollution. Macroinvertebrates are good indicators of local conditions because they tend to stay in one place and are affected by the environmental conditions over an extended period of time, unlike water quality results which tend to be spot measurements, i.e. that exact point in time. Also, stream macroinvertebrates are the best indicator of the life supporting capacity of a stream or river, as they are usually near the middle of the food chain and an important component of stream ecosystems.
This section summarises the results from the February/March 2008 round of macroinvertebrate monitoring, undertaken at four Waiarohia Stream sites, 32 RWQMN sites, and five rivers both upstream and downstream of consented activities in Northland.
The monitoring was carried out following the standard protocol developed by the NZ Macroinvertebrate working group in 2001; ‘Protocols for sampling macroinvertebrates in Wadeable streams' (Stark et al. 20011). Four standard biotic indices were calculated to assess water quality and biological health at the sites:
· Species richness;
· Macroinvertebrate Community Index (MCI);
· Semi Quantitative Macroinvertebrate Community Index (SQMCI); and
· The percentage of Ephemeroptera (mayflies), Plecoptera (stoneflies) and Trichoptera (caddisflies) taxa (%EPT taxa).
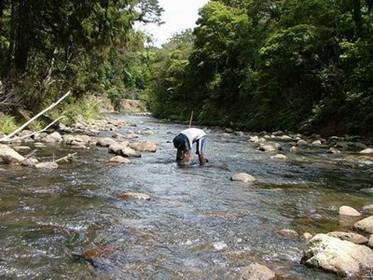
Photo: Macroinvertebrate sampling in the Waipoua River
Biotic Indices Results
The table below shows the four biotic index scores for all sites monitored in 2008. MCI, SQMCI and %EPT taxa have been colour-coded to show the range in water quality or degradation at each site. For example, red indicates poor water quality and a severely degraded site, orange and yellow indicate moderate water quality and green indicates good water quality or a stream still in a relatively ‘pristine' state (very little impact from humans).
Waiarohia Sites
| Site description | Species richness | MCI | SQMCI | %EPT taxa |
| Rust Ave Bridge | 24 | 79.2 | 3.03 | 20.8 |
| Russell Road Bridge North | 28 | 91.4 | 4.08 | 32.1 |
| Kamo tributary | 7 | 60 | 3.89 | 0.0 |
| Whau Valley Road | 23 | 91.3 | 3.73 | 30.4 |
RWQMN Sites
| Site description | Species richness | MCI | SQMCI | %EPT taxa |
| Waipoua @ SH12 Rest area | 29 | 135.2 | 8.21 | 72.4 |
| Opouteke @ Suspension Bridge | 20 | 88 | 3.55 | 35 |
| Mangakahia @ Twin bridges | 19 | 88.4 | 3.1 | 36.8 |
| Waipapa @ Forest Ranger | 29 | 126.2 | 6.49 | 55.2 |
| Kaihu @ gorge | 24 | 86.7 | 2.73 | 29.2 |
| Mangahahuru @ Main Road | 28 | 100.7 | 6.05 | 35.7 |
| Waimamaku @ SH12 | 24 | 106.7 | 3.56 | 50 |
| Victoria @ Thompsons Bridge | 26 | 118.5 | 6.28 | 50 |
| Waipapa @ Kerikeri | 8 | 97.5 | 4.99 | 25 |
| Kerikeri @ Stone Store | 20 | 84 | 3.28 | 30 |
| Mangamuka @ Iwitaua Road | 20 | 101 | 6.6 | 50 |
| Waitangi @ Waimate North | 29 | 93.8 | 5.07 | 31.0 |
| Waitangi @ Watea | 17 | 80 | 3.67 | 11.8 |
| Whakapara @ Cableway | 22 | 79 | 4.02 | 22.7 |
| Waipao @ Draffin Road | 15 | 98.7 | 4.2 | 53.3 |
| Mangakahia @ Titoki | 18 | 86.3 | 4.25 | 33.3 |
| Ngunguru @ Waipoka Road | 2 | 90 | 4.5 | 0 |
| Kaeo @ Dip Road | 7 | 122.9 | 6.04 | 42.9 |
| Punakitere @ Taheke Recorder | 24 | 93.3 | 4.57 | 45.8 |
| Oruru @ Bowling club | 11 | 83.6 | 4.16 | 27.3 |
| Waiotu @ SH1 | 11 | 86 | 3.54 | 45.5 |
| Awanui @ FNDC water take | 20 | 95 | 4.09 | 45 |
| Mangahahuru @ Apotu Road | 13 | 76.7 | 3.77 | 30.8 |
| Waiharakeke @ Foot Bridge | 6 | 104 | 4.01 | 50 |
| Paparoa @ Foot Bridge | 11 | 89.1 | 4.55 | 9.1 |
| Hakaru @ U/S of SH1 | 19 | 72.6 | 4.17 | 21.1 |
| Wairua @ Purua | 13 | 80 | 4.47 | 15.4 |
| Utakura @ Horeke Road | 8 | 92.5 | 4.18 | 25 |
| Awanui @ Waihue channel | 5 | 105 | 4.16 | 40 |
| Mangere @ Knights Road | 22 | 72.4 | 4.22 | 9.1 |
| Ruakaka @ Flyger Road | 22 | 102.7 | 4.97 | 40.9 |
| Manganui @ Permanent station | 13 | 83.1 | 4.17 | 15.4 |
Resource Consent Sites
| Site description | Species richness | MCI | SQMCI | %EPT taxa |
| Dam downstream | 15 | 68 | 3.14 | 13.3 |
| Dam upstream | 20 | 123 | 7.15 | 50 |
| Oxidation pond A downstream | 18 | 71.8 | 3.45 | 5.6 |
| Oxidation pond A upstream | 10 | 84.4 | 3.93 | 10 |
| Meat works downstream | 12 | 86.7 | 4.21 | 16.7 |
| Meat works upstream | 6 | 104.0 | 4.01 | 50 |
| Oxidation pond B downstream | 17 | 107.1 | 3.58 | 52.9 |
| Oxidation pond B upstream | 17 | 103.5 | 5.89 | 52.9 |
| Quarry downstream | 14 | 108.6 | 4.73 | 35.7 |
| Quarry upstream | 11 | 90.9 | 3.77 | 18.2 |
Interpretation of MCI & SQMCI (Boothroyd & Stark 2000[2])
| Interpretation | MCI score | SQMCI score |
| Clean water | >120 | >6.0 |
| Doubtful quality or possible mild pollution | 100-119 | 5.0-5.99 |
| Probable moderate pollution | 80-99 | 4.0-4.99 |
| Probable severe pollution | <80 | <4.0 |
Colour codes for %EPT taxa
| >60% EPT taxa |
| 40 – 59.9% EPT taxa |
| 20 – 39.9 % EPT taxa |
| Less than 20% EPT taxa |
Macroinvertebrate Results Summary
Waiarohia Stream Sites
As for 2007, the results from 2008 indicate that three of the Waiarohia Stream sites; at Rust Ave Bridge, at the Northern Russell Road Bridge and Whau Valley Road, have macroinvertebrate communities associated with moderate to degraded water quality. The results for the small tributary that flows from Kamo into Waiarohia Stream indicate a macroinvertebrate index score indicative of a severely degraded stream with poor water quality.
River Water Quality Monitoring Network Sites
Based on MCI and SQMCI values, macroinvertebrate results for 2008 indicated clean water at four RWQMN sites; Waipoua River at SH12 rest area, Waipapa River in Puketi Forest, Victoria River at Thompsons Bridge, and Mangamuka River at Iwiatua Road Bridge. This is consistent with the water quality results for these sites. The MCI results also indicated clean water for the Kaeo River at Dip Road however caution should be taken with low diversity communities such as this.
Macroinvertebrate results for 2008 indicate that the following sites are severely impacted and/or have poor water quality:
· Hakaru River upstream of SH1
· Mangahahuru River at Apotu Road
· Mangere River at Knights Road
· Whakapara River at Slipway
Trend analysis on 22 of the 32 RWQMN sites sampled shows that stream health is increasing in the Waipoua River based on MCI and SQMCI results. However, four sites - Waiarohia Stream at Whau Valley Road, Punakitere River at Taheke Recorder, Opouteke River at Suspension Bridge and Waiotu River at SH1 Bridge - appear to have decreasing stream health.
Resource Consent Sites
In 2008, macroinvertebrate communities upstream and downstream of the discharges of two oxidation ponds, one dam, one quarry and one meatworks were sampled.
The results show a difference in macroinvertebrate communities upstream and downstream of the two oxidation ponds. The macroinvertebrate index scores downstream of both discharges indicated poorer water quality and more degradation when compared to the upstream samples. However, some of this difference could be attributed to changes in surrounding land use. Results for the dam site also indicated poorer stream health downstream of the discharge when compared to upstream.
Macroinvertebrate results for the meatworks and quarry consent sites indicate that these discharges are having a limited impact on water quality and stream health.
1 Stark, J.D.; Boothroyd, I.K.G.; Harding, J.S.; Maxted, J.R. and Scarsbrook, M.R. (2001). Protocols for sampling macroinvertebrates in wadeable streams. New Zealand Macroinvertebrate Working group Report No. 1. Prepared for the Ministry for the Environment. Sustainable Management Fund Project No. 5103, 57p.