Rainfall
Topographical variation (the shape of the land) across Northland means that rainfall distribution patterns differ considerably over relatively small areas. As a consequence, the NRC hydrological team maintains an extensive rainfall-monitoring network in the region, which is supplemented by NIWA and MetService rainfall sites.
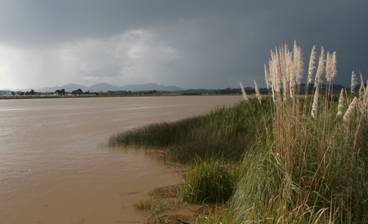
Photo: Rain front, Northern Wairoa River
Northland experiences high intensity rainfall events associated with the passage of tropical or sub-tropical storms that pass over the region from November to March. These "summer cyclones" and thunderstorm events lead to sudden flooding as they can yield 100-150 mm of rainfall per hour.
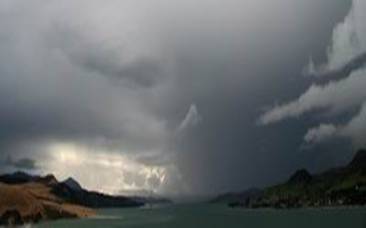
Photo: Isolated rain storm over the Hokianga Harbour
The MetService provides Regional Councils with frequent warnings of approaching, potentially adverse, weather systems. From July 2007 to June 2008, 17 severe weather warnings were issued compared to a total of seven warnings issued in 2006-07. Three severe weather warnings produced significant flooding in various parts of the region.
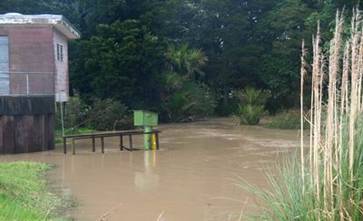
Photo: Ruakaka River in flood – July 2007
The mean annual rainfall for 2007-08 varied from average to above average. The maps below gives a comparison between mean annual rainfall for Northland (in mm) and the annual rainfall amounts received in 2007-08.
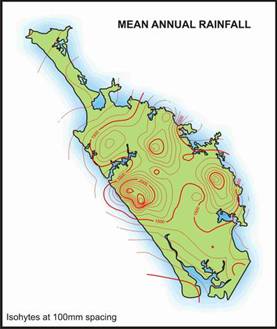
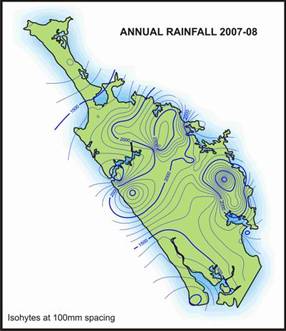
Map: Northland – Mean Annual Rainfall Map: Annual Rainfall for 2007-2008
Northland climate was highly variable during 2007-08. Climatic conditions included a record wet July, extremely wet conditions in September and December and very dry conditions in October and March. Autumn weather conditions were marked by a series of active fronts and intense thunderstorm activity. Winter was characterised by extreme weather patterns. The following is a summary of climatic conditions recorded for each month.
July - Rainfall amounts and river flows were well above average for the month and, in some parts of Northland, at least twice the average. Rain fell for 23 days in July, with heavy rain on 10-11 and 29 July as a result of two severe events. The MetService issued severe weather warnings on both occasions.
On 10 July, a state of emergency was declared in the far north as gale force winds and heavy rainfall produced widespread flooding. Maximum rainfall intensities of 30-40 mm/hr were recorded over may parts of the region. On the 29 July, Northland was again affected by a short but intense rainfall event. In the far north, 50-70mm of rainfall was received over a six hour period. At times, rainfall intensities reached 20-36 mm/hr. For more information on this storm event, please refer to Case Study 1 later in this report.
August - In comparison, August was relatively dry with far north areas around Kaitaia and the Hokianga receiving only 50% to 80% of expected rainfall. More rain fell over areas of the east coast, Whangarei and Kaipara districts (80% to 135% of the norm), due to a localised storm event on the 16 August, which concentrated rainfall in eastern areas of the region.
September - Rainfall patterns were extremely varied during the month, ranging from 40% of the norm to 168%. Above average rainfall was recorded in northern areas of the far north, east coast and Whangarei districts, while below average rainfall amounts were recorded in some parts of the Kaipara district, west coast and mid north areas. The MetService issued a severe weather warning for the 9 September, resulting from a strong moist northeast airflow. Rainfall amounts were expected to reach 50-80 mm over a period of nine hours, mainly in the eastern hills north of Whangarei.
October - Below average rainfall was recorded over the region.
November - Northland experienced another month of variable rainfall, ranging from 55% of the norm in the outer Whangarei Harbour area, to 135% of the norm in far north areas of the Aupouri State Forest. Average to above average rainfall was recorded in the northern areas of the Aupouri Peninsular, Kaitaia to Coopers Beach and eastern areas from Oakura Bay to Whangarei. A severe weather warning issued for late November resulted in moderate amounts of rain (30-70mm recorded in the eastern hills from Puhipuhi to Whangarei).
December - Wetter than usual conditions in the region.
January - Unsettled weather conditions at the start of the month, however conditions improved from mid to late January, with most of the region recording below average rainfall for this month.
February - Wetter than normal conditions resulting from unsettled weather from mid to late February. Rainfall was at least twice the average for the month in eastern parts of Northland and above average elsewhere in the region, apart from areas south of Dargaville, Pouto Peninsular and Ruawai, where dry weather conditions still prevailed.
March - Rainfall amounts were average to above average in far north areas and below average elsewhere, leading to drier conditions than normal.
April - Northland experienced a series of active fronts producing severe thunderstorm activity and associated intense rainfall. Two severe rain events occurred during the periods 14-16 April and 29-30 April. Both events resulted in flash flooding.
May and June - A series of active fronts continued to create unsettled weather during these months. For more information, refer to Case Study 2 later in this report.
The figures below show monthly rainfall amounts (in blue) from July 2007 to June 2008, compared to the long-term monthly mean (in red) for each area.
 | |
Chart: Monthly rainfall for 2007-08 for each area, compared to monthly average