State of the Environment Monitoring
Within this section…
Groundwater Levels
Groundwater level monitoring provides information on the effects of climate, land use and groundwater abstraction on groundwater resources. Monitoring is undertaken as part of a region-wide hydrometric network and began during the late 1980s, with some records extending back as far as 1975.
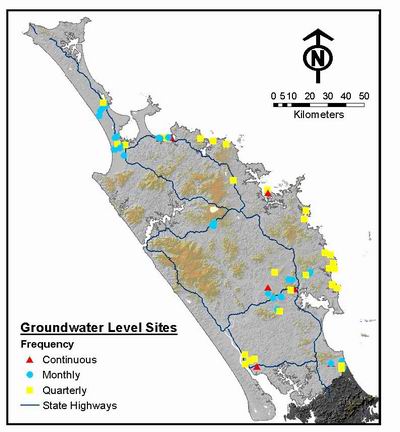
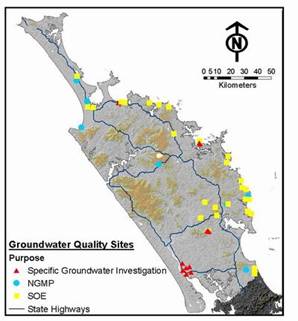
Groundwater levels are currently recorded continuously at nine sites, monthly at 43 sites and quarterly at 30 sites around the region. These sites have been chosen to provide adequate regional coverage, as well as targeting areas with specific environmental concerns. The locations of the current groundwater level monitoring sites are shown on the map below.
Results of groundwater level monitoring
Results from the 2005-2006 sample period showed that groundwater levels throughout Northland were at or near their lowest since 1990, as a result of low rainfall recharge the preceding winter. Groundwater levels have since recovered and in 2007-08, were generally found to be above average. This can largely be attributed to two significant rainfall events in March and July 2007.
A breakdown of results from 2006-08 for several key aquifers in Northland is given below.
Whangarei basalt aquifer
In this aquifer, groundwater levels are typically highest from July to September, dropping to the lowest point in the summer months. This can be seen in the graph below for Poroti West monitoring bore, which is in the Whangarei basalt aquifer. The vertical axis of the graph shows depth below ground level in metres.
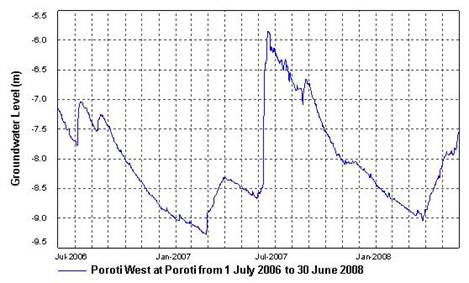
The groundwater recharge resulting from the two significant rainfall events in March and July 2007 can clearly be seen, with an increase in groundwater level of approximately 0.8 metres and 2.5 metres respectively. Groundwater levels began to increase within 24 hours of the rainfall events commencing.
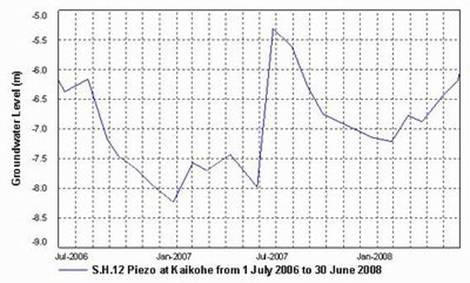
Kaikohe basalt aquifer
The groundwater level in the SH12 monitoring bore shows high seasonal variation and is strongly influenced by rainfall. This influence can be seen during the March and July 2007 rainfall events when groundwater levels increased by 0.8m and 2.7m respectively.
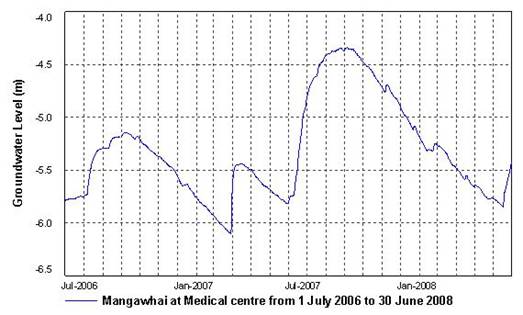
Mangawhai sand aquifer
In the Mangawhai area, groundwater levels generally peak in October as a result of a delay between rainfall events and the actual recharge of the groundwater resource. The March and July 2007 rainfall events resulted in an increase in groundwater levels of approximately 0.7 m and 0.4 m respectively.
Aupouri sand aquifer
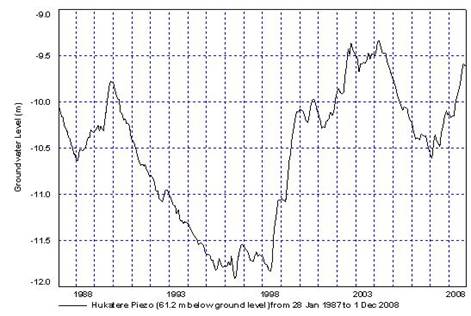
The Aupouri aquifer has a large storage capacity. The large volume of water stored within this aquifer means that it is less influenced by seasonal rainfall trends, as is the case with many other aquifers in the region, and more influenced by long term rainfall trends.
The decline in water levels in the Hukatere Forest monitoring bore from 1987 to 1996 (as seen in the graph below) is likely to be as a result of less than average rainfall in the late 1980's to early 1990's, and the effects of plantation forestry reducing recharge to the system. Felling of the plantation forest and increased rainfall is likely to have resulted in the increase in groundwater levels recorded from 1998 to 2004. Results from 2007-08 show a general increase in water levels due to greater than average rainfall during this period.
Groundwater Quality
NRC participates in the National Groundwater Monitoring Programme (NGWMP), which is a joint project between the Institute of Geological and Nuclear Sciences (IGNS) and all Regional Councils. The focus of this research programme is to determine national groundwater quality trends.
There are seven sites within the programme in Northland. These sites have been sampled every three months since September 1996. The sites are located at Houhora, Paparore, Ahipara, Kaikohe, Tutukaka, Glenbervie and Tara (as shown on the map below). Samples are taken from each site and analysed for major determinants, such as nutrients, metals and bacteria.
NRC also operates a regional groundwater quality ‘State of Environment' monitoring programme (SoE), which commenced in November 2002. The data gained from this monitoring helps to improve understanding of the region's groundwater systems and so facilitate the sustainable management of groundwater resources. The aim of the programme is to collect baseline water quality data for each of the different aquifers in Northland, identify any trends in groundwater quality over time, and identify the most likely cause of these trends.
As part of the SoE monitoring, 29 sites are sampled (in addition to the seven sampled for the National Groundwater Monitoring Programme) every three months for a full range of determinants. Twenty-two of these sites are located in coastal aquifers. In addition to analysing the chemical properties of these aquifers, coastal sites are also tested for saltwater intrusion and bacterial indicators on a six monthly basis. Groundwater levels are recorded at each site where possible. All aquifers sampled through the SoE programme are listed below.
| Coastal | General |
| Mangawhai Heads east Mangawhai Heads west Mangawhai Village Sandy Bay Taupo Bay Tauranga Bay Te Ngaire Bay Tapeka Point Pataua Bay Whananaki Bay Taiharuru Bay Ngunguru Whangaumu Beach Matapouri Bay Oakura Bay (2) Bland Bay Cable/Mangonui Bay Coopers Beach Waipapakauri Beach Waipapakauri East Houhora | Maunu Basalt Whatitiri Basalt Three Mile Bush Basalt Matarau Basalt Glenbervie Basalt Kerikeri Basalt Maungakaramea Basalt |
Results of Groundwater Quality Monitoring
Groundwater in Northland is generally of a high enough quality that it can be consumed without treatment. However, three potential sources of contamination that are of concern in Northland are nitrates, bacteria and saltwater (saline intrusion). The results of water quality monitoring for the last five years are reported in detail in the State of Environment Report 2007. For a copy of this report go to http://www.nrc.govt.nz/Resource-Library-Summary/Environmental-Monitoring/State-of-the-Environment-Monitoring/.
The results from groundwater quality monitoring undertaken by NRC in 2007-08 indicate that the majority of determinants analysed for each sample are well below New Zealand drinking water limits, however some results are of concern. Nine of the monitoring sites had median Iron (Fe) concentrations above the aesthetic guideline value of 0.2 mg/L. 12 monitoring sites had median Manganese (Mn) concentrations in excess of the aesthetic guideline value 0.04 mg/L. Out of these 12 sites, two sites had median Manganese concentrations above the Maximum Allowable Value for health reasons of 0.4 mg/L.
The ‘Drinking Water Standards for New Zealand (Ministry of Health 2005)', can be found at:
http://www.moh.govt.nz/moh.nsf/by+unid/12F2D7FFADC900A4CC256FAF0007E8A0?Open.
Most of the bores that have median Iron and Manganese concentrations in excess of aesthetic guideline values intersect groundwater in either basalt or fractured greywacke. In Northland, these rock types contain high concentrations of Iron and Manganese and it is therefore likely that elevated levels are the result of natural processes. Elevated levels of Manganese and Iron can cause staining of pipes and laundry.
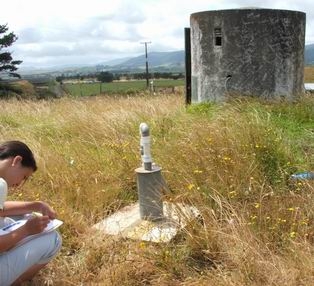
Photo: NRC staff monitoring a bore site
Results of bacterial analysis undertaken during 2007-08 indicate that sixteen groundwater sites have bacteria present above the guideline value. However, only four of these sixteen sites showed repeated bacterial contamination in three consecutive sampling runs. This may be an indication of onsite wastewater contamination, and/or poor bore construction. It is important to note that the Escherichia coli limit set in the ‘The Drinking Water Standards for New Zealand 2005' is less than 1 in 100 ml. Therefore any positive result for bacteria exceeds these drinking water standards.
Nitrate (NO3-) is considered a broad indicator of groundwater contamination from a variety of sources, including fertilisers, agricultural, and human wastes. Nitrate is considered toxic in excessive concentrations. Bottle-fed infants are most at risk, as a high concentration of nitrate affects the ability of the blood to transfer oxygen. High nitrate concentrations in water and diet have also been linked to some types of cancer.
The current New Zealand drinking water limit for nitrate is 11.3 mg L-1 (as NO3-N, taken from the ‘New Zealand Drinking Water Standards 2005'). Monitoring has shown that average nitrate concentrations at all groundwater quality sampling sites are well below this level. Nitrate concentrations are generally higher in the basalt bores than they are in the sands and other geology. This may be a result of the horticultural and agricultural land use in the areas surrounding the basalt aquifers. Elevated nitrate concentrations have been recorded in bores at Taipa, Maungakaramea and Whatitiri. The results of this monitoring are reported in the "specific groundwater investigations' section below.
Conductivity is an indirect measure of salinity. High levels may indicate salt-water intrusion and may be the result of lowering of groundwater levels. Elevated conductivity values have been recorded at one site in the Ruawai area, which is discussed in the specific groundwater investigation section below. Bores monitored in Pataua North and Cable Bay also registered elevated chloride concentrations during a period of low groundwater levels in the summer of 2007-08. This is likely to be a direct result of the influence of saltwater.
All groundwater quality SoE bores were also analysed for Boron and Lithium. The results of this monitoring indicate Boron and Lithium concentrations are well below 'The Drinking Water Standards for New Zealand' (MoH 2005).