Specific Groundwater Investigations
Within this section…
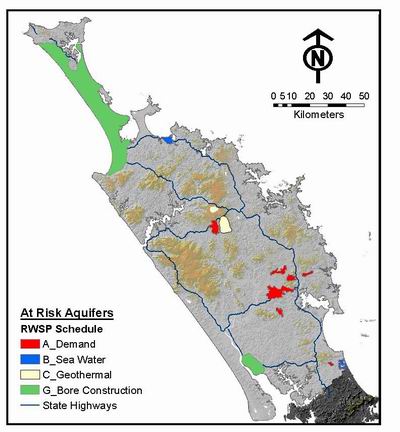
In addition to the above monitoring programs, specific groundwater investigations are currently being undertaken in the Ruawai, Taipa, Russell, Maungakaramea and Whatitiri areas. These projects have been initiated in order to investigate potential issues with groundwater quantity or quality, highlighted during routine monitoring.
The map below shows the location of ‘At risk aquifers' in Northland, and the locations of specific groundwater investigations carried out in 2007-2008.
Ruawai Groundwater Monitoring
The Ruawai area, located approximately 15 kilometres south of Dargaville, is predominantly an alluvial flood plain consisting mainly of mud, sands and peat. The Northern Wairoa River bounds the area to the west and south, and limestone hills mark the northern and eastern boundaries. The flood plain is heavily drained. The main land uses in the area are horticulture (particularly kumara growing) and agriculture (such as dairy farming).
Historical bore logs in the area indicate groundwater is present across the flood plain at varying depths and is of varying quality. Groundwater in the Ruawai area is important as a source of water for irrigation, stock drinking and public water supply, as most local surface water has a high salt content.
The main groundwater issues in the area are the potential for intensive horticulture and agriculture to degrade water quality, and for groundwater abstractions to result in saline (saltwater) intrusion. At present, six bores are sampled every three months for a wide range of parameters in order to determine long-term and seasonal variations in groundwater levels and quality.
The results of monitoring undertaken during 2007-08 are consistent with previous years' results, which indicate elevated chloride and sodium concentrations in the south-eastern and northern boundaries of the groundwater system. These results suggest that saltwater intrusion is occurring in the south-eastern and northern zones of the Ruawai aquifer however this is not influencing the water quality in the western zone, at the site of the Kaipara District Council public water supply bores.
Over the past four years, there has been no evidence of an increasing trend in nitrate or bacterial levels in this aquifer. Monitoring will continue at reduced determinants and a conductivity survey will be carried out during the summer of 2008-09.
Taipa Groundwater Monitoring
Taipa is a coastal aquifer with a saline boundary on its northern and eastern edge. The main source of recharge for this aquifer is rainfall. The Taipa aquifer has similar groundwater issues to Ruawai, including the potential for land-use activities to degrade water quality and for abstraction to increase saline intrusion. Four bores in this aquifer are sampled monthly and analysed for nitrate and saline indicators, such as chloride.
The results from monitoring over the last six years indicate elevated nitrate levels in a number of bores in the Taipa settlement area, in particular the bore at Taipa school. Nitrate levels here exceeded the drinking water limit of 11.3 mg/L on two occasions in 2001-02. The school does not use groundwater from this bore for drinking. Although nitrate levels have shown an overall decline over the last six years, results indicate a seasonal fluctuation in nitrate levels. Property owners are currently being contacted to obtain fertiliser diaries for the past few months in order to cross reference these records to monitoring results.
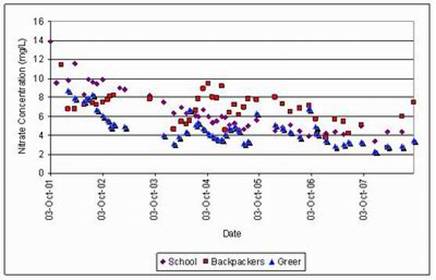
Over the monitoring period, there has been no significant variation in chloride levels in bores adjacent to the foreshore. Monitoring of nitrate and chloride levels in groundwater in the Taipa area will continue, and the potential source of the nitrates will be investigated.
Russell Groundwater Monitoring
The groundwater resource at Russell consists of a gravel and fractured greywacke system located close to the coast. The main sources of recharge into the system are rainfall and onsite wastewater discharges. There are many bores in the area that abstract water for domestic use. The main concern for the Russell aquifer is that reduced recharge due to wastewater reticulation, and increased groundwater use, will lead to an increased risk of saline (saltwater) intrusion. Previous groundwater modelling suggests that the reticulation of wastewater will significantly increase the risk of saltwater contamination during prolonged periods of dry weather.
There are currently four monitoring bores in Russell and Matauwhi Bay. These bores are sampled and analysed for saline indicators and bacteria on a quarterly basis. A new bore has been installed at the Russell foreshore to regularly record groundwater level and conductivity. This data is logged and a telemetry system has been installed to enable direct telephone access to these monitoring results. This system provides an early warning of any increase in saltwater contamination in the aquifer. Monitoring in Russell will continue next financial year.
Age Testing
During 2007-2008, seven bore sites were sampled to determine the average age of groundwater in each. Groundwater is generally a combination of water of different ages due to the mixing processes that occur within an aquifer. The age of groundwater is therefore expressed as "mean residence time", which is not a discrete age but a distribution of ages based on these mixing processes.
Understanding the mean residence time and the age distribution of groundwater has important implications for management of groundwater resources in Northland. For example, if the mean age of groundwater in a particular aquifer is found to be approximately 50 years with limited age distribution, then water quality results would indicate the effects of land use 50 years ago, and will not indicate the influence of any recent land use change.
Samples were collected from groundwater bores at Houhora, Paparoe, Ahipara, Kaikohe, Tutukaka, and Tara and were analysed for tritium, CFC and SF6 isotopes. The initial age estimates are provided in the table below. Further analysis is required to ensure accurate interpretation of these results and to provide an understanding of the distribution of age and mixing processes within each aquifer. The bores will be re-sampled in approximately five years.
| Site of bore | Initial mean residence time estimate (years) |
| Houhora | 71 |
| Paparoe | 140 |
| Ahipara | 35 |
| Kaikohe | 35 |
| Glenbervie | 110 |
| Tutukaka | 28 |
| Tara | 35 |
Groundwater Recharge Estimates
Groundwater ‘recharge' refers to the amount of water that drains through the ground and enters the water table. NRC commissioned Sinclair Knight Merz (SKM) to complete groundwater recharge estimates for 10 ‘At-risk' aquifers in Northland. Using these likely annual recharge estimates (which is calculated as a percentage of average annual rainfall), an interim allocation limit can be set by NRC for groundwater in each aquifer, as is required by the proposed National Environmental Standard (NES) on Ecological Flows and Water Levels (MfE 2008). The results from this study are given in the table below.
In the absence of the data needed to create a Soil Moisture Water Balance Model (SMWBM), groundwater recharge for the aquifers at Matauri Bay, Te Ngaire Bay, Oakura Bay, Whangaumu Bay, Taupo Bay, Whananaki North, Bland Bay, Ngunguru and Pataua (North and South) were estimated using previous studies from similar aquifers in Northland. An SMWBM is essentially a rainfall-runoff model that calculates how much water will flow as surface runoff, and how much will percolate through the soil and into the groundwater.
For the Kerikeri aquifer, an SMWBM was used to estimate the likely annual recharge. Using the SMWBM, the likely range of annual groundwater recharge to the Kerikeri basalt aquifer is 15-20% of average annual rainfall.
| Location | Aquifer | Groundwater recharge range (%) | GW recharge volume (m3/yr) | Interim default allocation limits (m3/yr) |
| Matauri Bay (SKM 2008a) | Greywacke | 1-5 | 56, 405 to 282,025 | 8,461 to 42,304 |
| Te Ngaire Bay (SKM 2008b) | Alluvium | 20-30 | 147,900 to 221,850 | 22,185 to 33,278 |
| Greywacke | ||||
| Oakura Bay (SKM 2008c) | Sand | 20-30 | 280,440 to 420,660 | 42,066 to 63,100 |
| Greywacke | 1-5 | 60,270 to 301,350 | 9,040 to 45,202 | |
| Whangaumu Bay (SKM 2008d) | Sand | 20-30 | 43,520 to 65,280 | 6,528 to 9,792 |
| Greywacke | 1-5 | 91,785 to 458,925 | 13,768 to 68,839 | |
| Location | Aquifer | Groundwater recharge range (%) | GW recharge volume (m3/yr) | Interim default allocation limits (m3/yr) |
| Taupo Bay (SKM 2008e) | Sand/alluvium | 30-40 | 241,740 to 322,320 | 36,261 to 48,348 |
| Greywacke | 1-5 (Andesite 10) | 340,016 to 530,880 | 51,002 to 79,632 | |
| Whananaki North (SKM 2008f) | Sand | 15-25 | 97,920 to 163,200 | 14,688 to 24,480 |
| Greywacke | 1-5 | 14,416 to 72,080 | 2,162 to 10,812 | |
| Bland Bay (SKM 2008g) | Sand/gravel | 30-40 | 409,590 to 546,120 | 61,438 to 81,918 |
| Greywacke | 1-5 | 30,627 to 153,135 | 4,595 to 22,970 | |
| Ngunguru (SKM 2008h) | Sand | 10-20 | 202,640 to 405,280 | 30,396 to 60,792 |
| Greywacke | 1-5 | 44,472 to 222,360 | 6,670 to 33,354 | |
| Pataua North (SKM 2008i) | Sand | 30-40 | 714,420 to 952,560 | 107,163 to 142,884 |
| Greywacke | 1-5 | 81,018 to 405,090 | 12,153 to 60,764 | |
| Pataua South (SKM 2008i) | Sand | 30-40 | 185,220 to 246,960 | 27,783 to 37,044 |
| Kerikeri (SKM 2008j) | Basalt | 15-20 | 46,990,800 to 62,654,400 | 7,048,620 to 9,398,160 |