Tsunami Hazard Assessment
Tsunami hazard is considered a significant risk for Northland's coastal communities. Recent investigations of tsunami generating sources, and a review of recent and pre-historic tsunami events, have provided evidence of the natural hazards occurrence and likely consequences in the region. However, there are a number of ‘unknowns' about tsunami hazard risk for Northland, for example, what is the likely extent of wave run-up and land inundation (flooding) and how does this vary depending on the source of the tsunami.
To better understand tsunami hazard, and to better prepare for the event of a tsunami in Northland, NRC contracted the National Institute of Water and Atmospheric Research (NIWA) to undertake a modelling-based assessment of tsunami hazard for the region. The modelling-based assessment is based on three studies:
· Model Study 1: to model maximum wave heights at the shoreline for selected districts in the Northland region;
· Model Study 2 - Model the extent of landward inundation from tsunami hazard at priority coastal settlements; and
· Model Study 3: Model the extent of landward inundation from tsunami hazard at other coastal settlements.
In 2007-08, Model Study 1 was undertaken and completed. The focus of this study was to model the maximum wave heights at the shoreline for selected districts in the region for the most likely sources of tsunami, and to undertake inundation modelling for two specified communities.
Based on the results from the tsunami source study (Goff et al. 2006), the following sources were identified as likely to cause significant tsunamis in the study areas:
· Distant – Eastern: South America (Chile). A distant tsunami comparable to either the 1868 Peru (now Chile) earthquake (Mw9.0) event or the 1960 Chile Earthquake (Mw9.5) event. This represents the most probable tsunami in the 50-100 year timeframe.
· Regional – Eastern source: Tonga Kermadec trench. Two tsunamigenic earthquakes were studied: a Mw8.5 subduction zone event located just to the north of the Rapuhia Scarp (i.e. in the central portion) and a Mw9.0 subduction zone event in the central and southern portion. These are identified as worst -case scenarios, with a return period of 500 – 2000 years.
For each of these events, NIWA modelled wave height up to the Northland shoreline, with specific emphasis on the following districts:
· Doubtless Bay (Knuckle Point to Berghan Point);
· Ahipara (Shipwreck Bay to Headquarters Road);
· Bream Bay (One tree Point/Darch Point/Bream Head to Bream Tail);
· Whangarei (Mair Road to Home Point, to Town Basin road bridge);
· Bay of Islands (Cape Brett to Cape Wiwiki);
· Whangaruru (Home Point to Okupe Beach);
· Whangarei East Coast North (Motuara Point to Whau Point);
· Whangarei East Coast South (Whau Point to Awahoa Bay);
· Whangaroa (Point immediately west of Taupo Bay, Motuiwi Island including Stephenson and Cavalli Islands);
· Mangawhai (Sentinel Rock to Te Arai point);
· East Beach (Stanley Point to Blackney Point including Walker Island);
· Omapere (Waihopai River to Waimamaku River); and
· Dargaville.
The following maps give an indication of the likely wave heights at each of the study sites for both the distant and regional sources.
Map: Maximum wave height at shoreline for the South American scenario at Mean High Water Springs (MHWS). Areas of shoreline with no colour were not included in the model output.
Map: Maximum wave height at shoreline for the Mw9.0 Tonga-Kermadec subduction zone scenario at MHWS. Areas of shoreline with no colour were not included in the model output.
Inundation modelling was also done for Taipa (in Doubtless Bay) and Ahipara. Sea level rise scenarios of 30 and 50 cm which represent the 50 and 100 year projections defined by the Intergovernmental Panel on Climate Change (IPCC) were also modelled for each scenario. The maps below show the maximum inundation speed and depth for the Tonga-Kermadec subduction zone scenario.
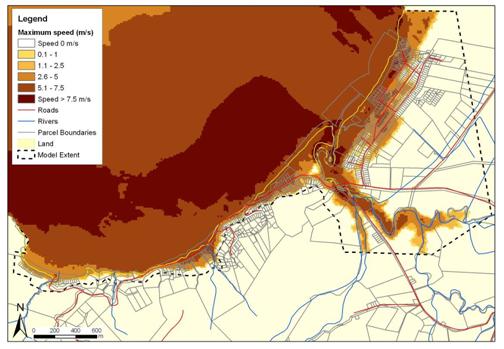

Map: Ahipara: Maximum inundation speed (upper) and depth (lower) plots for the Mw9.0 Tonga-Kermadec subduction zone scenario at MHWS (to extent of LIDAR).