Beach Profile Monitoring
The NRC beach-profile monitoring programme was initiated in 2003-04 and involves mapping the position of the foreshore and foredune and/or cliff at selected coastal locations in Northland. The programme provides valuable information on changes in the position of our beaches, i.e., whether they are eroding, in equilibrium (staying the same) or accreting (growing). Data gathered from this programme enables a better understanding of coastal systems in Northland, which assists the Council and community when looking at the suitability and effect of development in and adjacent the coast. It can also be used to identify ‘coastal hazard zones'.
Monitoring is undertaken at 6-montly intervals (once in winter and once in summer) at key ‘monitor' beaches in the region. A cross-section profile of the foreshore and foredune at each coastal location is taken and the exact location of the foredune ‘toe' is mapped using a Global Positioning System (GPS). Other beaches in Northland are also monitored on a less regular basis following events that may cause significant change, for example, landslides or storm events.
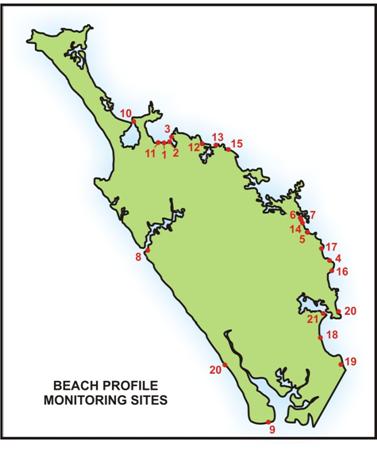
Map: Beach profile monitoring sites
The table below shows the history and state of the beaches surveyed by NRC. A ‘-‘ before the number denotes that the beach is eroding.
| Beach Name | Section Name | Date Range of Surveys |
No. of Years surveyed | Number of Records | Trend (metres per year) | ||
| From | To | ||||||
| 1 | Cable Bay | 13/05/1999 | 4/02/2008 | 9 | 7 | 0 | |
| 2 | Coopers Beach | 9/09/2003 | 4/02/2008 | 5 | 5 | 0.04 | |
| 3 | Hihi | 13/05/1999 | 4/02/2008 | 9 | 6 | 0.11 | |
| 4 | Matapouri | M1 | 2/02/2001 | 7/01/2008 | 7 | 19 | -0.15 |
| M2 | 2/02/1998 | 4/12/2007 | 9 | 21 | -2.43 | ||
| M3 | 2/02/2001 | 7/01/2008 | 7 | 19 | 1.84 | ||
| M4 | 2/02/2001 | 7/01/2008 | 7 | 19 | 1.68 | ||
| 5 | Ngawai | 10/05/1999 | 15/03/2007 | 8 | 4 | 0.42 | |
| 6 | Oakura | 3/02/1998 | 15/03/2007 | 9 | 4 | 0.21 | |
| 7 | Ohawini | OHW1 | 3/02/1998 | 22/03/2005 | 6 | 4 | 0.64 |
| OHW2 | 22/03/2005 | 15/03/2007 | 2 | 2 | -0.03 | ||
| 8 | Omapere | OM1 | 26/10/2001 | 17/04/2008 | 7 | 7 | -0.20 |
| OM2 | 26/10/2001 | 17/04/2008 | 7 | 6 | -0.43 | ||
| OM3 | 26/10/2001 | 17/04/2008 | 7 | 6 | 0.25 | ||
| OM4 | 26/10/2001 | 17/04/2008 | 7 | 6 | -0.57 | ||
| OM5 | 26/10/2001 | 3/12/2007 | 6 | 4 | -0.04 | ||
| OM6 | 26/10/2001 | 3/12/2007 | 6 | 6 | -0.53 | ||
| 9 | Pouto | P2 | 16/01/1989 | 20/02/2008 | 19 | 34 | 1.66 |
| P3 | 16/01/1989 | 20/02/2008 | 19 | 34 | 15.97 | ||
| P3A | 20/02/1990 | 20/02/2008 | 18 | 34 | 0.85 | ||
| P4 | 16/01/1989 | 20/02/2008 | 19 | 35 | -8.87 | ||
| P4A | 21/02/2000 | 20/02/2008 | 8 | 16 | -7.58 | ||
| P5 | 16/01/1989 | 20/02/2008 | 19 | 34 | 0.08 | ||
| P5A | 21/02/2000 | 20/02/2008 | 8 | 16 | -12.94 | ||
| 10 | Rangiputa | Rangiputa A | 25/05/1999 | 4/02/2008 | 9 | 4 | 0.04 |
| Rangiputa B | 25/05/1999 | 16/03/2007 | 8 | 4 | -0.51 | ||
| Reef Lodge | 25/05/1999 | 16/03/2007 | 8 | 4 | -0.62 | ||
| 11 | Taipa | 22/02/1990 | 4/02/2008 | 18 | 11 | -0.35 | |
| 12 | Taupo | 12/05/1999 | 4/02/2008 | 9 | 9 | -5.98 | |
| 13 | Tauranga | 4/07/2002 | 4/02/2008 | 6 | 9 | 2.35 | |
| 14 | Te Mimiha | 10/05/1999 | 16/03/2007 | 8 | 4 | 0.76 | |
| 15 | Te Ngarie | 10/07/2002 | 4/02/2008 | 6 | 8 | -0.13 | |
| 16 | Wellingtons Bay | 10/03/1998 | 7/01/2008 | 10 | 6 | 0.32 | |
| 17 | Whananaki | 16/08/2004 | 13/08/2007 | 3 | 5 | 0.89 | |
| 18 | Bream Bay | RM 7 | 14/07/1976 | 23/06/1983 | 7 | 31 | -0.46 |
| RM 8 | 14/07/1976 | 12/09/2007 | 31 | 52 | -0.32 | ||
| RM 9 | 14/07/1976 | 7/07/1982 | 6 | 30 | 0.8 | ||
| RM 10 | 14/07/1976 | 23/16/1983 | 7 | 39 | -0.25 | ||
| RM 11 | 8/12/1977 | 12/09/2007 | 30 | 29 | 0.05 | ||
| RM 12 | 21/09/1976 | 23/06/1983 | 7 | 34 | 0.99 | ||
| RM 13 | 13/07/1976 | 12/09/2007 | 31 | 43 | 0.56 | ||
| RM 14 | 13/07/1976 | 23/06/1983 | 7 | 40 | -0.27 | ||
| RM 15 | 13/07/1976 | 12/09/2007 | 31 | 42 | -0.3 | ||
| RM 16 | 13/07/1976 | 23/06/1983 | 7 | 48 | 1.92 | ||
| RM 17 | 29/11/1977 | 12/09/2007 | 30 | 36 | -0.21 | ||
| RM 18 | 2/11/1976 | 23/06/1983 | 7 | 36 | -0.44 | ||
| Beach Name | Section Name | Date Range of Surveys |
No. of Years surveyed | Number of Records | Trend (metres per year) | ||
| RM 19 | 21/10/1976 | 1/03/1998 | 12 | 36 | 0.71 | ||
| RM 20 | 24/08/1976 | 23/06/1983 | 7 | 32 | 2 | ||
| RM 21 | 23/08/1976 | 24/06/1983 | 7 | 31 | 1.85 | ||
| RM 22 | 30/06/1977 | 24/06/1983 | 6 | 35 | 0.07 | ||
| 19 | Mangawhai | M5 | 27/07/2000 | 28/08/2007 | 7 | 15 | 3.19 |
| M6 | 27/07/2000 | 28/08/2007 | 7 | 14 | 0.38 | ||
| 20 | Glinks Gulley | 29/09/1994 | 1/08/2008 | 14 | 21 | 1.44 | |
| 20 | Ocean Beach | OB1 | 15/07/1976 | 12/09/1977 | 1 | 12 | 24..46 |
| OB1A | 4/05/1977 | 10/07/1979 | 2 | 25 | 0.61 | ||
| OB2 | 23/08/1976 | 10/07/1979 | 3 | 30 | -0.26 | ||
| OB3 | 22/11/1976 | 10/07/1979 | 3 | 36 | 0.35 | ||
| OB4 | 22/11/1976 | 10/07/1979 | 3 | 35 | 1.62 | ||
| OB5 | 23/08/1976 | 10/07/1979 | 3 | 31 | -1.21 | ||
| OB6 | 23/08/1976 | 18/03/1981 | 5 | 44 | 4.05 | ||
As can be seen from the table, the general trend is for only small rates of accretion or erosion at most sites.
During 2007-08, the beach at Matapouri underwent beach nourishment and so the beach is still finding its natural state. The foreshore at Omapere was subject to significant erosion during the year and rockwork was required to stabilise a house located on the beach front. The beach at Pouto, a highly dynamic system, was cut back extensively to the east of the cliffs.
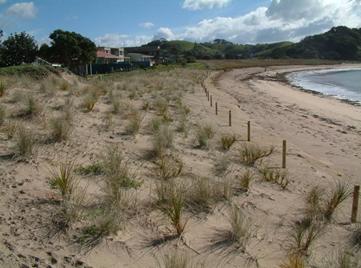
Photo: Beach nourishment at Matapouri