Particulate Matter
Within this section…
Particulate matter (PM10) is a collective term used to describe very small solid or liquid particles less than 10 microns in aerodynamic diameter, such as dust, fumes, smoke and mist or fog. PM10 originates from both natural (wind blown dust, forest fires, volcanic emissions, sea spray or pollen) and anthropogenic activities (including automobile exhausts, solid fuel burning, and industrial emissions).
Smoke has high levels of PM10, which is easily inhaled and can harm people's health. People most susceptible to the effects of inhaling PM10 include the elderly, those with existing respiratory disease, those with cardiovascular disease, those with infections such as pneumonia and children.
The recently revised Emission Inventory of the Whangarei airshed has confirmed that the main source of PM10 during the winter months is solid fuel burning for home heating (74%), followed by industry (11%), outdoor burning (9%) and transport (6%). The photograph below shows an inversion layer over Whangarei city formed by cool, calm weather conditions allowing the build up of air pollution (photo courtesy of Northern Advocate).
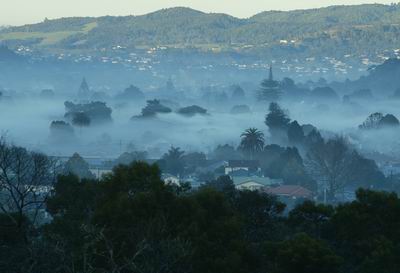
Photo: An inversion layer over Whangarei city
Sampling PM10
Particulate matter is sampled at three locations in Northland; Water Street and Robert Street in Whangarei and at Donald Road in Kaitaia. PM10 levels at Water Street are monitored using a high volume sampler, as shown in the photograph below. The sampler collects inhaleable particulate matter on a glass fibre filter over a 24 hour period. At the end of the sampling period, the filter is carefully removed, placed in a conditioning chamber and then weighed. A sample is collected every three to six days.
PM10 levels at Robert Street are monitored using a Beta Attenuation Monitor (BAM), which continuously samples the air using specially prepared filter tape. The BAM is connected to a computer which records a result every 10 minutes. The data is periodically downloaded and converted to 24 hour averages (midnight – midnight).
All results collected are compared to the National Environmental Standard for PM10, which is no more than one exceedance of the limit of 50 mg/m3 in a twelve month period.
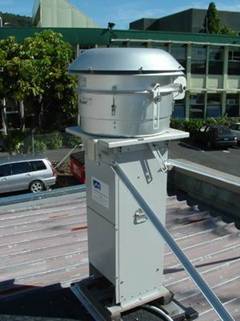
Photo: High volume sampler for Particulate Matter
Results for 2007-08
Water Street
Monitoring results from the PM10 high volume sampler in Water Street indicate that the standard was not exceeded at this site during the 2007-08 sampling period. The 24 hour period results are shown in the graph below.
Robert Street
In previous years, results from the Robert Street site in Whangarei have shown the occasional elevated result during the winter months, when emissions from domestic wood-fired heaters have accumulated under atmospheric inversions. However, during the 2007-08 sampling period, the winter months were warmer and windier than in previous years and peak concentrations did not exceed the National Environmental Standard on any occasion. The three month data gap evident in the graph below occurred following water damage to the air quality analyser during a severe storm in July 2007.
![]()
Summary of Whangarei City
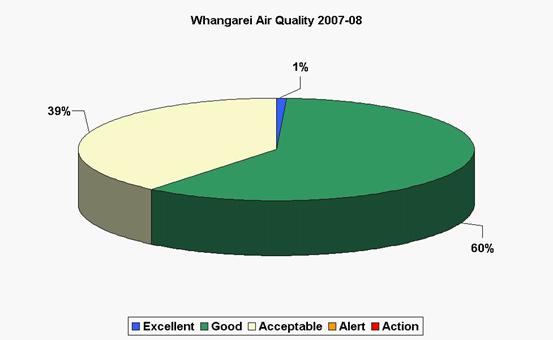
In addition to comparing results to the National Environmental Standard for PM10, another method of reviewing the results obtained from air quality monitoring is to compare them to the environmental performance criteria developed by the Ministry for the Environment, as shown in the table below.
| Category | Value relative to guideline | Comment |
| Excellent | Less than 10% of the guideline | Of little concern, if maximum values are less than a tenth of the guideline, average values are likely to be much less |
| Good | Between 10% and 33% of the guideline | Peak measurements in this range are unlikely to affect air quality |
| Acceptable | Between 33% and 66% of the guideline | A broad category, where maximum values might be of concern in some sensitive locations but generally they are at a level which does not warrant dramatic action |
| Alert | Between 66% and 100% of the guideline | A warning level, which can lead to the guideline being exceeded if trends are not curbed |
| Action | More than 100% of the guideline | Exceeding the guideline is a cause for concern and warrants action if it occurs regularly |
Results for central Whangarei for the 2007-08 sampling period show that air quality is excellent, good or acceptable for almost 100% of the time, however there can be periods where cool, calm conditions allow the concentration of pollutants to build up. These results can be seen in the graph below.
Results for Donald Road
Results obtained from the monitoring station at Donald Road in Kaitaia show that levels of PM10 in the Kaitaia airshed are much lower than levels recorded in the Whangarei airshed. The annual average PM10 results for Kaitaia were 6 mg/m3 in 2007-08, compared to 16 mg/m3 in Whangarei city.
The sampler at Donald Road also measures PM2.5 (particulate matter of 2.5 microns diameter). PM10 is derived from a variety of sources including combustion, wind blown dusts and some sea salt and pollens whereas PM2.5 is almost exclusively sourced from combustion sources. By subtracting PM2.5 from PM10, it is possible to gain some insight into possible sources of PM10 at different times of the year within the Kaitaia airshed.
The plot below shows the difference between the two measurements. From the plot, it can be seen that the highest values of PM10 occur in late summer. This is because the dry, windy conditions towards the end of summer correspond with an increase in wind blown dusts and pollens, while major combustion sources including domestic home heating are virtually non-existent during this time. Conversely, during the winter (particularly August) the difference between PM10 and PM2.5 is very small – this is because most of the fine particles in the air at this time of the year are derived from domestic home heating, which consists almost entirely of particles below 2.5 microns in diameter.
This sort of information can be very useful for air resource managers as it assists with targeting policies or strategies towards specific problem areas. This enables the Council to maximise the use of limited resources to improve air quality and therefore the health and wellbeing of residents in local communities.
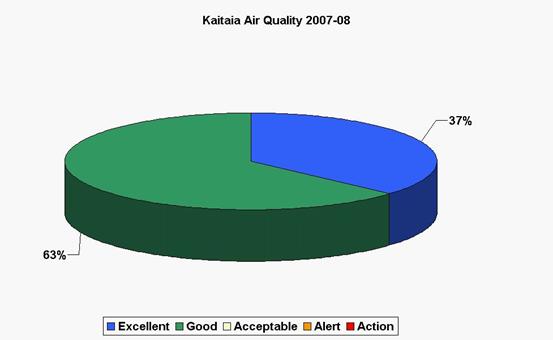
Summary of Kaitaia
When categorised according to the environmental performance criteria developed by the Ministry for the Environment, it is easy to see the relatively better air quality in Kaitaia compared to Whangarei during 2007-08. In Kaitaia, PM10 levels are good or excellent for approximately 96% of the time, compared to Whangarei. The graph below displays the results for Kaitaia from the 2007-08 sampling period.