River Water Quality Monitoring Network
Within this section…
Our regional River Water Quality Monitoring Network (RWQMN) involves the monitoring of water quality and macroinvertebrate biota in an increasing number of rivers around Northland.
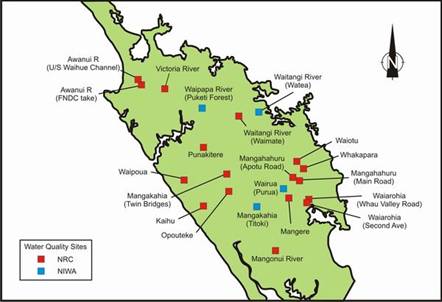
The network currently includes 21 sites on several river systems throughout Northland as shown on the map below, of which four sites are part of the National River Water Quality Network monitored by National Institute of Water and Atmospheric Research (NIWA) staff. These four sites are Waipapa River in Puketi Forest, Waitangi River at Watea, Mangakahia River at Titoki and Wairua River at Purua. More information about the national network can be viewed on NIWA's website: www.niwa.cri.nz
Three new sites were added to the network in 2005-2006; two sites on Waiarohia Stream in Whangarei to monitor urban impacts on water quality and one site on the Mangahahuru Stream as a background site to the existing site at Apotu Road and to monitor the impacts of forestry on water quality.
Monthly water quality sampling is carried out at each site for a range of chemical and physical parameters, which are shown in the table below. The purpose of the network is to provide information about the general state of Northland's rivers, so that long-term trends can be detected and analysed.
Most results are compared to the New Zealand trigger values for the protection of aquatic ecosystems in the ‘Australian and New Zealand Guidelines for Fresh and Marine Water Quality' (ANZECC 2000), which can be accessed in the publications section of the Ministry for the Environment's website: www.mfe.govt.nz
It is important to note that the trigger values are used to assess the risk of adverse effects on the ecosystem and when results are outside trigger values further investigation is required to determine whether there is adverse effects on the environment and to what extent. There are two sets of trigger values; one for upland rivers, which only includes one site in the network (Waipoua River), and for lowland rivers as shown in the table below.
Levels of the indicator bacteria Escherichia coli (E. coli) are compared to the ‘Microbiological Water Quality Guidelines for Marine and Freshwater Recreational areas' (see the recreational bathing water quality section of this report) and the commonly used minimum for dissolved oxygen is 6 mg/L (see section 7 of the ‘Regional Water and Soil Plan for Northland').
| Parameter | Guideline trigger values (NZ lowland rivers) | Guideline trigger values (NZ upland rivers) |
| Temperature (Degrees Celsius) | - | - |
| Dissolved oxygen (mg/L) | > 6* | > 6* |
| Dissolved oxygen (% Saturation) | 98 - 105 | 99 – 103 |
| Conductivity (mSm) | - | - |
| Water clarity (m) | > 0.6 | > 0.8 |
| Turbidity (NTU) | < 5.6 | < 4.1 |
| E. coli (n/100mL) | < 126^ | < 126^ |
| Dissolved reactive phosphorus(mg/L) | < 0.01 | < 0.009 |
| Total phosphorus (mg/L) | < 0.033 | < 0.026 |
| Ammoniacal nitrogen (mg/L) | < 0.021 | < 0.01 |
| Total nitrogen (mg/L) | < 0.614 | < 0.295 |
| pH | 7.2 – 7.8 | 7.3 – 8.0 |
* accepted level of dissolved oxygen (mg/L)
^ E. coli guideline for recreational bathing in freshwater
The regional River Water Quality Monitoring Network began in 1996, so the Regional Council now has enough data for most rivers to begin looking for long-term trends in water quality.
Stream macroinvertebrate monitoring is carried out at each RWQMN site once a year during summer. A summary of the 2005-2006 results are presented in this report.
In the 2006-2007 financial year three additional sites will be added to the network:
- Ruakaka River at Flyger Road;
- Waiharakeke Stream in Moerewa; and
- Kaeo River downstream of Kaeo township.
These sites will help to fill a gap in the network for shorter easterly flowing rivers. Also extra sampling will be carried out at selected sites to investigate ongoing elevated or unusual results such as the high phosphorus levels in Opouteke River or sites that have consistently poor water quality such as Mangere River.
Water Quality Results
Rivers have been ranked for 2005-06 by listing each in order for the range of parameters, from best to worst (ie. highest to lowest water clarity, or least to most nitrogen).
The order of the sites from overall best water quality to worst is very similar to last financial year with Waipoua River ranked the best and Mangere River the worst.
Also similarly to 2004-2005 the ranking of sites is linked to catchment land use, with the best sites having catchments dominated by native forest, moving through to sites with a mix of forestry, native forest and agriculture, to the worst sites being those with their catchment dominated by intensive agriculture land use. Some sites have been shown with equal ranking, as it was difficult to differentiate between them, which one was in better condition.
| Ranking | Site | River system | Land use |
| 1 | Waipoua River | Waipoua | Native forest |
| 2 | Victoria River | Victoria/Awanui | Agriculture/native forest |
| 3 | Waipapa River | Waipapa | Native forest |
| 4 | Mangahahuru at Main Road | Wairua | Forestry |
| 4 | Opouteke River | Wairua/Mangakahia | Forestry/native forest |
| 6 | Kaihu River at gorge | Wairua | Agriculture/forestry |
| 7 | Mangakahia at Twin Bridges | Wairua/Mangakahia | Agriculture/forestry |
| 7 | Waitangi at Waimate North | Waitangi | Agriculture/native forest |
| 9 | Waitangi at Watea | Waitangi | Agriculture/native forest |
| 10 | Whakapara River | Wairua | Agriculture |
| 11 | Waiarohia at Second Ave | Waiarohia | Urban |
| 11 | Awanui at FNDC water take | Victoria/Awanui | Agriculture |
| 13 | Mangakahia at Titoki | Wairua/Mangakahia | Agriculture |
| 14 | Mangahahuru at Apotu Rd | Wairua | Agriculture |
| 14 | Waiarohia at Whau Valley Rd | Waiarohia | Agriculture/native forest |
| 16 | Punakitere River | Punakitere | Agriculture |
| 17 | Waiotu River at SH1 | Wairua | Agriculture |
| 18 | Awanui at Waihue Channel | Victoria/Awanui | Agriculture |
| 18 | Manganui River | Manganui | Agriculture |
| 20 | Wairua River at Purua | Wairua | Agriculture |
| 21 | Mangere River at Knights Rd | Wairua | Agriculture |
This report presents a summary of the 2005-2006 water quality results for each of these sites. Graphs for each parameter at each site are available on the following pages. A summary of the long term trend analysis is also available to view.