Rainfall
Within this section…
Topographical variation across Northland causes rainfall distribution patterns to differ considerably over relatively small areas. As a consequence, the hydrological team maintains an extensive rainfall-monitoring network supplemented by NIWA and MetService rainfall sites.
Northland experiences high intensity rainfall associated with the passage of tropical or sub-tropical storms that pass over Northland from November to March. These summer cyclone and thunderstorm events give rise to very high intensity rainfalls, leading to sudden flooding. Such rainstorms can yield up to 100 to 150 mm of rainfall per hour.
The MetService provides Regional Councils with frequent warnings of approaching potentially adverse weather systems. From July 2005 to June 2006 thirteen severe weather warnings were issued, compared to a total of six warnings issued in 2004-2005. Three severe weather warnings produced significant flooding in various parts of the region.
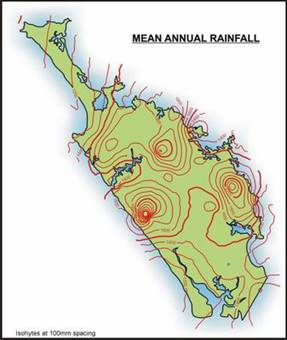
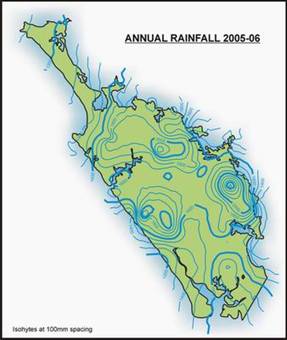
The annual rainfall totals for 2005-2006 varied between 78% and 130% of the mean annual rainfall. Compared to 2004-2005 where annual rainfall varied between 50% and 92%. The maps below show a comparison of the mean annual rainfall for Northland (in mm) on the left and the annual rainfall amounts for 2005-2006 on the right. The 2005-2006 annual rainfall patterns match very close to the expected annual rainfall amounts.
Northland experienced a range of climatic patterns during the year varying from a record dry August, a dry November and February to very wet conditions in July, January, March April and May.
During winter there were extremes in weather patterns. In July, high rainfall intensities between 35 mm/hr and 53 mm/hr were recorded at Puhipuhi and Mangawhai (Tara) as a result of a slow moving northerly front. Conversely, August was the driest since 1981, receiving only 43% of the expected rainfall. More information on the hydrological conditions in July and August 2005 is documented in case study one (refer page 12).
Spring weather conditions were marked by a whole range of climatic conditions such as intense thunderstorm activity, hail storms, gale force winds, stormy seas, elevated spring tides, flood warnings and low rainfall amounts recorded for November. During mid September a series of storm events over 5 days produced gale force winds of 100 km/hr with gusts to 140 km/hr recorded at Cape Reinga. The Barometric pressure recorded at Dargaville dropped to 983hPa causing elevated spring tides. Minor flooding was experienced at Dargaville. Localised thunderstorms associated with hail and intense rainfall developed in the southern areas near Hakaru, Mangawhai and Kaiwaka. More information on the hydrological conditions that occurred in spring is documented in case study two (refer page 13).
During December rainfall amounts were slightly below normal. Two north easterly fronts produced isolated, heavy rainfall during mid December and late January. There was a relatively stable period of fine weather between these events. February was relatively dry where rain fell over an average of 6 days during the month.
Northland experienced a wet autumn, commencing with two severe weather warnings issued by MetService during March. The remnants of Cyclone Whati brought storm force easterly winds and persistent rain to the Northland region over two days. Well above average rainfall was recorded for April with rain falling over 22 days during early, mid and late April. On 24 April, intense rainfall of up to 112 mm over six hours and a maximum of 34 mm/hr caused severe flooding on SH1 at Rangiahua and SH10 at Kaeo. Flood warnings were issued. May was also wet, with rain falling over 22 days. By contrast, June rainfall was below normal, however, frequent cold southerly winds were predominant bringing very cold conditions to the region. More information on the hydrological conditions in autumn is documented in case study three (refer page 15).
The figures on the next page show the mean monthly rainfall in 2005-06 (blue bar) compared to the historical mean monthly rainfall (red line) for various areas in Northland.
River Flows
Northland is characterised by a large number of small catchments and short, meandering streams of gentle slope. Most of the major rivers flow into estuarine environments rather than directly to the open coast. These rivers and streams play an important role in Northland, often providing water for stock, industry and domestic use.
Climate and geology influence the flow regimes of Northland's rivers. Northland's marked seasonal rainfall pattern is reflected in the broad pattern of higher flows during winter months and lower flows during summer months. Most rivers flow at only 10 - 20% of their yearly average flow in summer.
Droughts occur as a result of lower than usual rainfall causing prolonged periods of unusually low river-flow. During drought months (most typically January to March) more accurate monitoring of stream flow is undertaken to establish levels at which water use restrictions may occur.
Northland rivers in 2005-2006 were characterised by below average monthly flows during August, September, November and December. Lower flows were recorded in the far north areas compared to elsewhere. From January through to June, river flows were generally average or above average as shown in the figures below. The figures on the next page show the mean monthly flow in 2005-06 (blue bar) compared to the historical mean monthly flow (red line) for various rivers in Northland.