Introduction
Within this section…
Northland Regional Council operates a 24-hour, seven day incident hotline where people from anywhere in Northland can report environmental incidents to the freephone number 0800 504 639 ranging from water pollution to spraydrift, earthworks to odour problems.
There were 1028 incidents reported to Northland Regional Council in the 2005-06 financial year, which was more than last year. All environmental incidents reported to the Council are recorded in a database including important information such as type, location, details of the incident, alleged offenders, resource affected and impact on the environment, to meet the Council's performance targets for response to environmental incidents. For a map showing the distribution of incidents reported refer to page 2 and for a tabulated breakdown of the incidents and their impact on the environment refer to pages 3 and 4.
Resource Affected
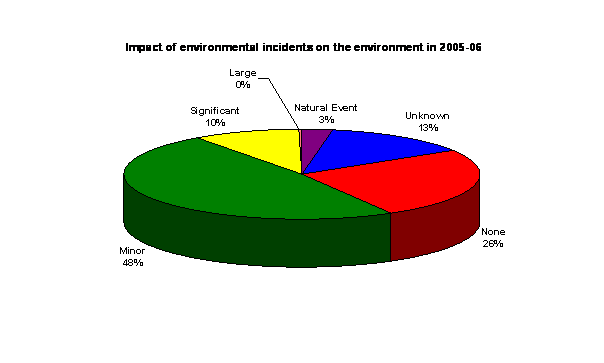
Of the 1028 reported, 458 (45%) were air related incidents. Other incidents were recorded as affecting inland waters (252 incidents), land (135 incidents), coastal marine areas, coastal waters, groundwater or the riparian management zone, as shown in the figure below.
There were only two environmental incidents reported as affecting groundwater resources, which is why it is shown as 0% on the graph above.
Distribution of Incidents
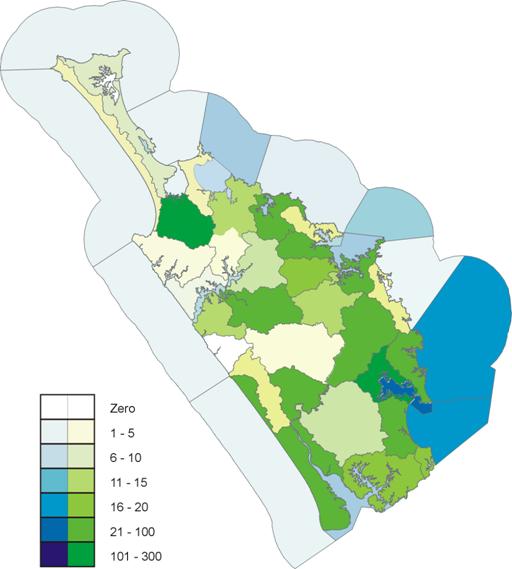
The map below shows the distribution of incidents throughout Northland, where the darker the blue or green the greater number of incidents for that area. Whangarei had the highest occurrence of incidents with 377, while one incident was reported for Parengarenga Harbour, Whangaroa Harbour, Ngunguru Harbour and Mangawhai Harbour areas. The high number of incidents in the Whangarei area is related to the urban nature of the catchment and greater population density.
Different Incident Types
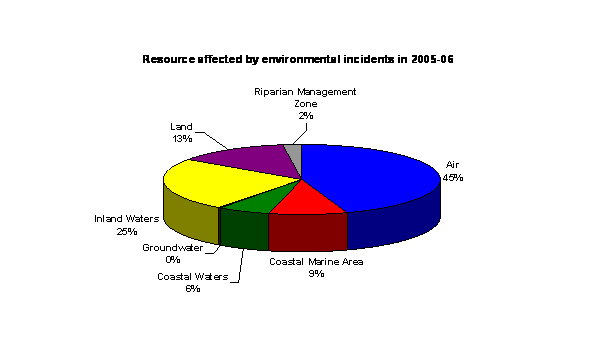
The table below shows the different types of incidents reported in terms of numbers and percentage of the total 1028 incidents.
Burning and smoke nuisance incidents were by far the most common incidents in Northland, however this may be related to the fact that people are more likely to notice and/or be affected by a smoke nuisance than other incident types. With odour, sewage and earthworks/vegetation clearance incidents being the next most common incidents reported.
| Incident Type | Number | Percentage |
| Abrasive Blasting | 2 | 0.2 |
| Burning & Smoke Nuisance | 220 | 21.4 |
| Contaminated Stormwater | 28 | 2.7 |
| Dead or Dying Organisms | 13 | 1.3 |
| Dead Stock | 18 | 1.8 |
| Discolouration & Foams/Scums in Water | 37 | 3.6 |
| Diversion & Drainage Works | 11 | 1.1 |
| Dust Nuisance | 35 | 3.4 |
| Earthworks & Vegetation Clearance | 87 | 8.5 |
| Farm Dairy Effluent | 16 | 1.6 |
| Flooding Hazards & Erosion | 15 | 1.5 |
| Hazardous Substances | 12 | 1.2 |
| Industrial Emissions | 52 | 5.1 |
| Miscellaneous | 22 | 2.1 |
| Natural Phenomena | 6 | 0.6 |
| Odour | 99 | 9.6 |
| Oil, Diesel & Other Fuel Spills | 35 | 3.4 |
| Other Agency Responsible | 3 | 0.3 |
| Other Coastal Activities | 35 | 3.4 |
| Other Contaminant Discharges | 45 | 4.4 |
| Other Water Pollution | 14 | 1.4 |
| Refuse & Other Dumping | 43 | 4.2 |
| Sewage | 95 | 9.2 |
| Spraydrift | 50 | 4.9 |
| Structures in Waterbodies/CMA | 28 | 2.7 |
| Water Abstractions | 7 | 0.7 |
| TOTAL | 1028 | 100.0 |
Impact on the Environment
The impact of every incident on the environment is categorised and reported to the Council on a monthly basis. Of the 1028 incidents reported to the Council in 2005-06, the majority of incidents (48%) were recorded as having a minor impact on the environment, which means that effects were localised and/or short-lived with non-significant deterioration of the environment. On the other hand 99 incidents (10%) had a significant impact and a further 4 had a large impact on the environment.