September 2023 climate report
5 Oct 2023, 11:20 AM
Summary
- El Niño has been declared for New Zealand with all criteria now being met, there is a 95% chance it will continue throughout Summer.
- Large climate variability is expected between October – December, with a mix of much hotter than expected conditions followed by sharp cold southerly events.
- During October – December temperatures are likely to be “near average” to “above average”.
- Winds are expected to be “above average” in strength.
- Rainfall is forecast to be “below average”.
- During September Northland recorded 107% of the expected rainfall, which was concentrated to the south and west of the region.
- River flows were “below normal” to “low” during September.
- Groundwater levels are varied across the region with “Above Normal” levels in the south, to “low” and “below normal” water levels across the rest of the region.
- Soil moisture is currently at Field capacity with rain causing run off during September.
Climate Outlook
July to September 2023
El Nino was officially declared during September, with atmospheric (Southern Oscillation index) and oceanic climate drivers (NINO Indices) coming fully in sync with each other. There is a 95% chance that El Nino will persist through out summer, peaking with “very strong” El Nino conditions in December – January. Air pressures are likely to be above normal in Northland, which brings with it above normal wind strength. Temperatures between October – December is likely to be “near average” or “above average”, while rainfall, soil moisture and river flows are likely to be “below average” in Northland. However, the climate is likely to have dramatic temperature swings, with periods of above average temperature from dry Australian airflows, followed by sharp cold southerly, between October – December there is likely to be more variability than usually seen in this period.
The Indian Ocean Dipole has developed a positive event, this supresses atmospheric convection across Australasia, In Northland this will result in suppressed moisture availability and lower chances of tropical rain events moving though. At the start of October Northland was experiencing localised marine heatwave conditions. It is expected that between October – December localised marine heatwaves could develop for short periods. For more details, please refer to NIWA’s seasonal climate outlook at: https://niwa.co.nz/climate/seasonal-climate-outlook/seasonal-climate-outlook-october-december-2023.
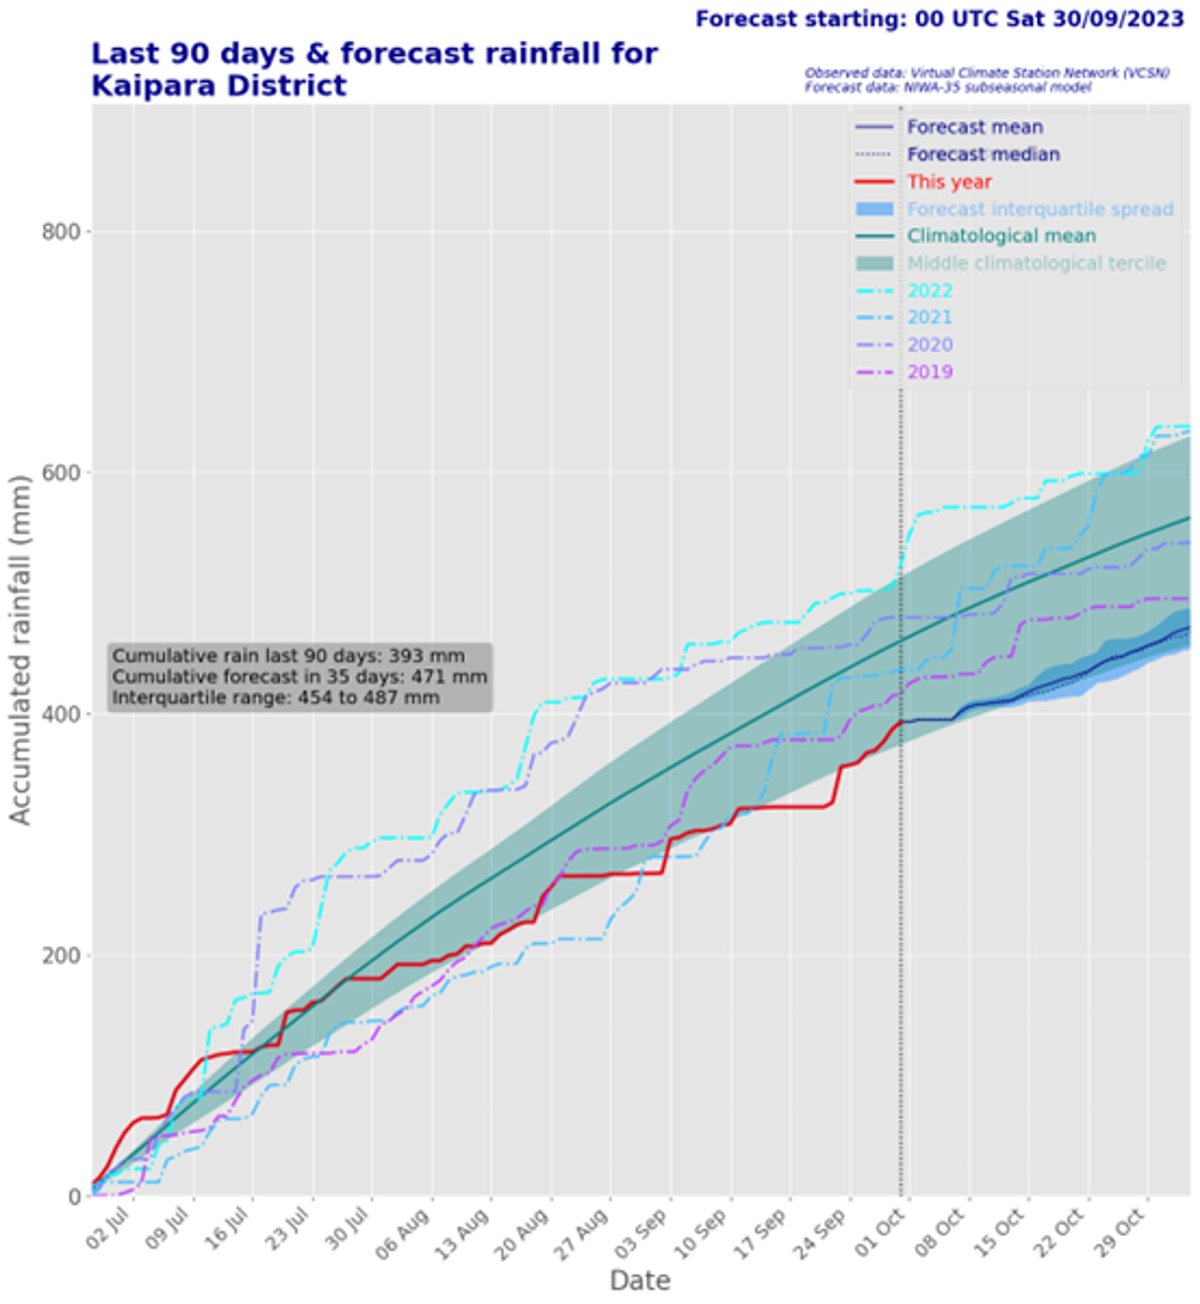
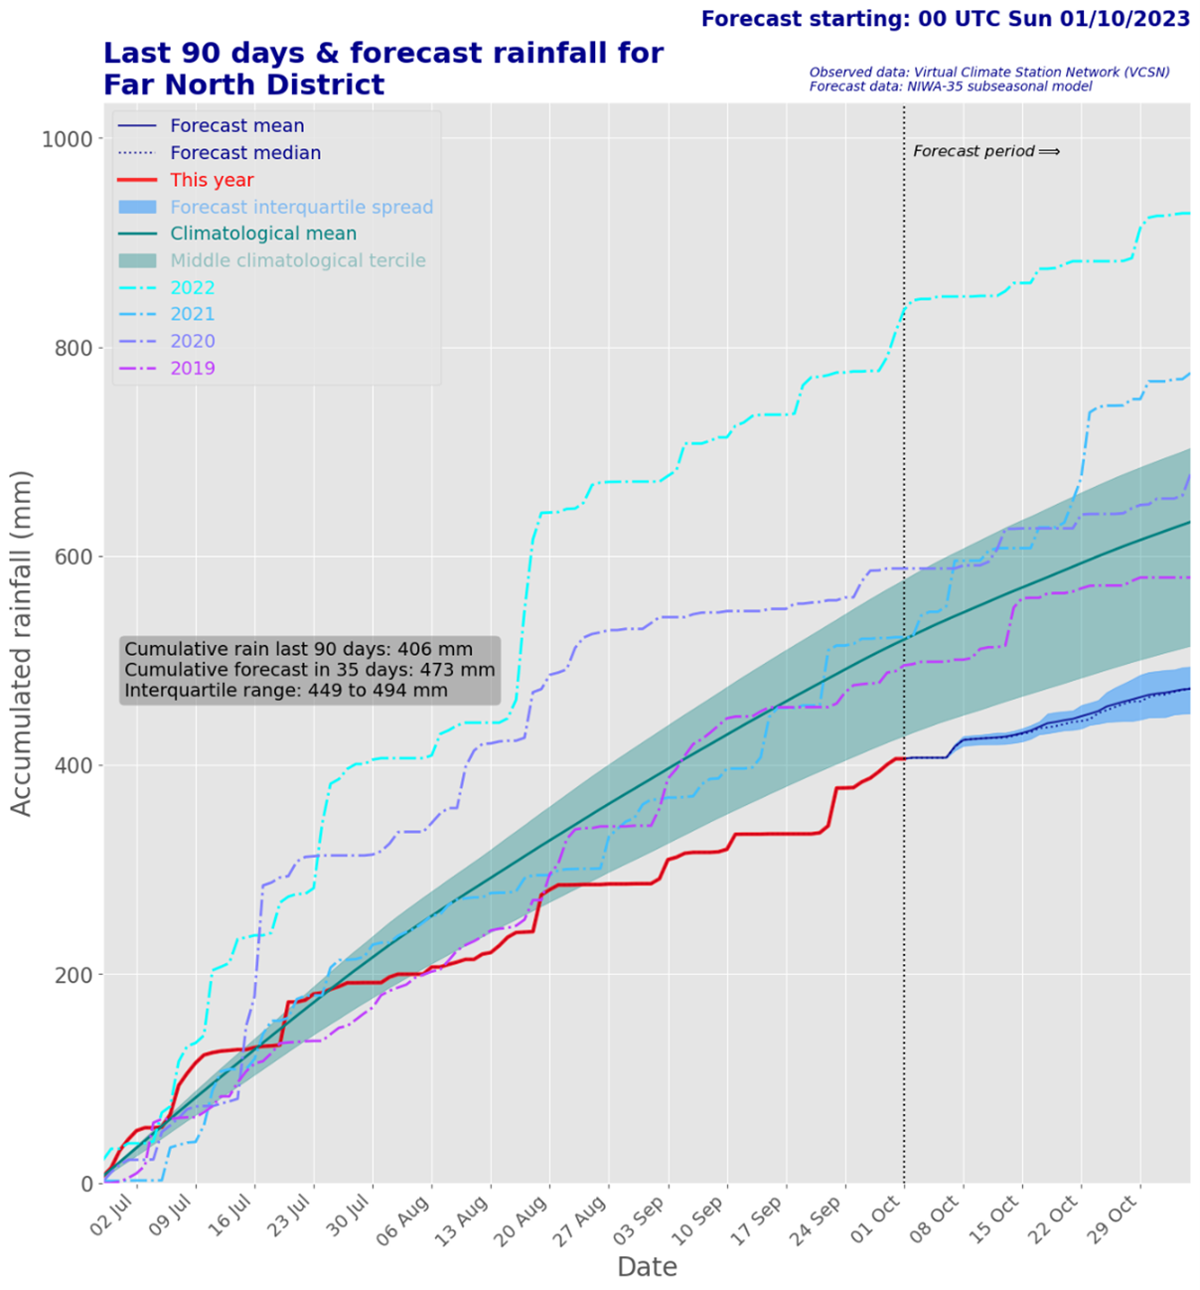
The new Drought and rainfall forecasting tool from NIWA shows that the Whangarei and Far North districts have received below average rainfall between July – September and forecast the rainfall to remain below normal for October. The Kaipara district during the same period sat at the low end of expected rainfall, and through October is expected to receive near average rainfall. For more information see https://shiny.niwa.co.nz/drought-forecast/
NIWA Temperature, Rainfall, Soil Moisture and River Flows probabilities for the period of October to December 2023
(Expressed as % likelihood for either Above Average, Near Average or Below Average conditions).
| Temperature | Rainfall | Soil moisture | River flows | |
| Above average | 40• | 20 | 20 | 15 |
| Near average | 40• | 30 | 35 | 40• |
| Below average | 20 | 50• | 45• | 45• |
NIWA rain forecasting tool showing that during October most of Northland will receive less rainfall than the 5th percentile.
RAINFALL:
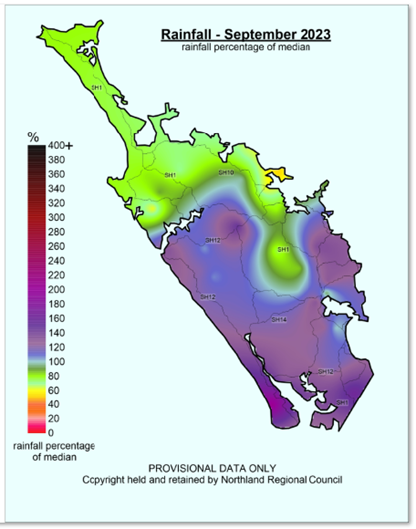
Northland has experienced a mix of conditions for the start of spring. September started out with weeks of showery rain, followed by the middle of the month having fine hot days before the 23rd onwards a few showery events moving through the region. No large events were recorded with the 24.5 mm maximum hourly intensity recorded, at Ngatawhiti Road on the Pouto Penisula. The maximum rainfall was recorded at Waimamaku with 295 mm while the minimum recorded was 70 mm on the Purerua Peninsula, northern Bay of Islands. On average, Northland recorded 139 mm, which is 107 % of what is expected for September. The rainfall mainly came from the southwest, a clear divide along the Maungataniwha Ranges and the Eastern Hills. The highest percentage of rainfall in September was 208% recorded at Ngatawhiti Road, Pouto Point, and 162% recorded at Hakaru, in the south. The lowest percentage was 53% on the Purerua Penisula and 64% in Kerikeri, on the east coast, while on the west coast 61% of the September rainfall was recorded in the North Hokianga.
Rainfall (% of Median) for September 2023 across Northland with a range of 53% to 208%.
Standardised Precipitation index (SPI)
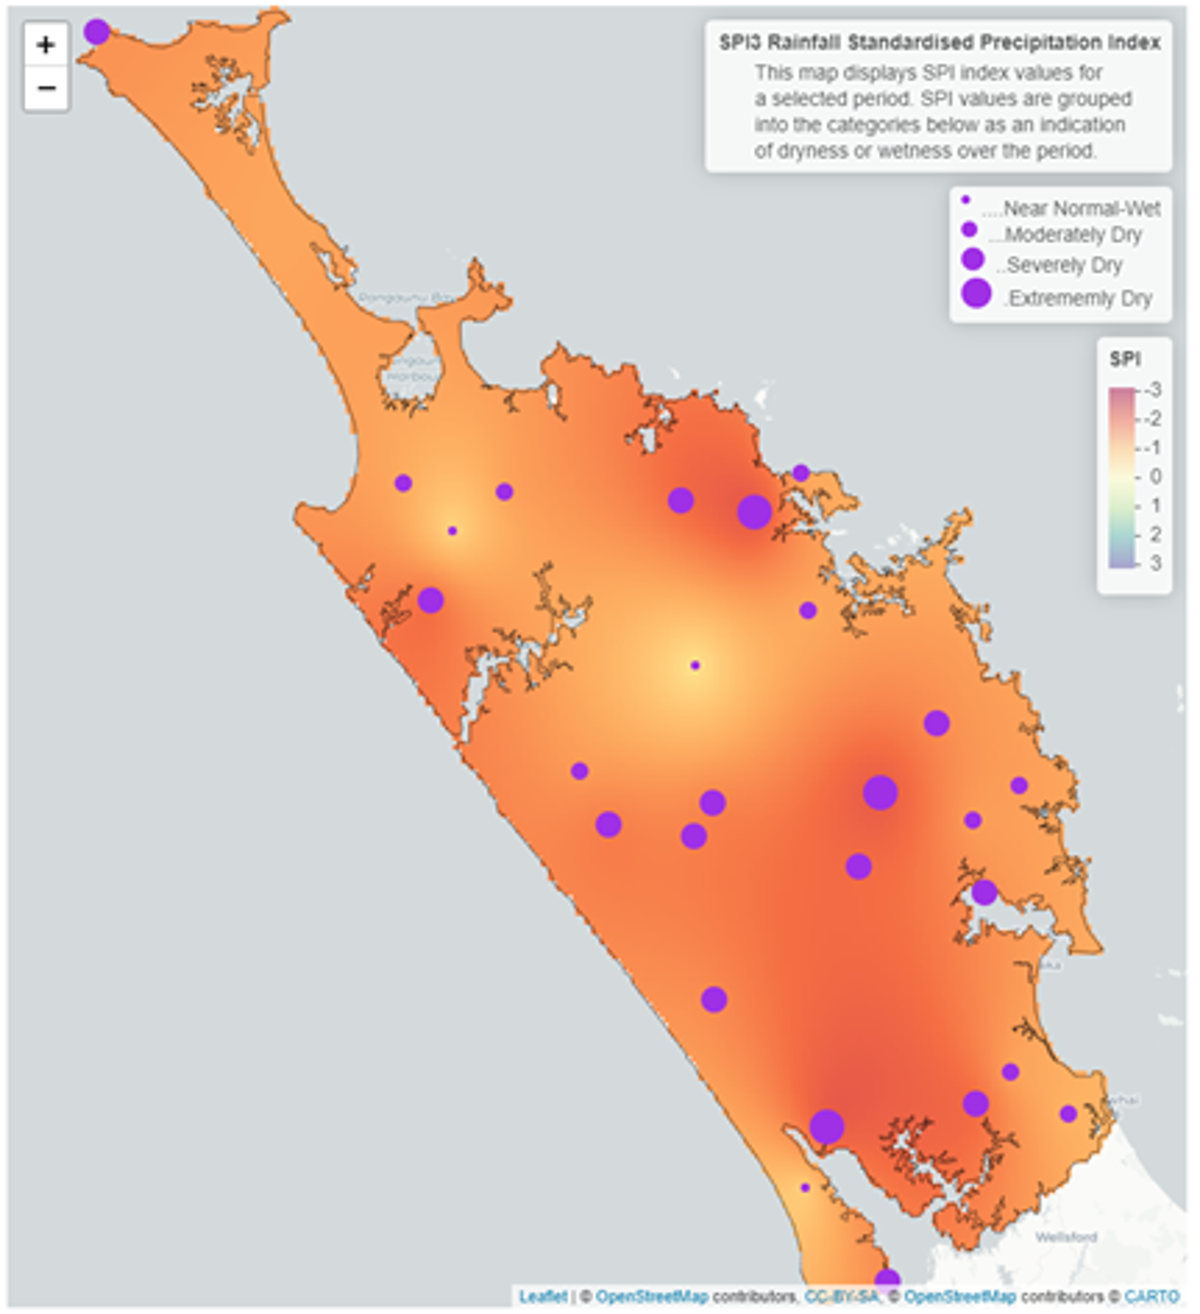
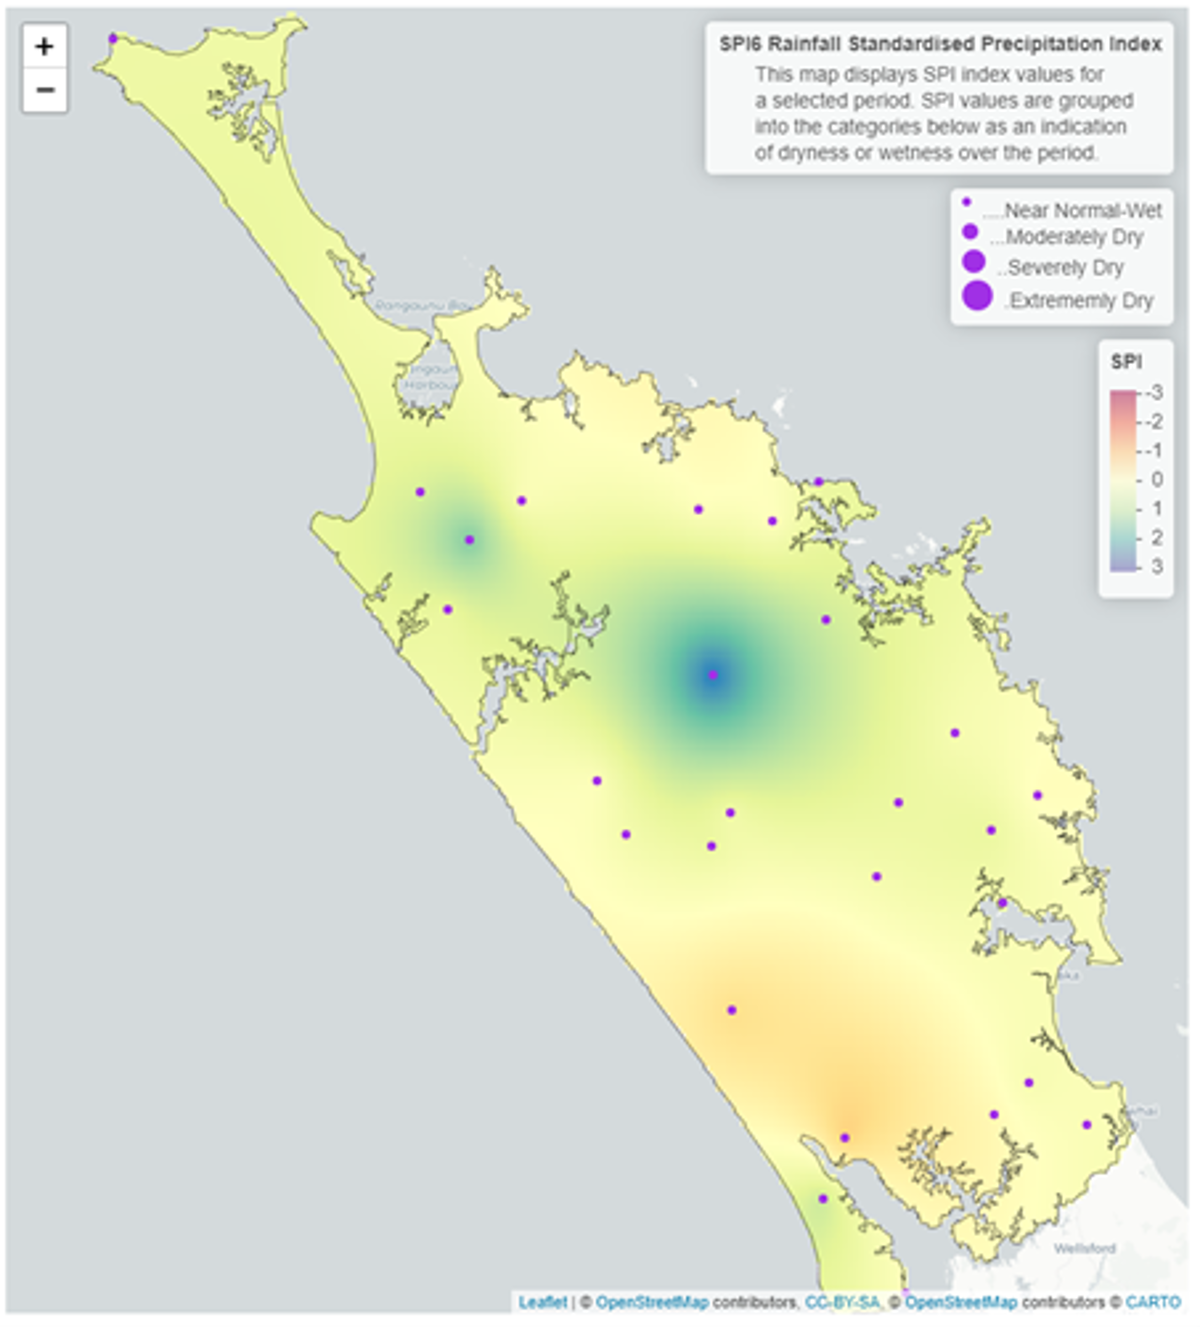
The Standardised Precipitation Index (SPI) on a three-month scale has dramatically changed compared to previous maps in the last year. After “below normal” rainfall for both July and August, followed by a “near average” rainfall accumulation in September, the springtime conditions for most of Northland range from “moderately dry” to “Extremely dry” for this time of year. From April to September, the six-month SPI map, shows that most regions of Northland have received “near normal” rainfall, which explains the particularly high-water table and why many areas however are still particularly muddy.
3-Month SPI (Standardised Precipitation Index) Map for July - September 2023.
River flow
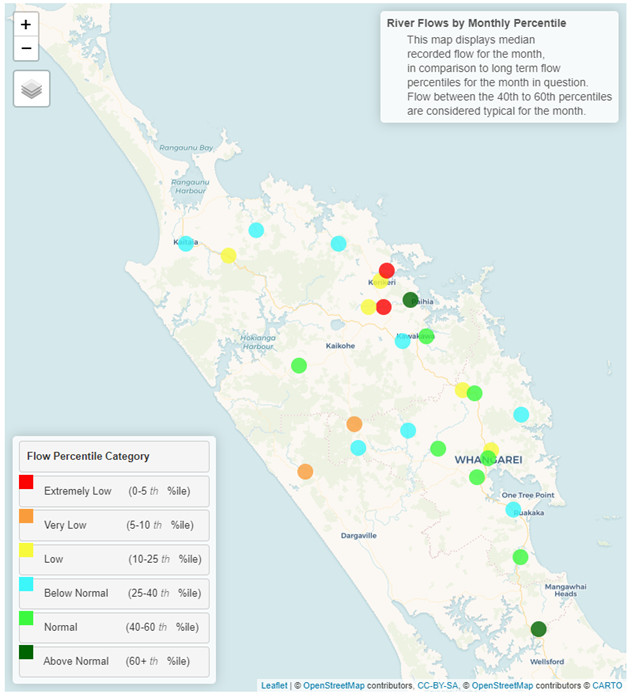
River flows through out September were greatly varied across Northland. The lowest flows, were recorded in the northern Bay of Islands, were “extremely low” for September, this aligns with the lower-than-expected rainfall for the previous three months. Most of the rest of Northland was either “normal” where more rain fell in September, through to “low” in areas with les rainfall. No catchment received any large flood events to boost the overall median, along with below average rainfall for the previous three months, allowing base flows to recede quickly.
Monthly percentile River Flows for September 2023
Groundwater
Ground water levels across Northland are varied with the Mangawhai and Ruakaka aquifers being “Above Normal” and the rest of the region being between “Normal” to “Low” during September. The values are indicative of the rainfall patterns recorded over the last several months, and are beginning to respond to the lower than expected rainfall through July – September after the unprecedented recharge during the first part of the year.
| Aquifer | Status | Percentile |
| Aupōuri | Normal | 40 - 60th |
| Taipā | Low | 10 - 25th |
| Russell | Above Normal | 60th + |
| Kaikohe | Low | 10 - 25th |
| Poroti | Low | 10 - 25th |
| Whangārei | Below Normal | 25 - 40th |
| Mangawhai | Above normal | 60th + |
| Marsden - Ruakākā | Above normal | 60th + |
| Ruawai | Normal | 40 - 60th |
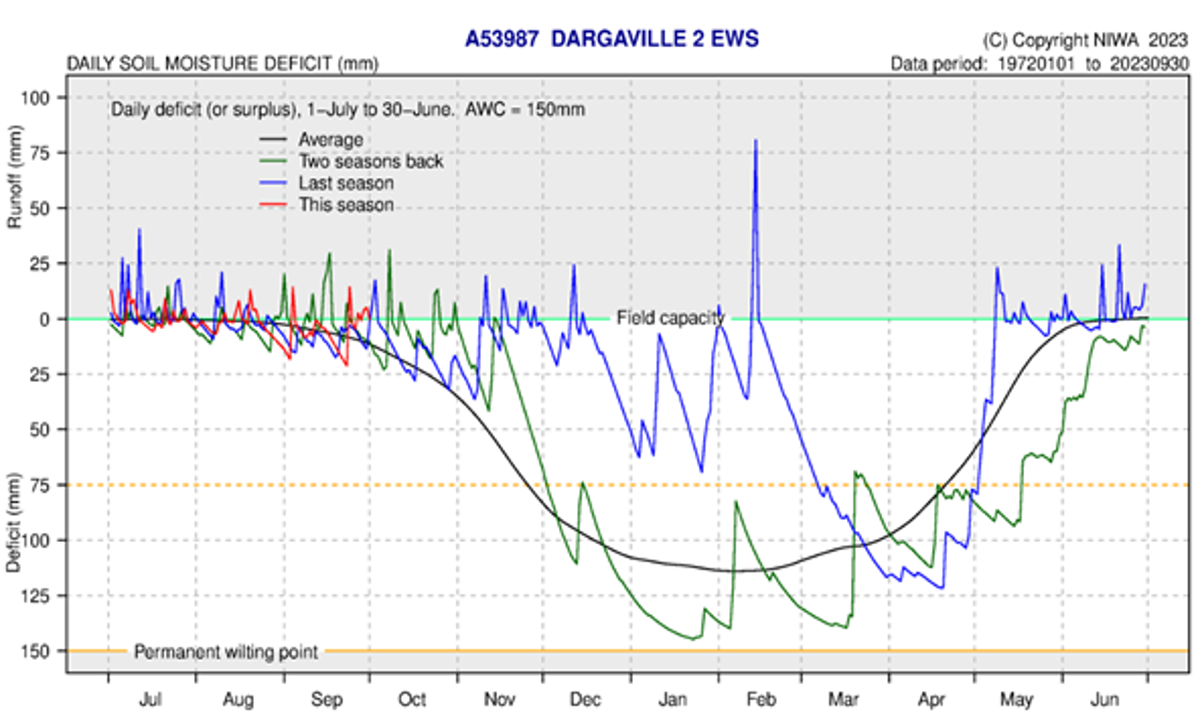
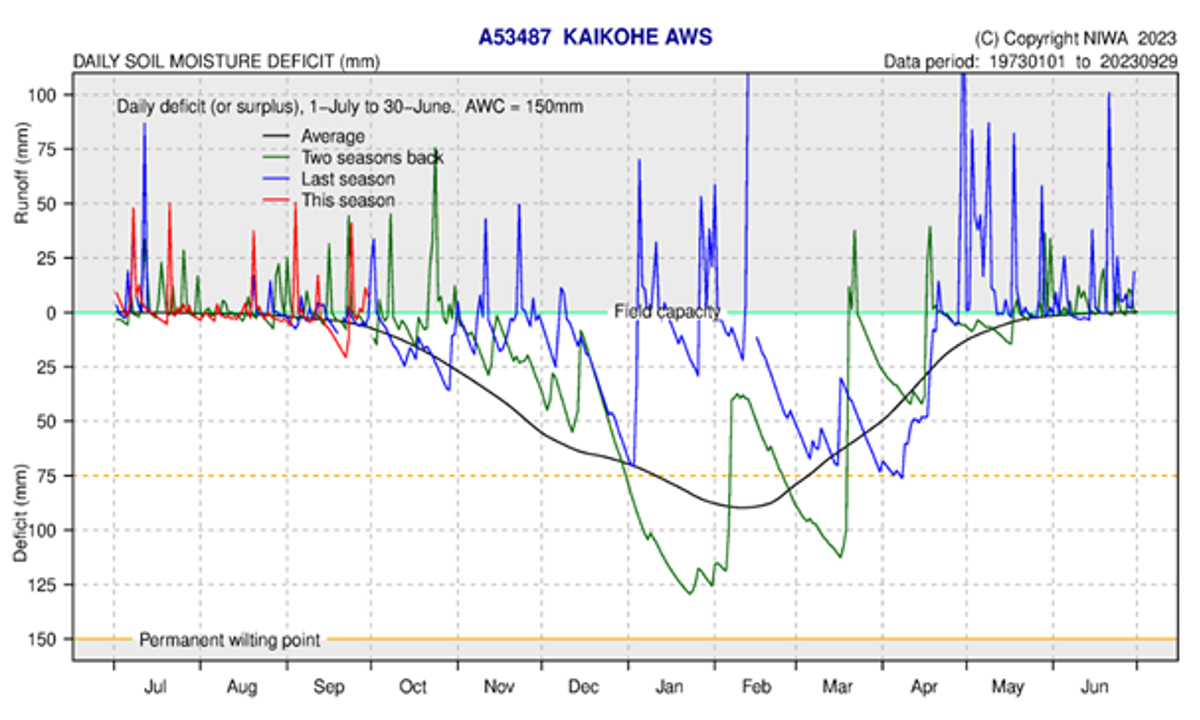
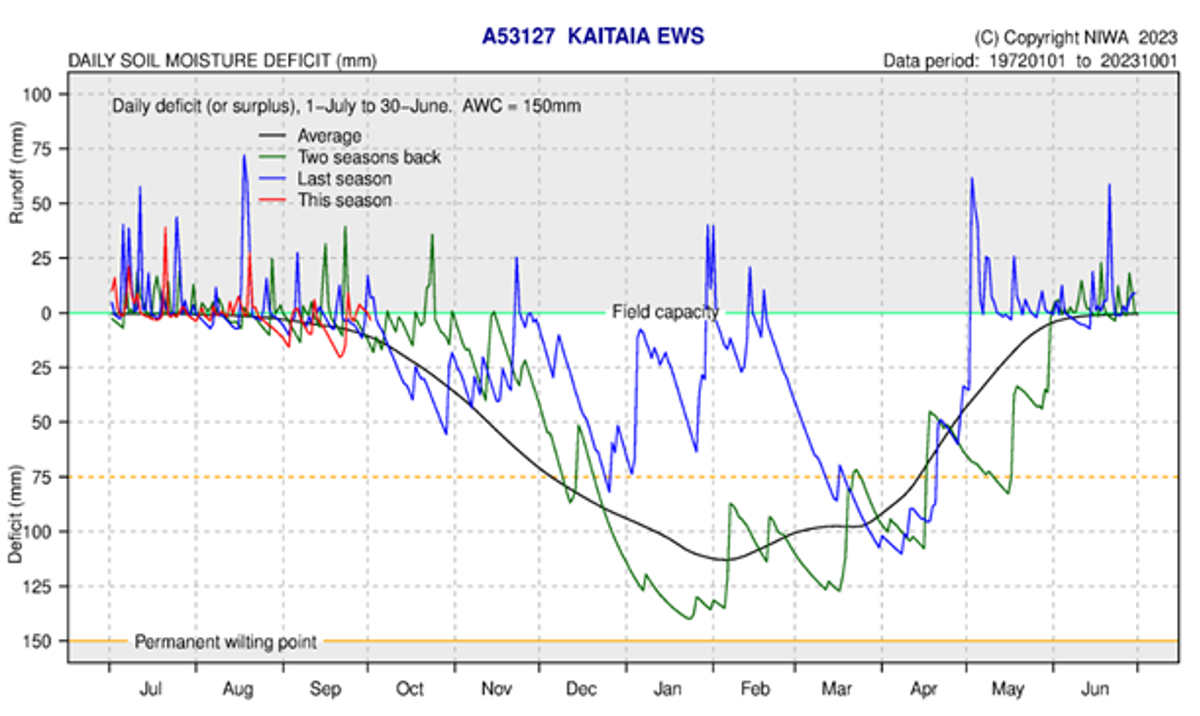
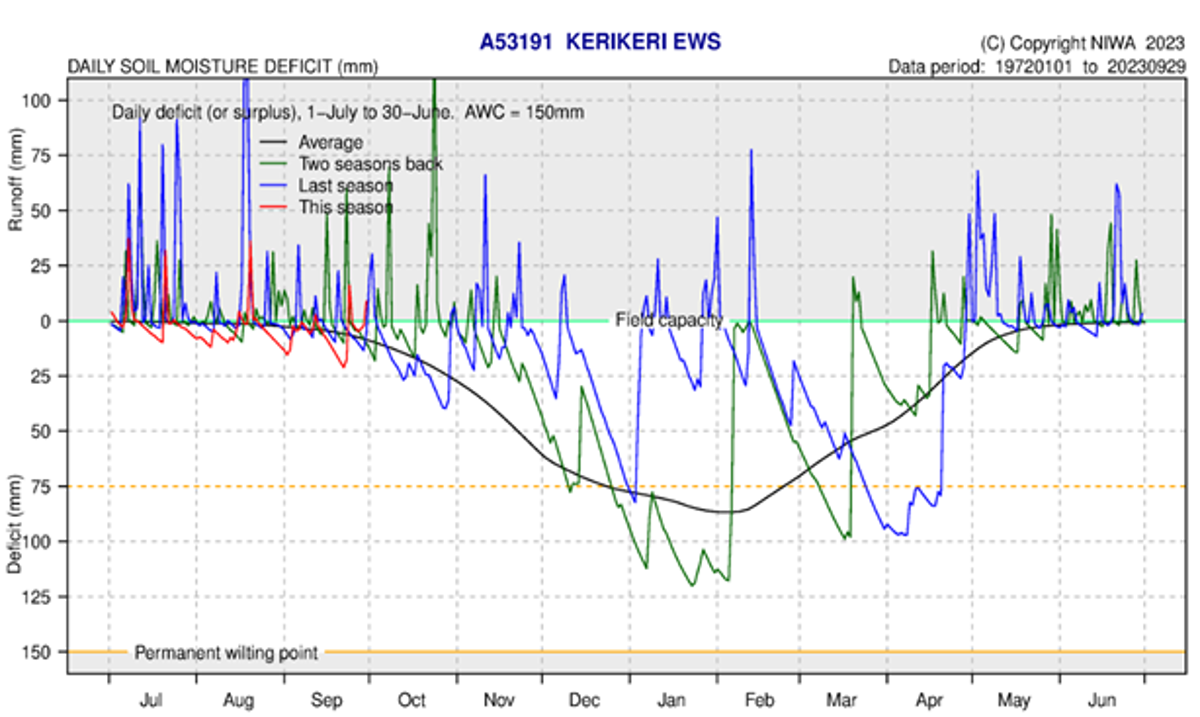
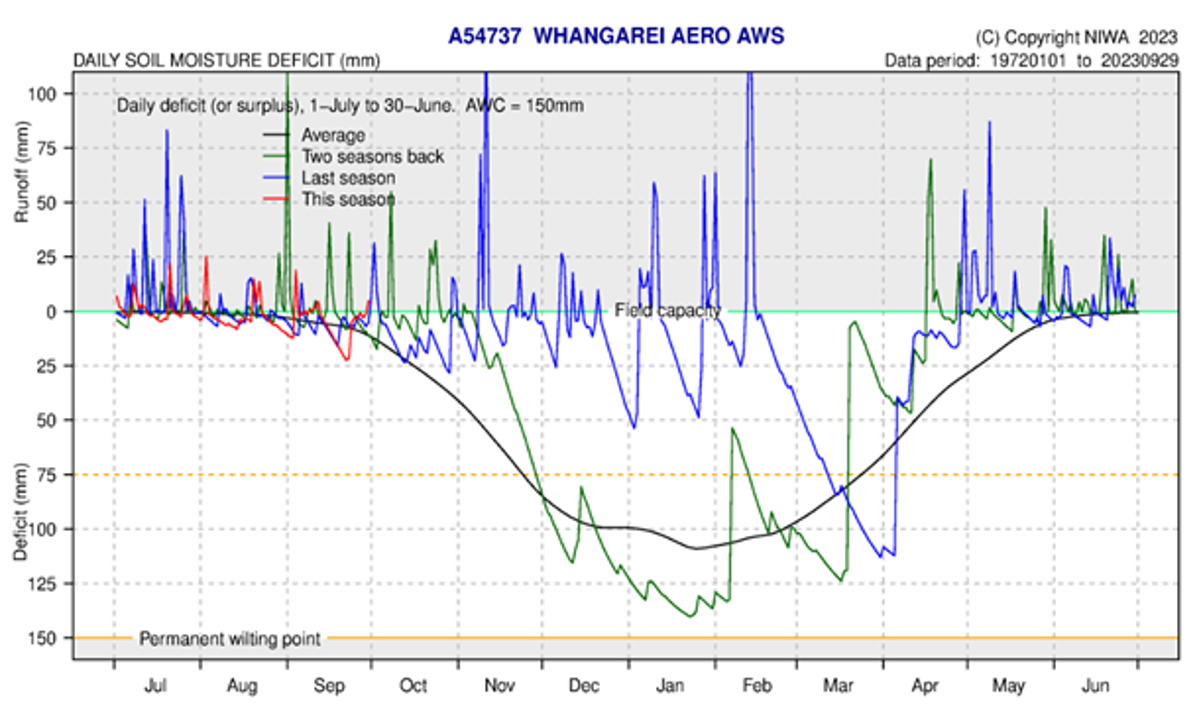
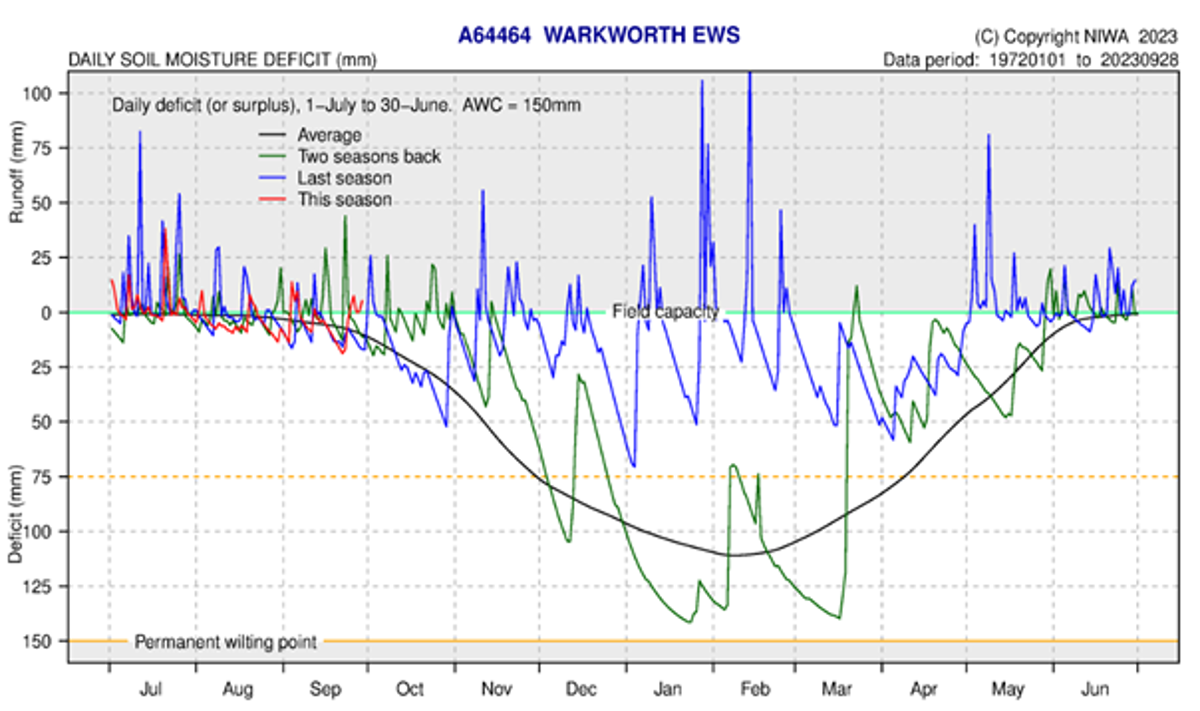
Soil Moisture
Soil moisture levels across Northland were “near average” for September, in comparison to the last two seasons. Several small rainfall events saw between 10 – 50 mm of runoff, while during the dry period in the middle of September 10 - 15 mm of deficit was recorded. This was quickly recovered by the end of the month. At the start of October majority of soils across Northland are at field capacity. The soil moisture deficit is calculated based on incoming daily rainfall (mm), outgoing daily potential evapotranspiration (mm), and a fixed available water capacity (the amount of water in the soil 'reservoir' that plants can use) of 150 mm” (NIWA).