May 2023 climate report
9 Jun 2023, 8:56 AM
Summary
- El Niño Southern Oscillation (ENSO) neutral conditions continued through May but are beginning to trend towards El Niño.
- Between June – August temperatures are expected to be “above average”, while rainfall, river flows and soil moisture are likely to be “near average”.
- During May Northland had more rain than average, with 217% of the region’s average recorded. Most of this was recorded in the Kaikohe catchments.
- Ground water, river flows and soil moisture levels are all “above average” for May.
Climate Outlook
June to August 2023
ENSO conditions have remained in a neutral position but are beginning to trend towards El Niño. It is expected that these conditions will continue to develop in the coming months leading into spring. Sea temperatures however are continuing to be warmer than average and are likely to drive warm moist weather conditions in June, possibly bringing heavy rainfall to Northland. Between June – August temperatures are likely to be near average or above average, while rainfall, soil moisture and river flows are likely to be near average.
For more details, please refer to NIWA’s seasonal climate outlook for June - August 2023:
See the seasonal climate outlook on NIWA's website: niwa.co.nz
NIWA Temperature, Rainfall, Soil Moisture and River Flows probabilities for the period of June to August 2023
(Expressed as % likelihood for either Above Average, Near Average or Below Average conditions).
| Temperature | Rainfall | Soil moisture | River flows | |
| Above average | 45• | 25 | 35 | 30 |
| Near average | 40• | 40• | 40• | 40• |
| Below average | 15 | 35 | 25 | 30 |
Rainfall
May was another wetter than usual month, which was driven by three rainfall events at the beginning of the month and topped up by another rain event at the end of the month.
The rainfall generally came from northeast, with the southern and western areas of Northland being more sheltered. The maximum rainfall was recorded in Kaikohe which had 597mm, while the lowest total was recorded at Kai Iwi Lakes with 179.5 mm.
On average Northland had 320 mm which was 217% of the expected rainfall for May. The majority of this was recorded on the Aupōuri peninsular in the Far North which had 377% of expected rainfall followed by the Kaikohe area with 374%. The lowest percentages of expected rainfall were recorded on the west coast, with Kai Iwi Lakes recording 133%, Dargaville 141%, Ruawai 147% and Tutamoe 150%.
Rainfall (% of Median) for May 2023 across Northland with a range of 377% to 133%
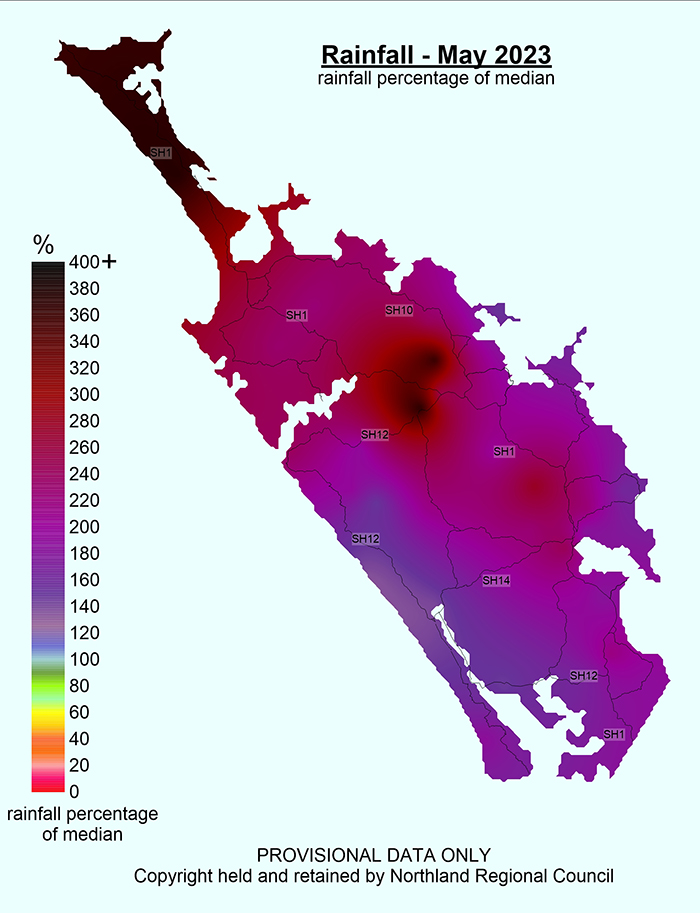
Rainfall (% of Median) for May 2023 across Northland with a range of 377% to 133%.
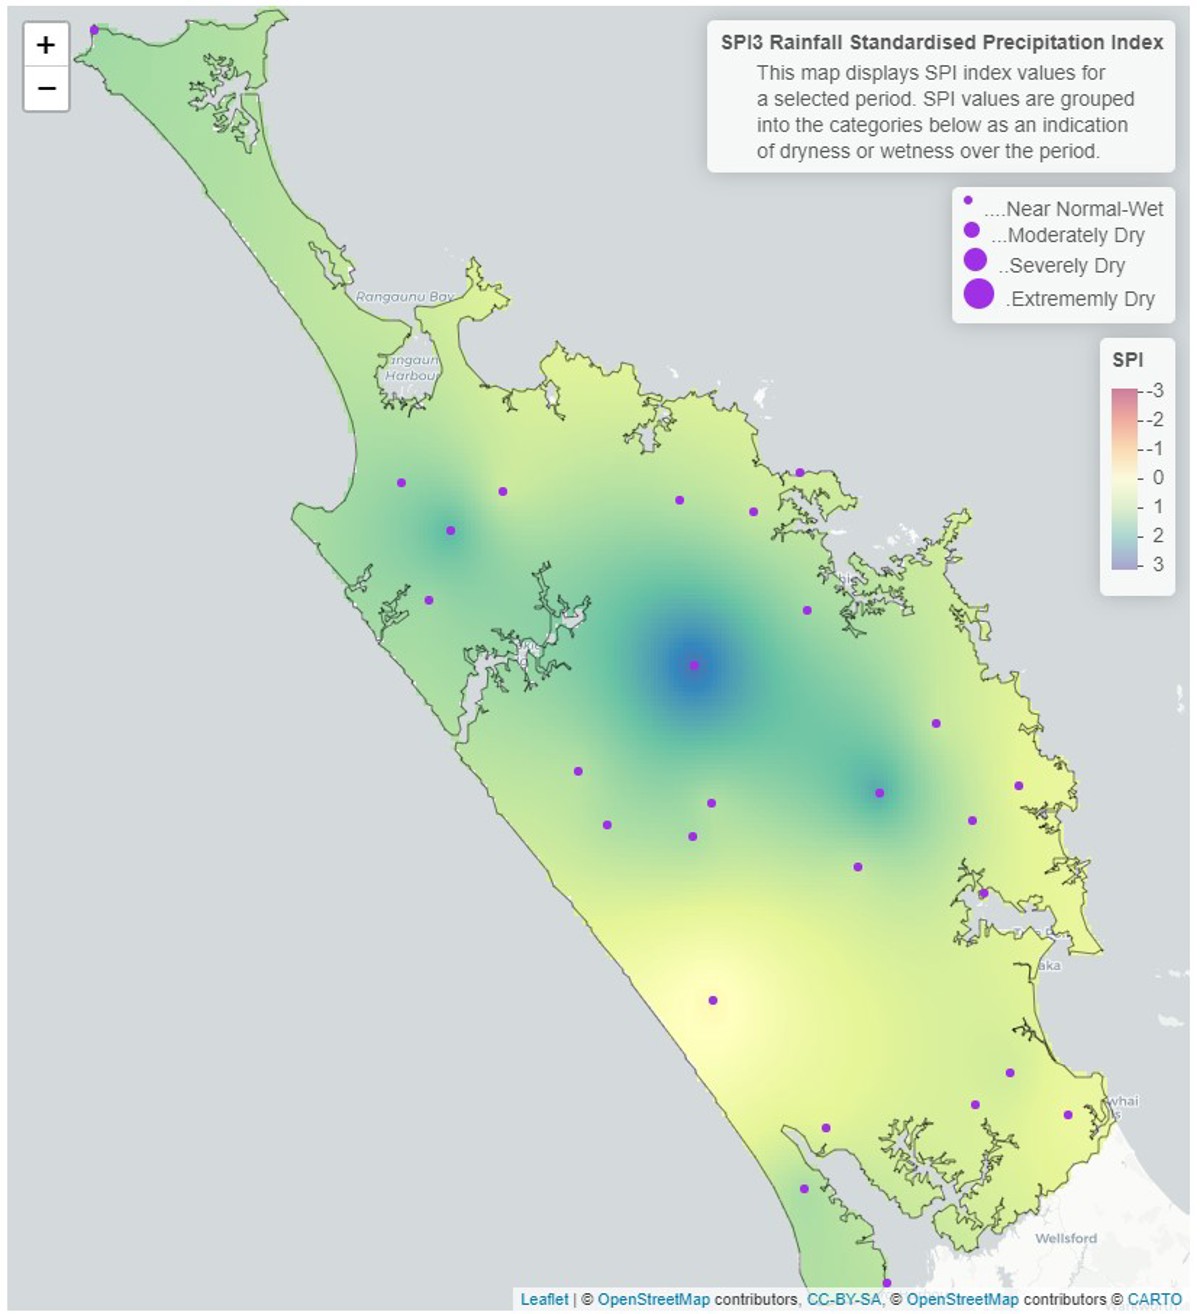
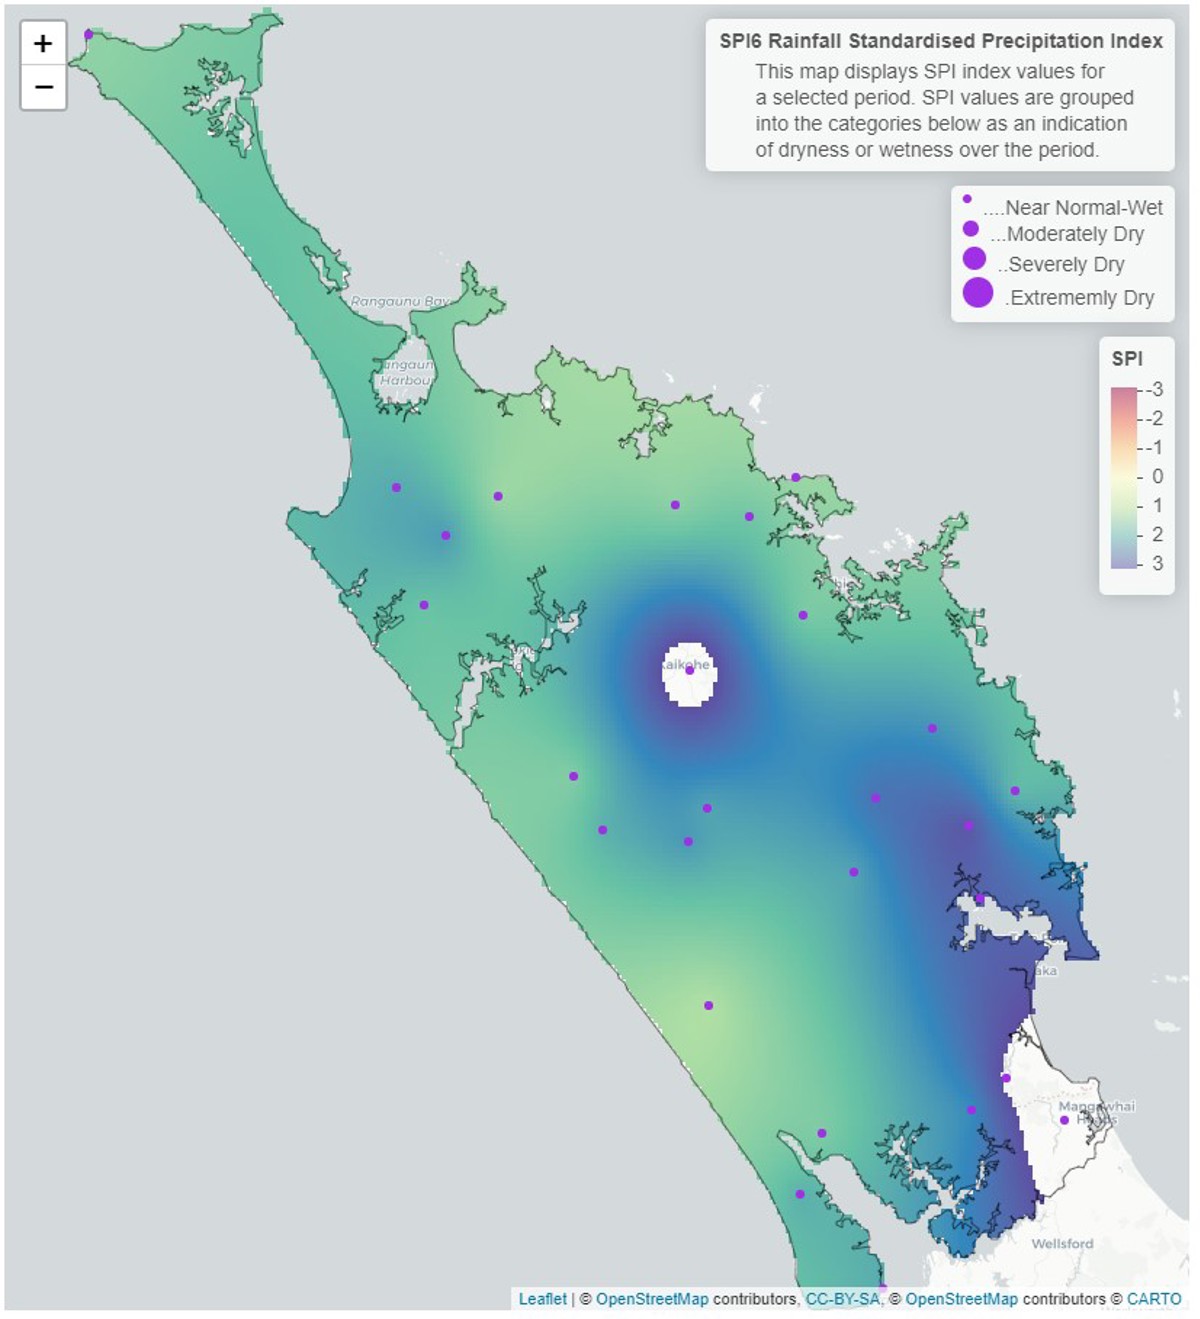
Standardised Precipitation index (SPI)
The Standardised Precipitation Index (SPI) on a three-month scale shows that all of Northland has been “near normal or wet”, with the wettest areas in the centre of the region and close to the expected rainfall around the coast. Over the three-month period the rainfall has averaged to “near normal” by March being much drier than average, while May was wetter than average.
On a six-month scale between December 2022 – May 2023, the standardised rainfall averages Northland to being wetter than normal, with the Kaikohe area and the south eastern corner of the region being extremely wet, with these areas having an SPI score of greater than -3, thus appearing to have no data. The rainfall in these areas have been driven by the thunderstorm in February in the Mangawhai area, Cyclone Gabrielle, and heavy rain events in May in the central area of Northland.
3-month (March-May 2023) and 6-month (Dec 2022-May 2023) SPI maps
River flow
Across Northland River flows are currently “Above Normal”, following on from higher-than-expected rainfall during May.
Monthly percentile River Flows for May 2023
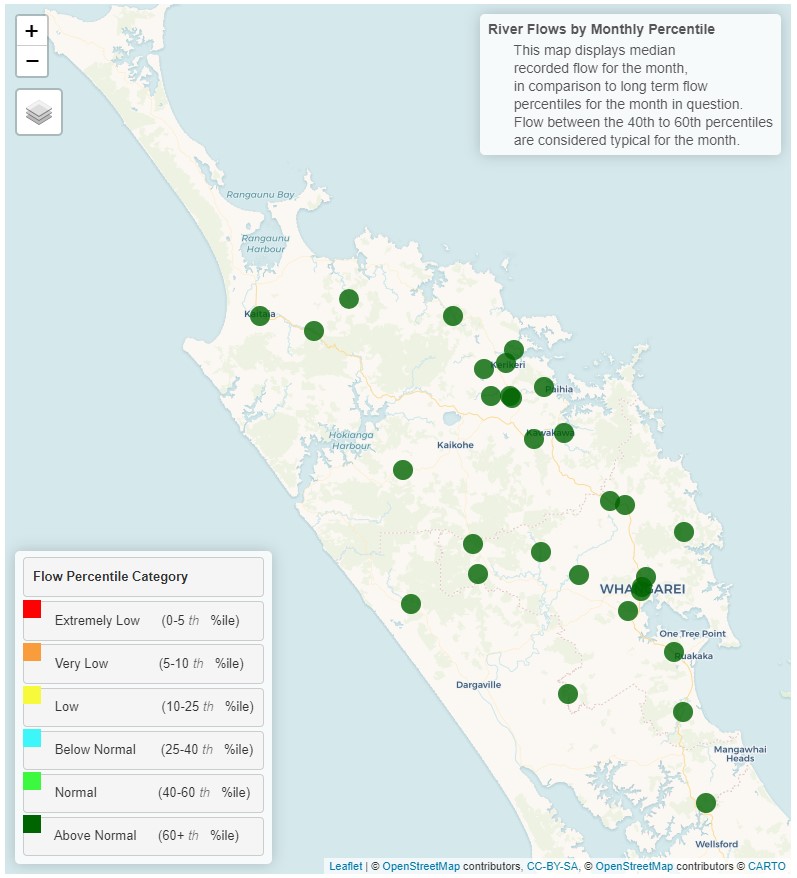
Monthly percentile River Flows map for May 2023.
Groundwater
All key aquifers in Northland are currently recording “Above Normal” water levels for May.
| Aquifer | Status | Percentile |
| Aupōuri | Above normal | 60th+ |
| Taipā | Above normal | 60th+ |
| Russell | Above normal | 60th+ |
| Kaikohe | Above normal | 60th+ |
| Poroti | Above normal | 60th+ |
| Whangārei | Above normal | 60th+ |
| Mangawhai | Above normal | 60th+ |
| Marsden - Ruakākā | Above normal | 60th+ |
| Ruawai | Above normal | 60th+ |
Groundwater map for May 2023
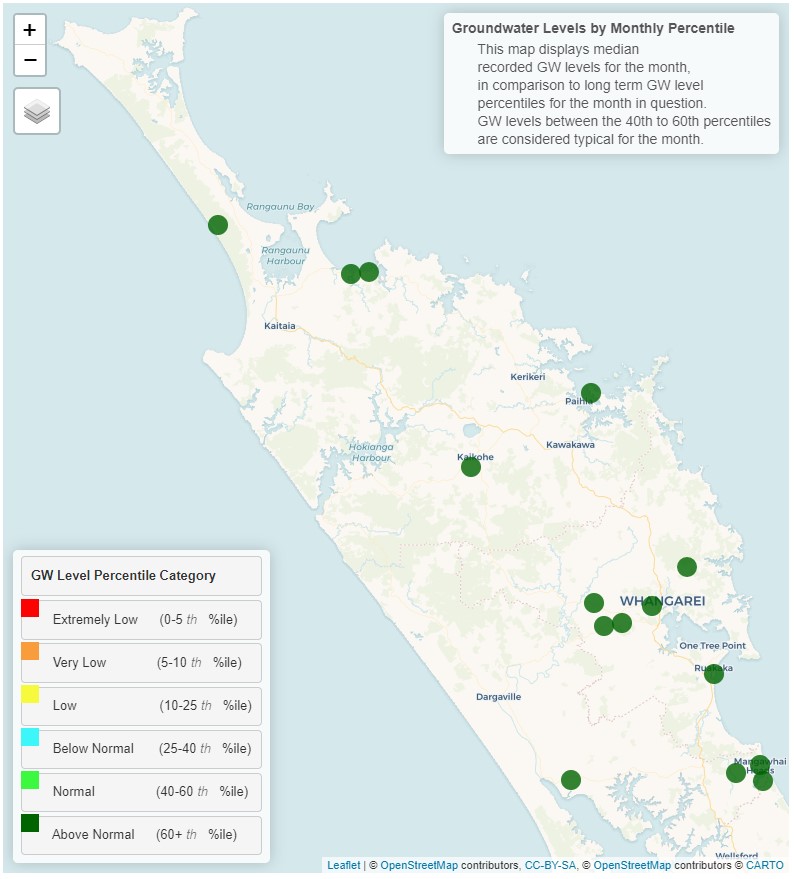
Groundwater map for May 2023.
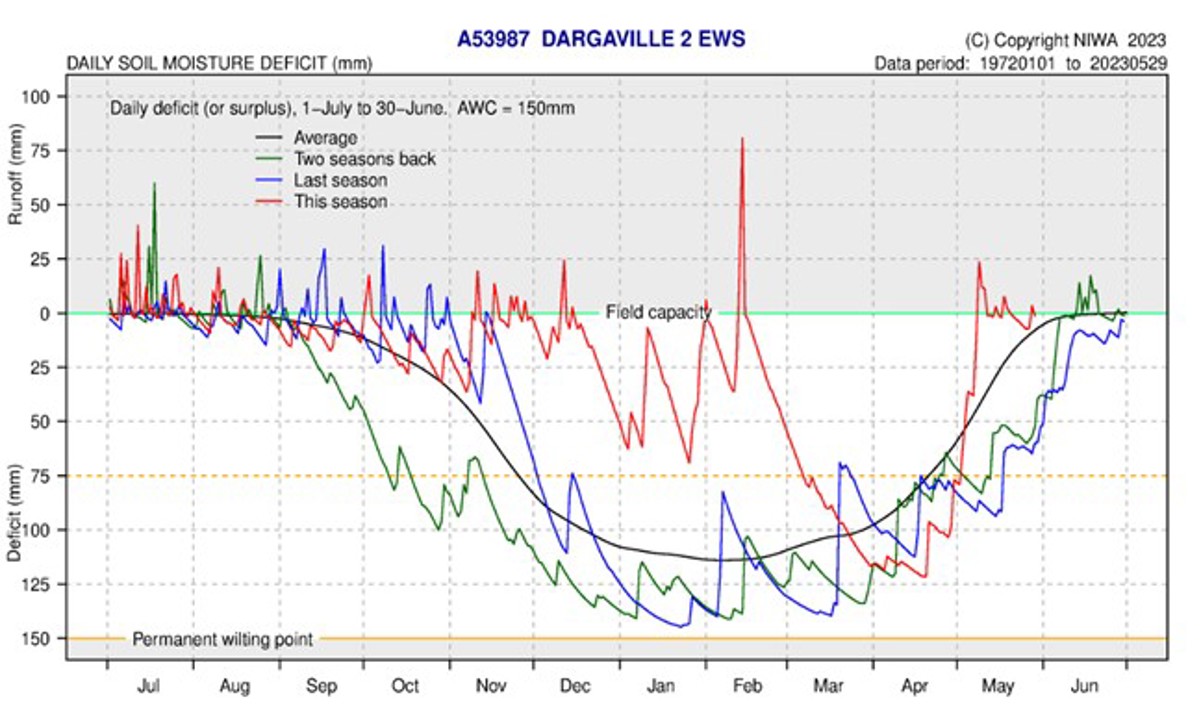
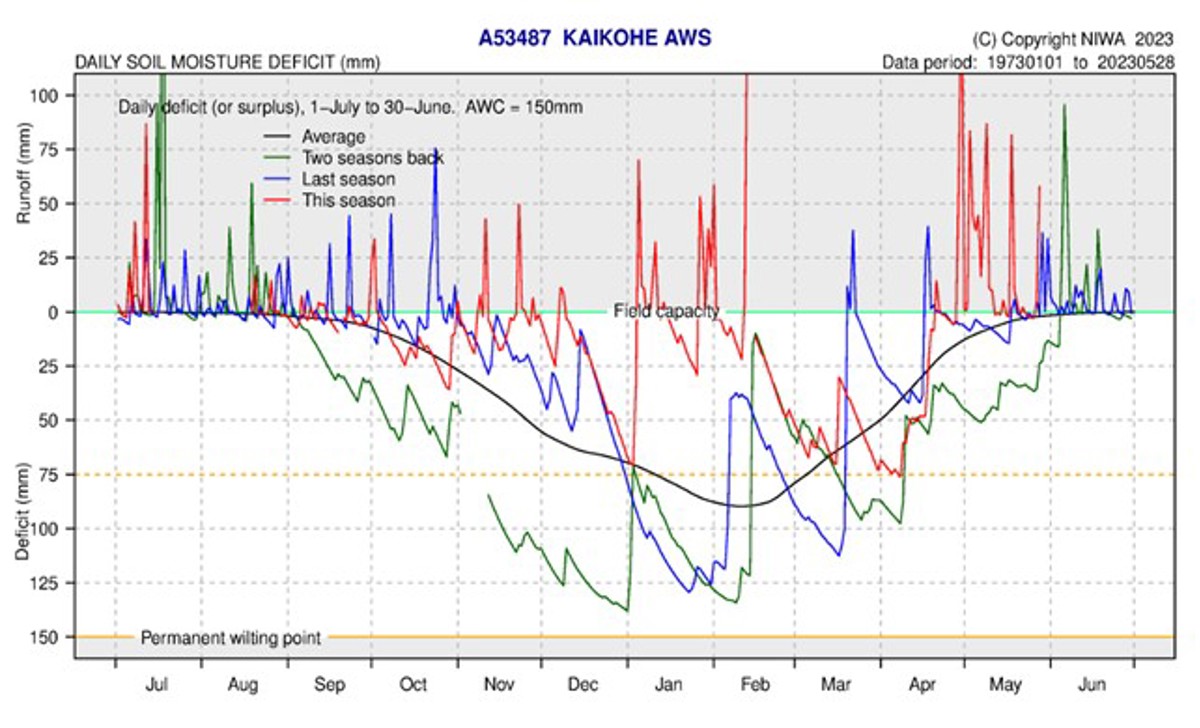
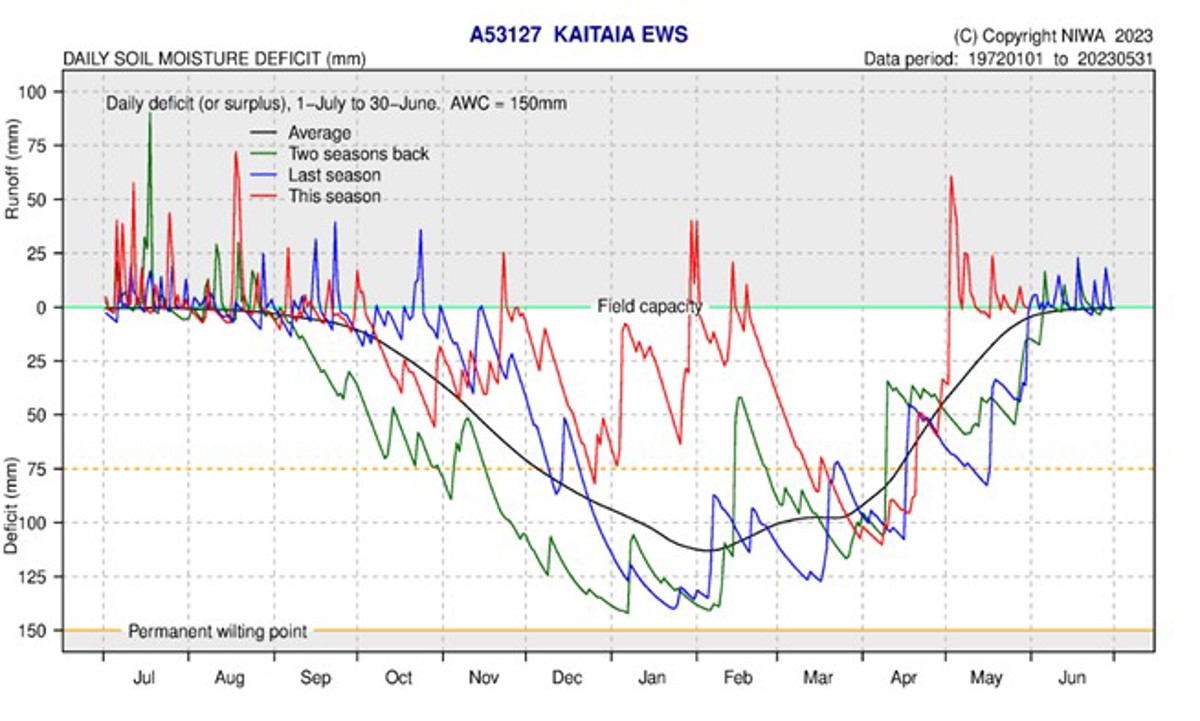
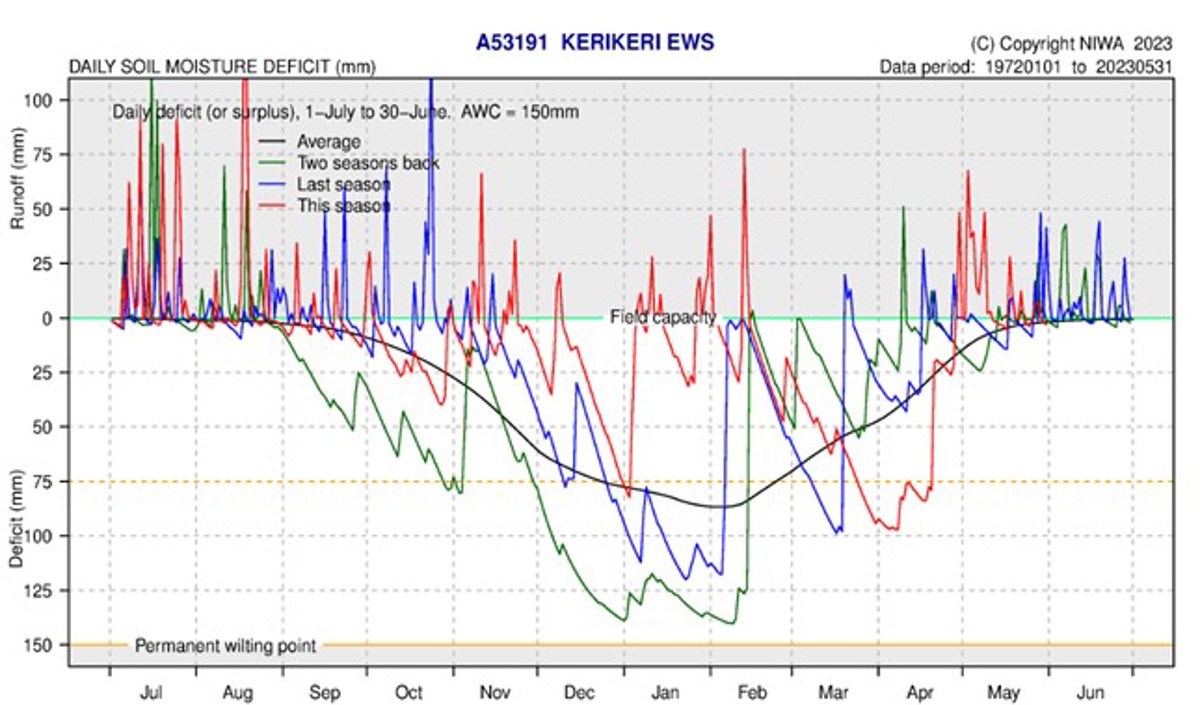
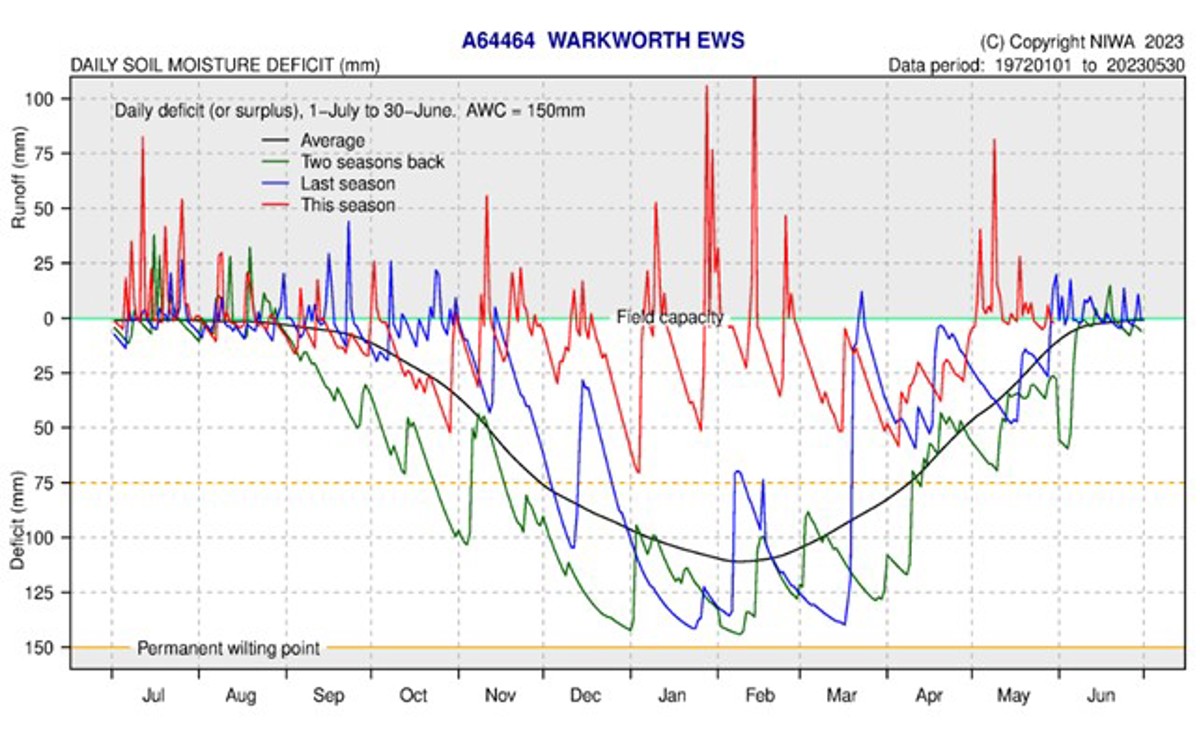
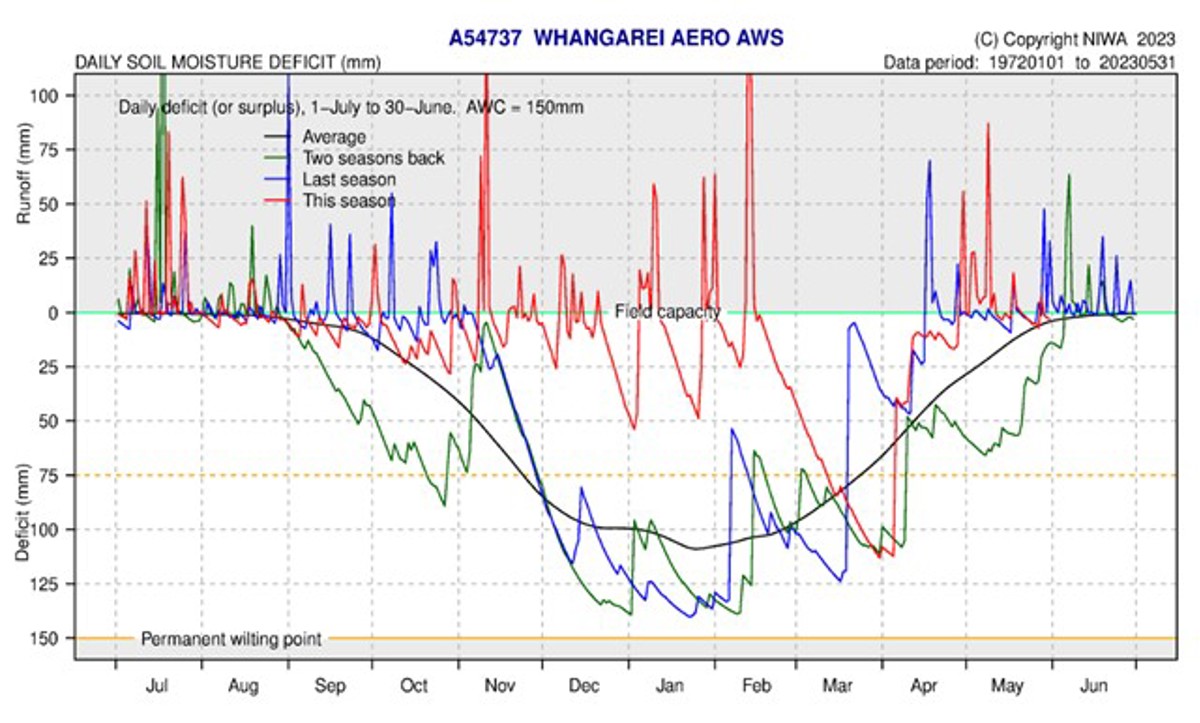
Soil Moisture
At the end of April, soil moisture levels were beginning to recover after a period of time with soil water in a deficit of around 50 – 100 mm. Rain events in May quickly reversed this effect, with the whole region's soil moisture recovering and then exceeding field capacity.
At the end of May all monitoring sites are either at field capacity or just above, and rainfall events through June are likely to result in run off occurring. The soil moisture deficit is calculated based on incoming daily rainfall (mm), outgoing daily potential evapotranspiration (mm), and a fixed available water capacity (the amount of water in the soil 'reservoir' that plants can use) of 150 mm” (NIWA).