June 2023 climate report
11 Jul 2023, 11:26 AM
Summary
- El Niño Southern Oscillation (ENSO) has started to develop and expected to be driving the ocean and atmospheric conditions in Northland in early Spring.
- Temperatures are expected to be “near average” or “above average”, while rainfall, soil moisture and river flows are expected to be “near average” or “below average”.
- Rainfall for June was greater than expected, with the region receiving 125% of the expected rainfall. This ranged between 90% - 200% across the region.
- Standardised precipitation at a 3-, 6-, and 12-month scale shows Northland is “near normal – wet” with the wettest areas in the south east and the centre of the region.
- River flows are either “above normal” or “normal” for the expected June flows across majority of Northland.
- All Key Ground water aquifers are currently “above normal”.
- Soil moisture levels across Northland are at field capacity.
Climate Outlook
July to September 2023
ENSO conditions in the central pacific exceeded the threshold for El Nino in June, however the atmospheric conditions of the Southern Oscillation Index are still in a neutral phase. The ocean - atmospheric conditions around New Zealand are expected to develop into El Nino during late winter and early spring. Wind conditions are expected to be generally south-westerly as El Nino develops, though through July easterlies are likely as the last effects of La Nina drive the atmosphere. Rainfall is likely to be “near average”, with the likelihood for tropical driven rain events less likely to occur. Temperatures are likely to be “near average” or “above average”, though short sharp cold snaps are also likely to occur. Coastal sea surface temperatures are currently warmer than average which may reduce the intensity of cold air masses crossing Northland, however these temperatures are expected to drop as El Nino develops. For more details, please refer to NIWA’s seasonal climate outlook at: https://niwa.co.nz/climate/seasonal-climate-outlook/seasonal-climate-outlook-july-september-2023
NIWA Temperature, Rainfall, Soil Moisture and River Flows probabilities for the period of July to September 2023 (expressed as % likelihood for either Above Average, Near Average or Below Average conditions)
| Temperature | Rainfall | Soil moisture | River flows | |
| Above average | 50• | 15 | 30 | 15 |
| Near average | 45• | 40• | 40• | 40• |
| Below average | 05 | 45• | 30 | 45• |
Rainfall
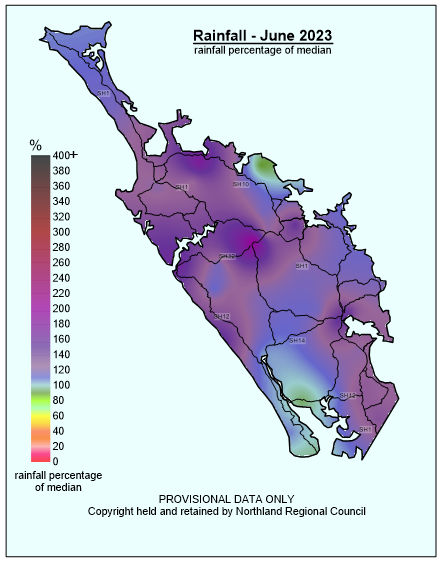
Like previous months June was wetter than usual, however there were no specifically large events, rather the longevity of continuous, low intensity, rainfall added up throughout the second half of the month. Kaikohe recorded the highest monthly total of 330.4 mm, with Waimamaku close behind with 320.5 mm. Cape Reinga and Pouto point received the least with 117.4 mm and 117.5 mm respectively. On average Northland received 125% of the expected rainfall for June, with Kaikohe recording 200% of expected, while Pouto in the southwest, and the Whangaroa harbour recording just under 100% of expected, most sites received between 100% -150%.
Rainfall (% of Median) for June 2023 across Northland with a range of 90% to 200%
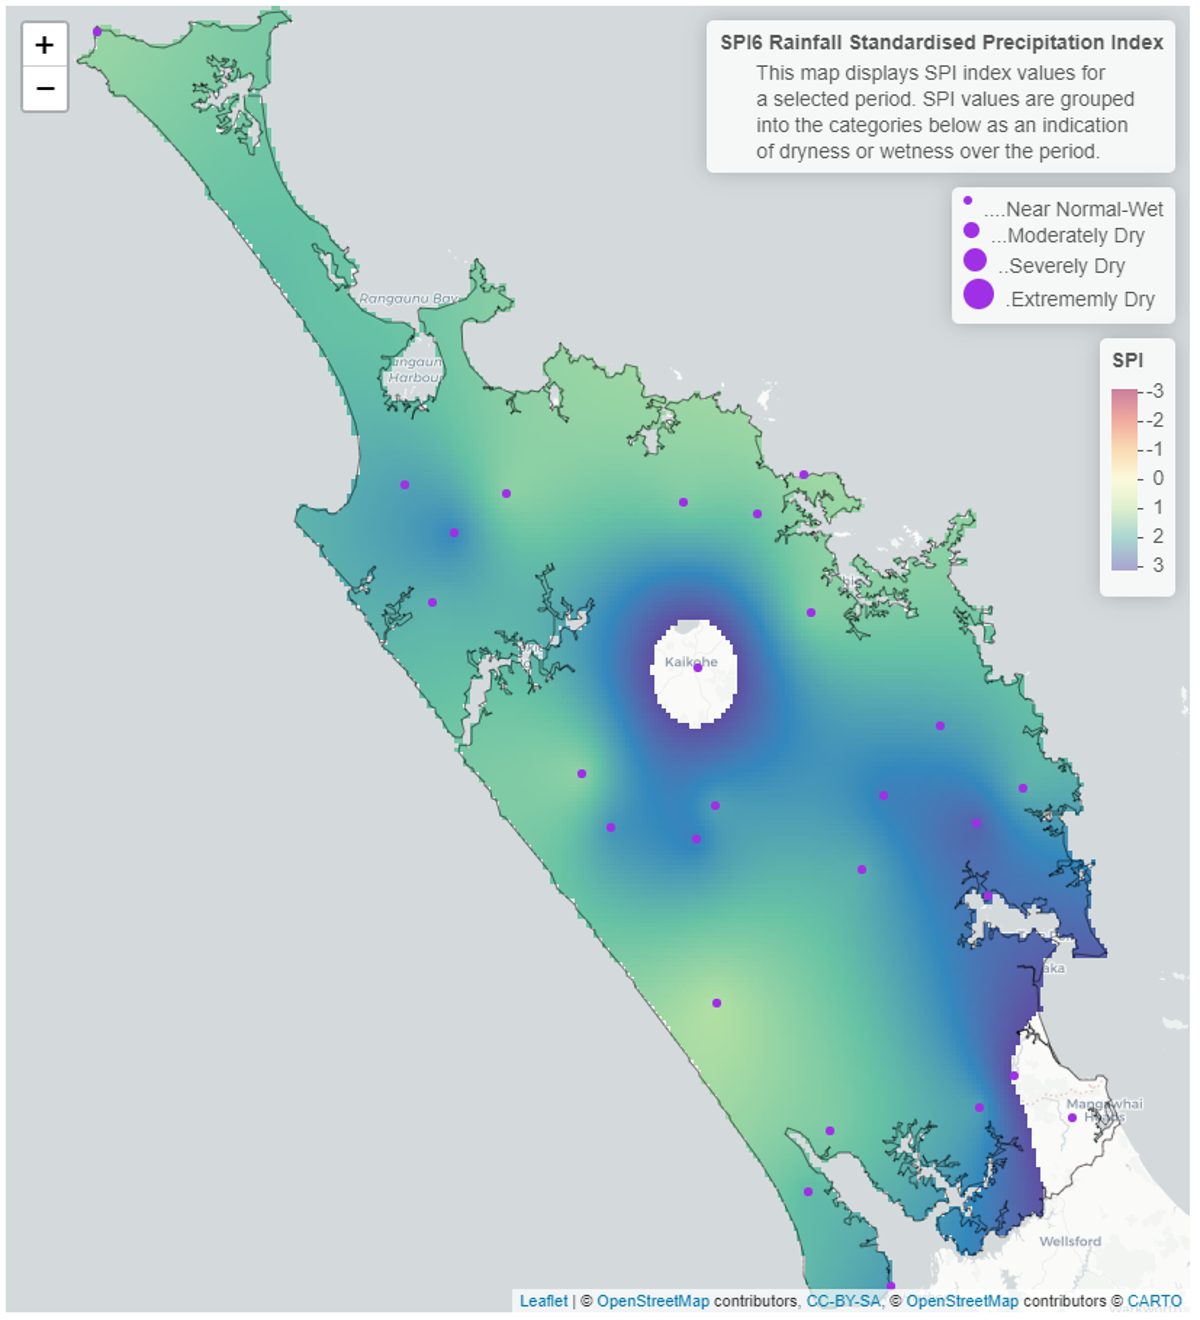
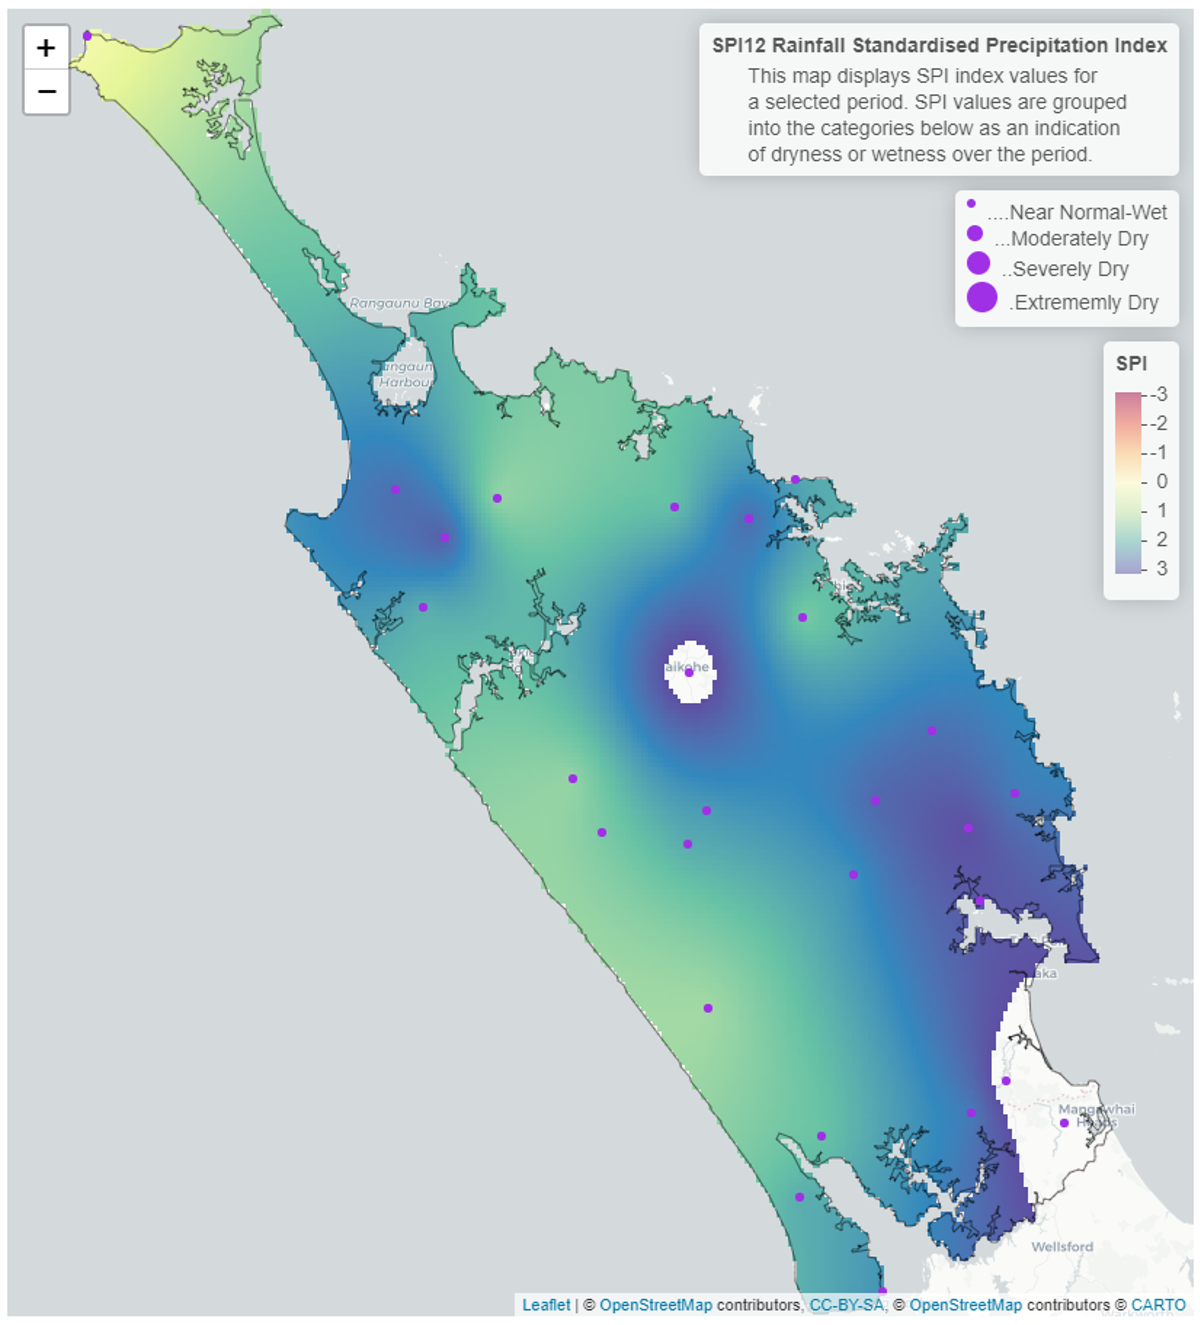
Standardised Precipitation index (SPI)
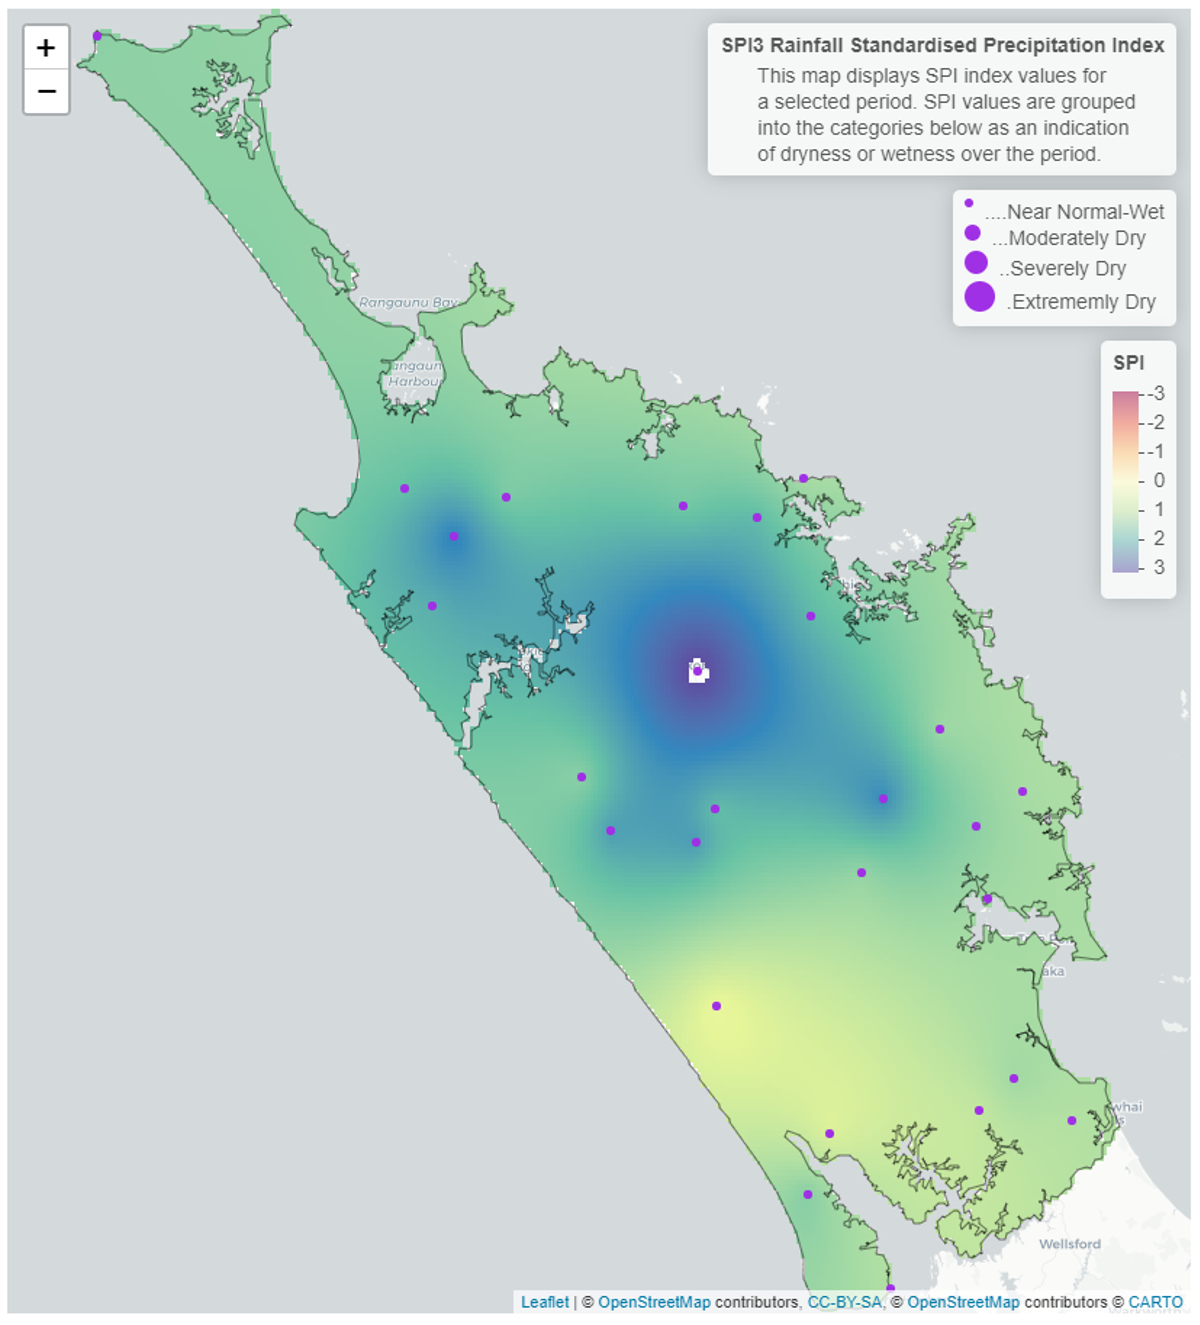
The Standardised Precipitation Index (SPI) on a three-month scale shows that all of Northland has been “near normal or wet”, The wettest areas in the centre of the region, with Kaikohe recording the most rainfall during the 3-month period, and the driest area with “near normal” rainfall in the west. On a six-month scale between January – June 2023, the standardised rainfall averages Northland to being wetter than normal, with the Kaikohe area and the south-eastern corner of the region being extremely wet, with these areas having an SPI score of greater than -3, thus appearing to have no data. The rainfall in these areas have been driven by the thunderstorm in February in the Mangawhai area, Cyclone Gabrielle, and heavy rain events in May in the central area of Northland. On a 12- month scale for the hydrological year from July 2022 – June 2023, the region has been “near normal” along the west coast and into the far north. While the central area, and the east coast through to the southeast of the region has been “wet”. In the south and in the centre around Kaikohe there is no data displayed due to the rainfall in these areas being unprecedently high and outside the bounds of the SPI index.
3-Month SPI (Standardised Precipitation Index) Map for April - June 2023
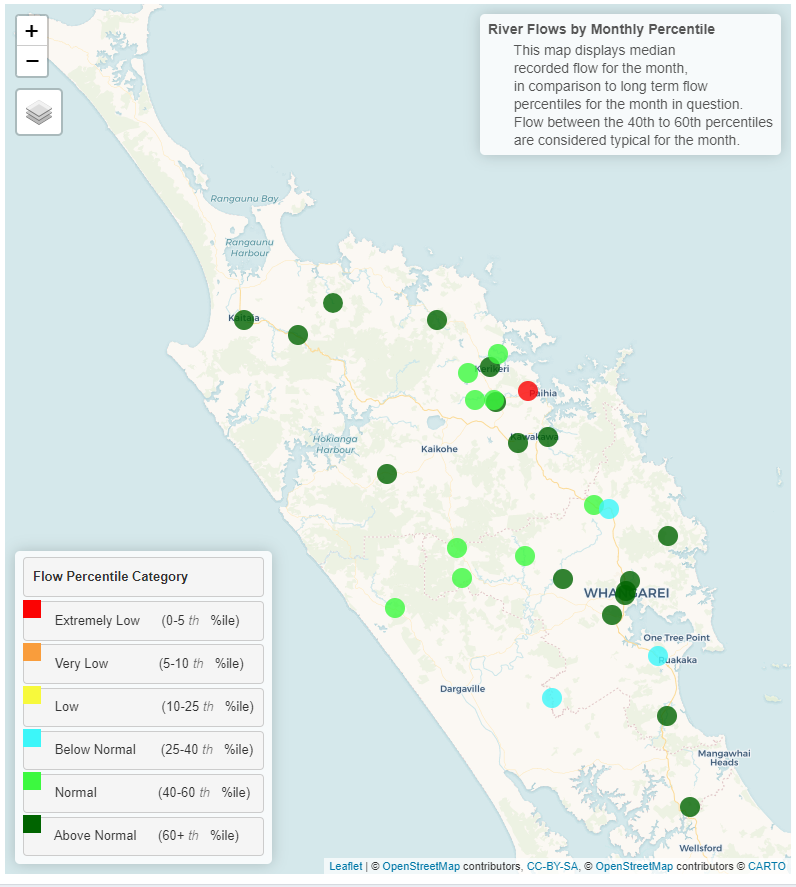
River flow
For most of Northland, river catchments are currently recording flows either “above normal” or “normal”. Three catchments are currently recording “below normal” flows for the month of June, compared to previous years at these recording sites.
Monthly percentile River Flows for June 2023
Groundwater
All key aquifers in Northland are currently recording “Above Normal” water levels for June.
| Aquifer | Status | Percentile |
| Aupōuri | Above normal | 60th+ |
| Taipā | Above normal | 60th+ |
| Russell | Above normal | 60th+ |
| Kaikohe | Above normal | 60th+ |
| Poroti | Above normal | 60th+ |
| Whangārei | Above normal | 60th+ |
| Mangawhai | Above normal | 60th+ |
| Marsden - Ruakākā | Above normal | 60th+ |
| Ruawai | Above normal | 60th+ |
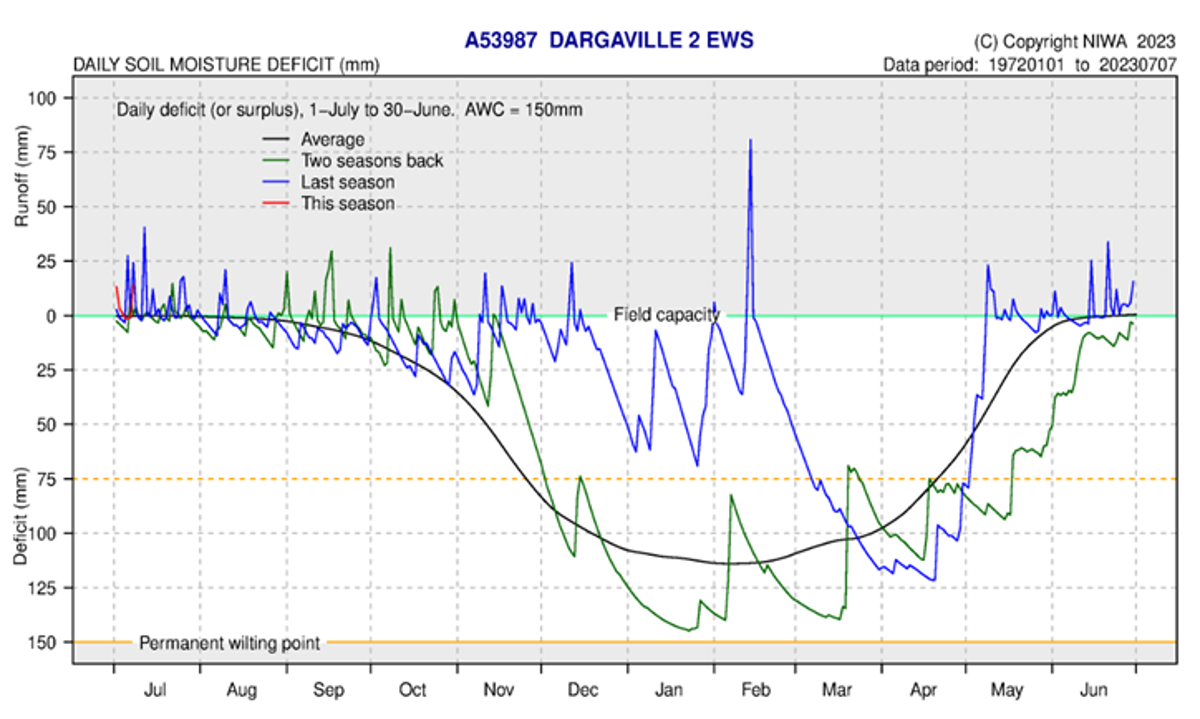
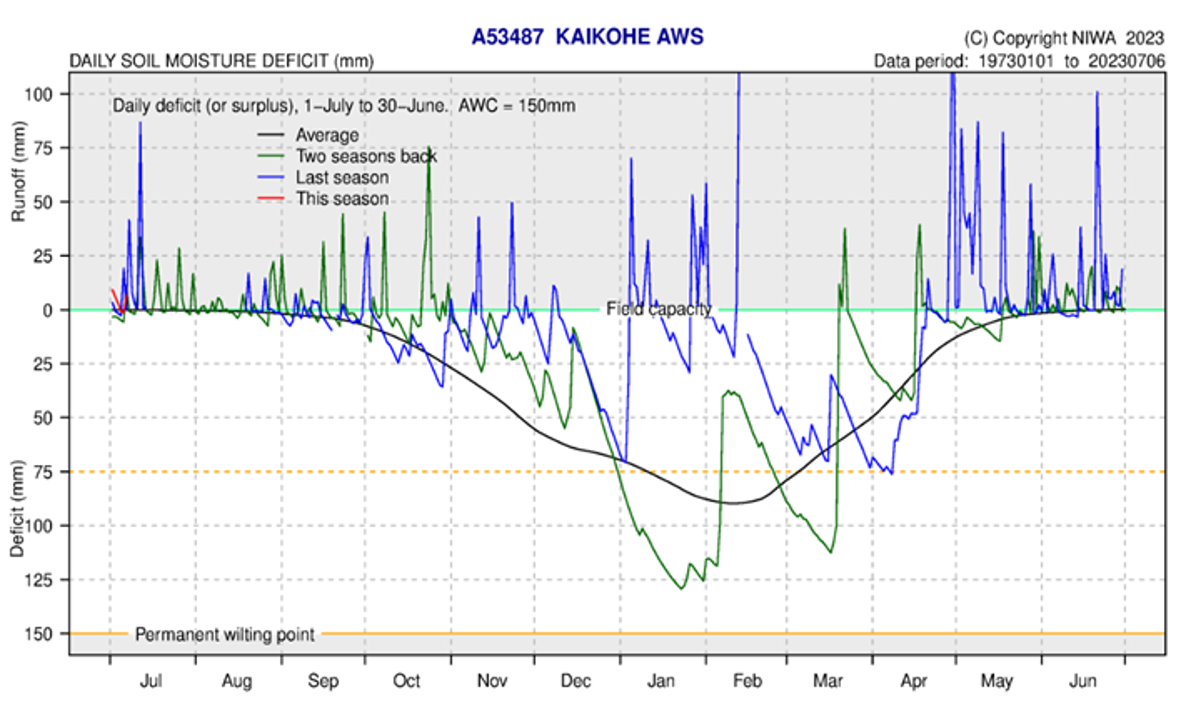
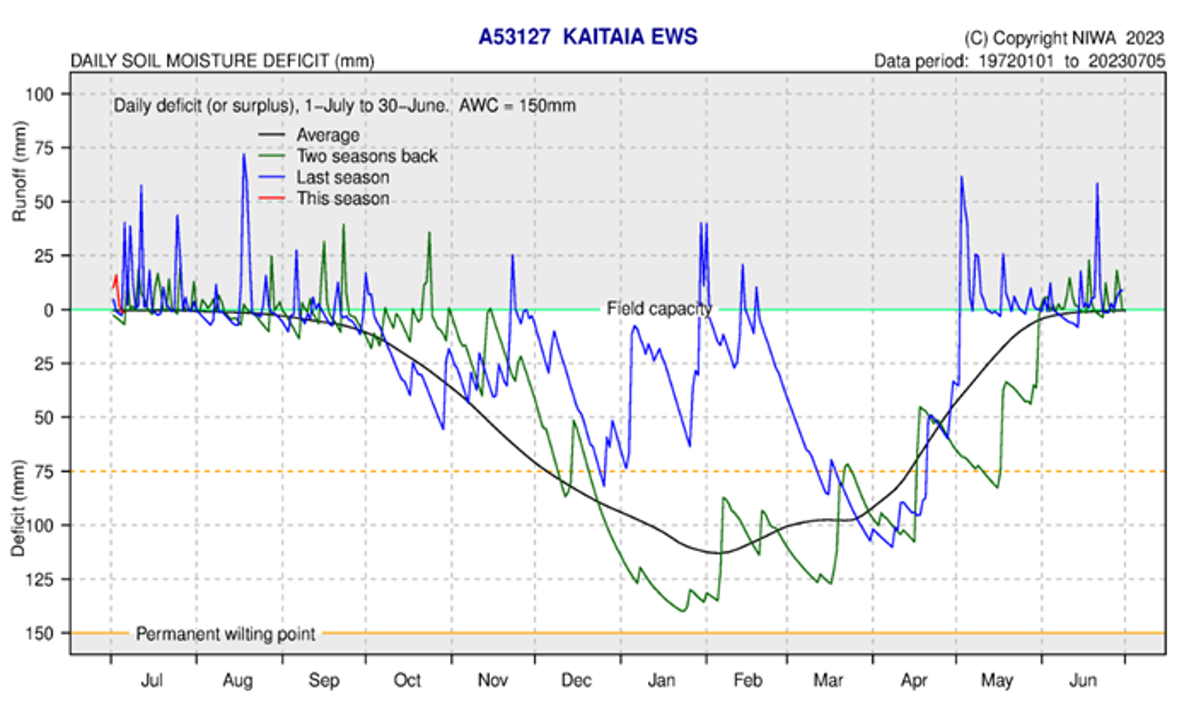
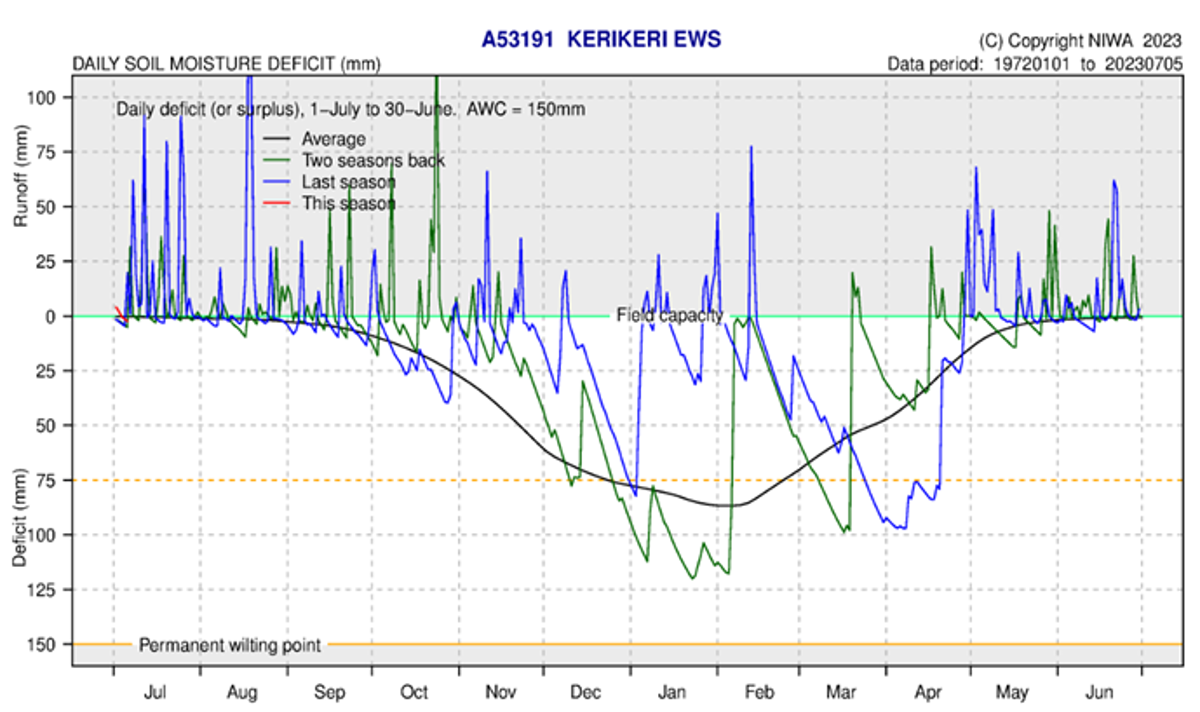
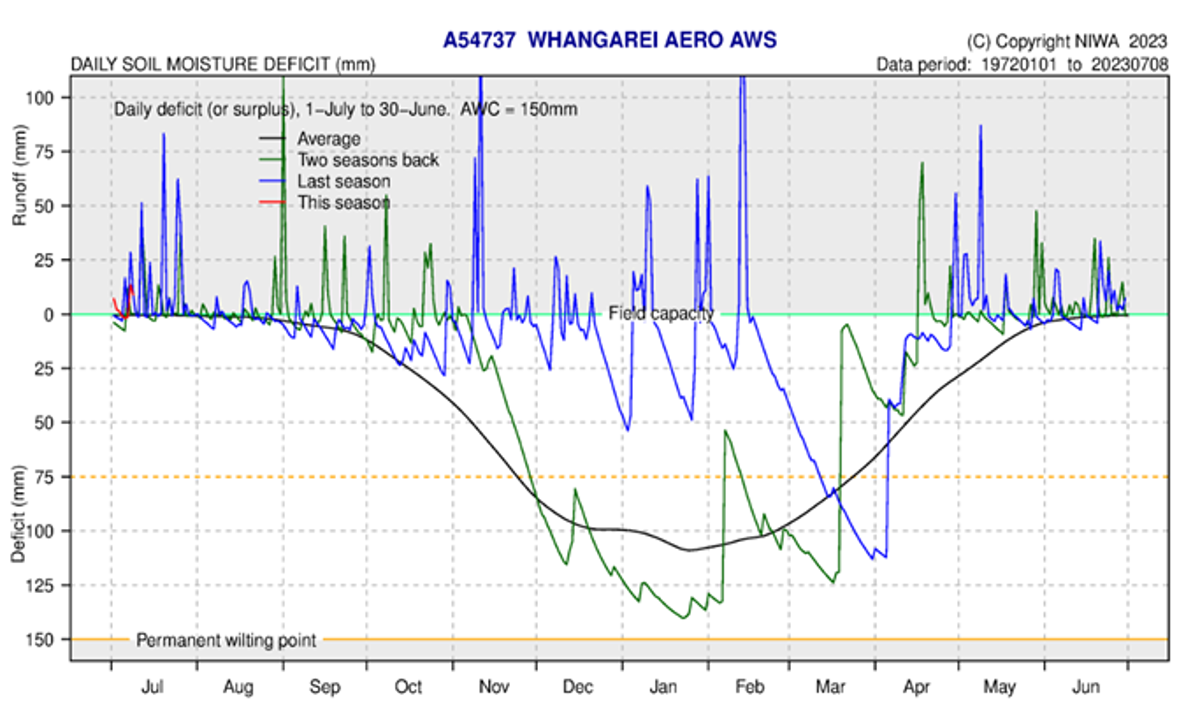
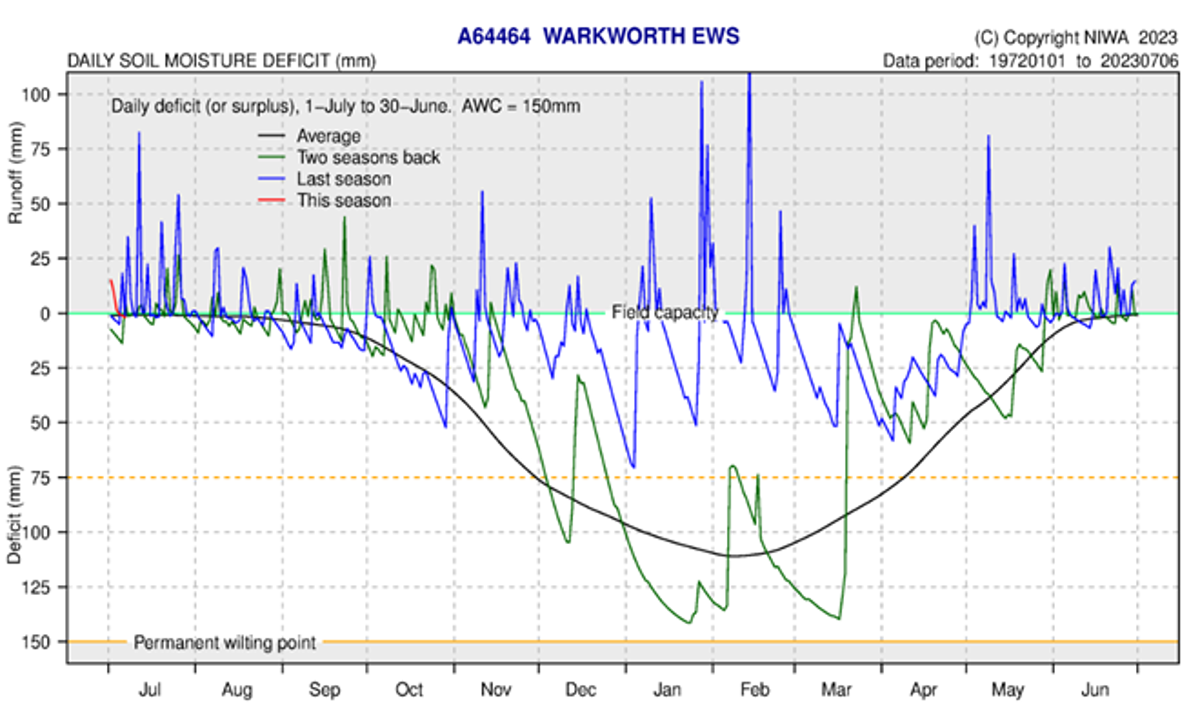
Soil Moisture
At the beginning July which is the start of the hydrological year all measurement sites are sitting just above field capacity. During June, soil moisture levels generally stayed field capacity, during the second week soils did begin to dry out, moving into at 10 mm deficit at some sites. In the second half of the month there were several small spikes of run off during more intense rainfall. The soil moisture deficit is calculated based on incoming daily rainfall (mm), outgoing daily potential evapotranspiration (mm), and a fixed available water capacity (the amount of water in the soil 'reservoir' that plants can use) of 150 mm” (NIWA).