December 2022 climate report
17 Jan 2023, 10:00 AM
Summary
- La Niña appears to have peaked in intensity and is likely to begin weakening towards neutral conditions in February and March.
- Between January and March temperatures are likely to be above average, with rainfall, river flow and soil moisture near average.
- December was drier than previous months receiving 88% of the region's expected rainfall, however there was large amounts of variation with the south east receiving 226% compared to the far north that received of 26% of its expected total for December.
- River flows and groundwater levels are above normal for December across the region.
- Soil moisture had approximately a 50 mm deficit at the end of December, but rain events in early January has brought most sites up to either at or near field capacity.
Outlook
January to March 2023
La Niña continued through December, and marine heatwave conditions intensified, however La Niña appears to have peaked in intensity and should begin weakening to neutral conditions in late summer. These conditions paired with mainly easterly winds and sub-tropical systems will drive Northland's weather of warm and wet conditions. Temperatures are predicted to be “above average”, while rainfall, soil moisture and river flow are likely to be “near average” or “above average”.
For more details, please refer to NIWA’s seasonal climate outlook for January - March 2023:
See the seasonal climate outlook on NIWA's website: niwa.co.nz
NIWA Temperature, Rainfall, Soil Moisture and River Flows probabilities for the period of January to March 2023
(Expressed as % likelihood for either Above Average, Near Average or Below Average conditions).
| Temperature | Rainfall | Soil moisture | River flows | |
| Above average | 70• | 35• | 30 | 35 |
| Near average | 25 | 40• | 45• | 45• |
| Below average | 05 | 25 | 25 | 20 |
Rainfall
December was much drier compared to previous months. The region on average had 100.8mm of rain, which was 88% of the expected rainfall for December. The south of Northland had much higher rainfall events with Paparoa recording the maximum amount of 219.5 mm, which was 226% of the expected median. The lowest amounts were recorded in the Far North, with Waihopo and Oruru both only recording 26% of expected for December.
Rainfall (% of Median) for December 2022 across Northland with a range of 226% to 26%
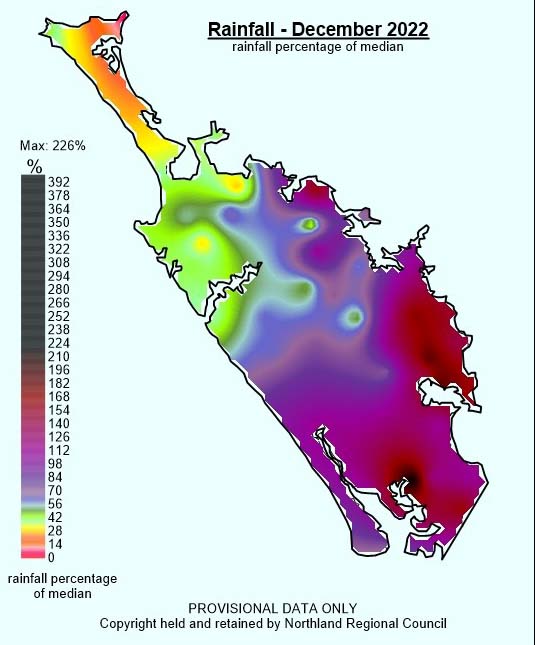
December 2022 rainfall percentages.
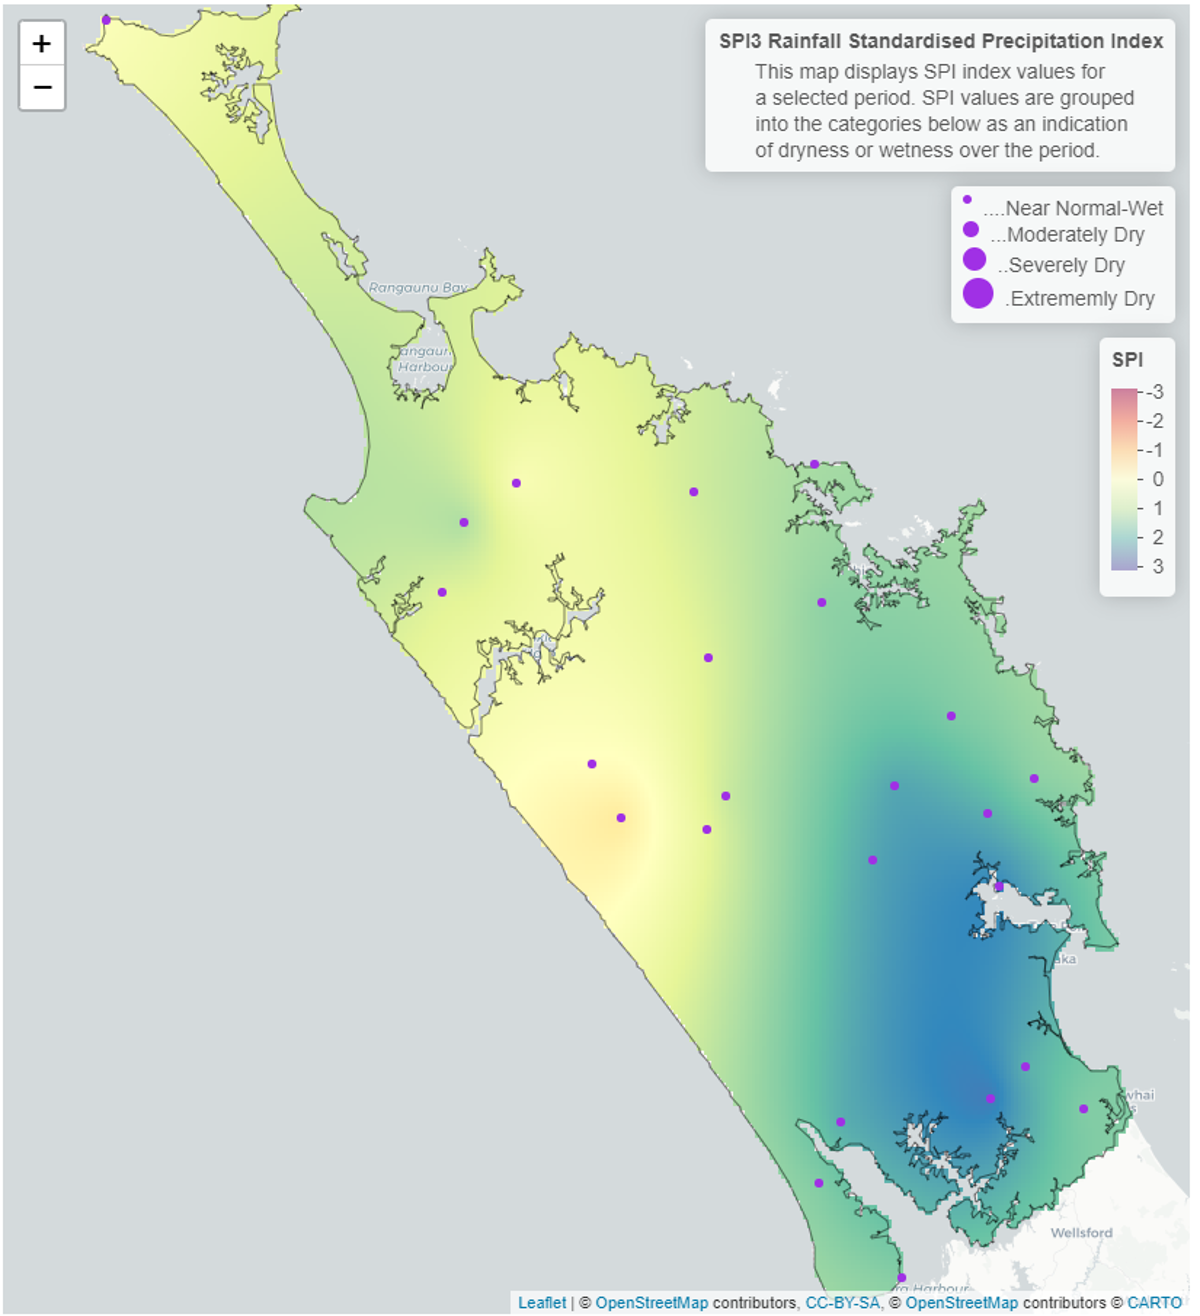
Standardised Precipitation index (SPI)
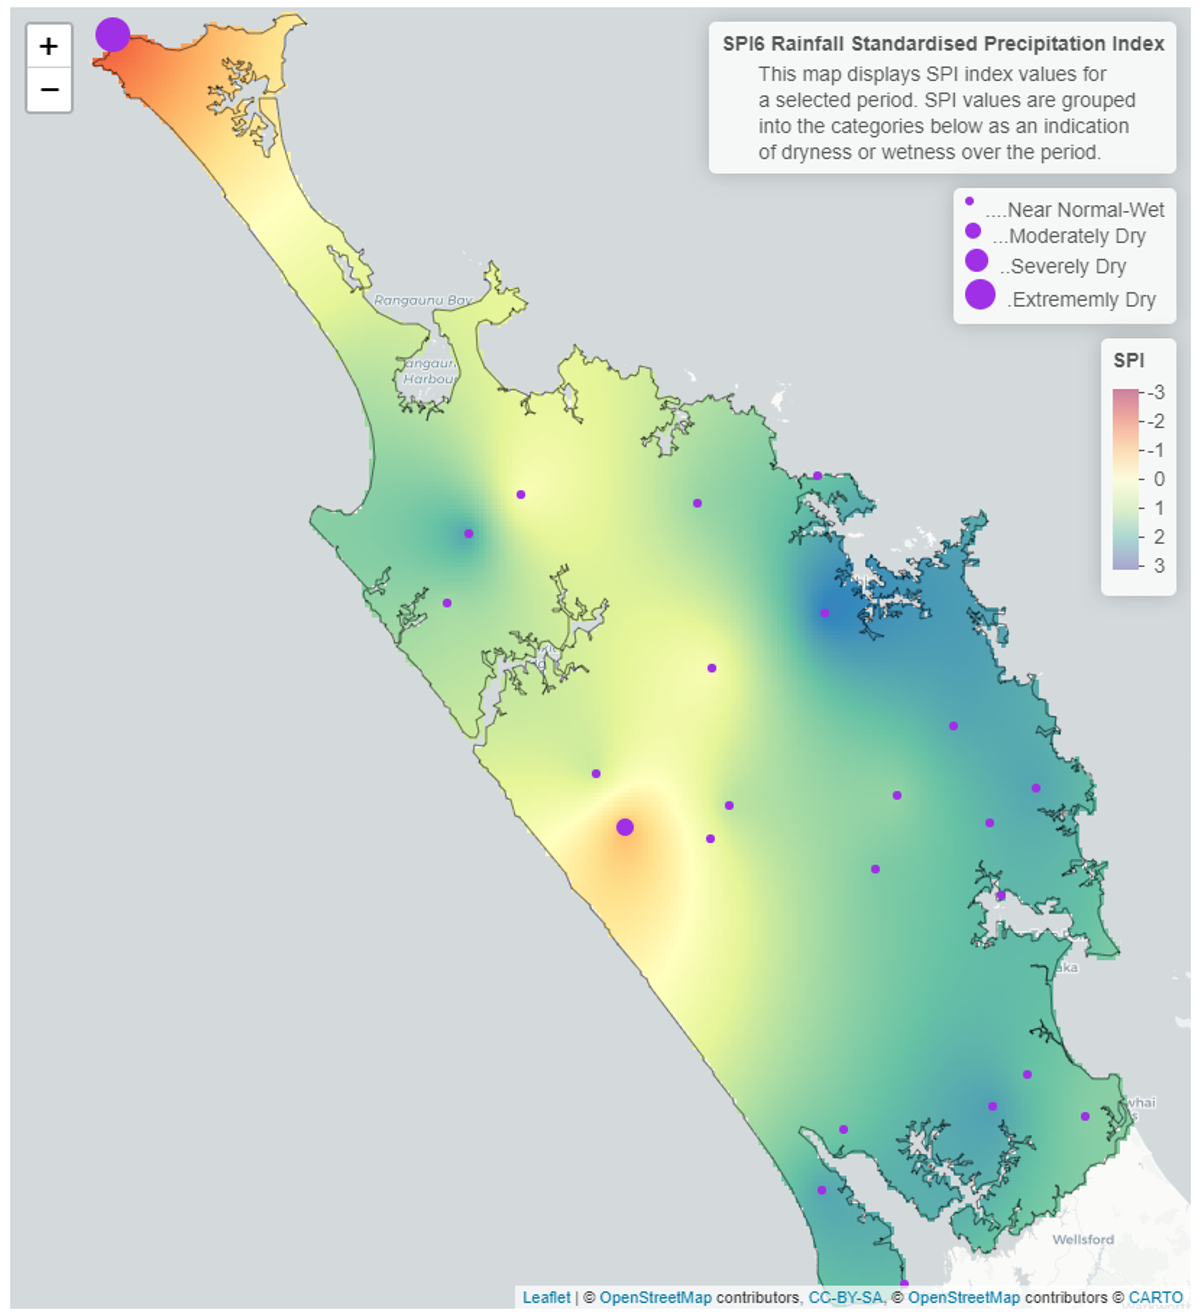
The Standardised Precipitation Index (SPI) on a three-month continues to show the same patterns seen throughout winter in Northland with rainfall at most sites being “near normal or wetter” than normal. The six-month SPI shows “near normal or wetter” conditions for most of Northland. However at Cape Reinga and Kaiiwi Lake, due to equipment faults, the areas appear to be “severely dry”, which should be disregarded.
3 and 6-Month SPI (Standardised Precipitation Index) Map for December 2022
River flow
During December, river flows were driven by the far higher than average rainfalls recorded in the south and east of Northland. With majority of catchments recording “above normal” flows for December.
Monthly percentile River Flows for December 2022
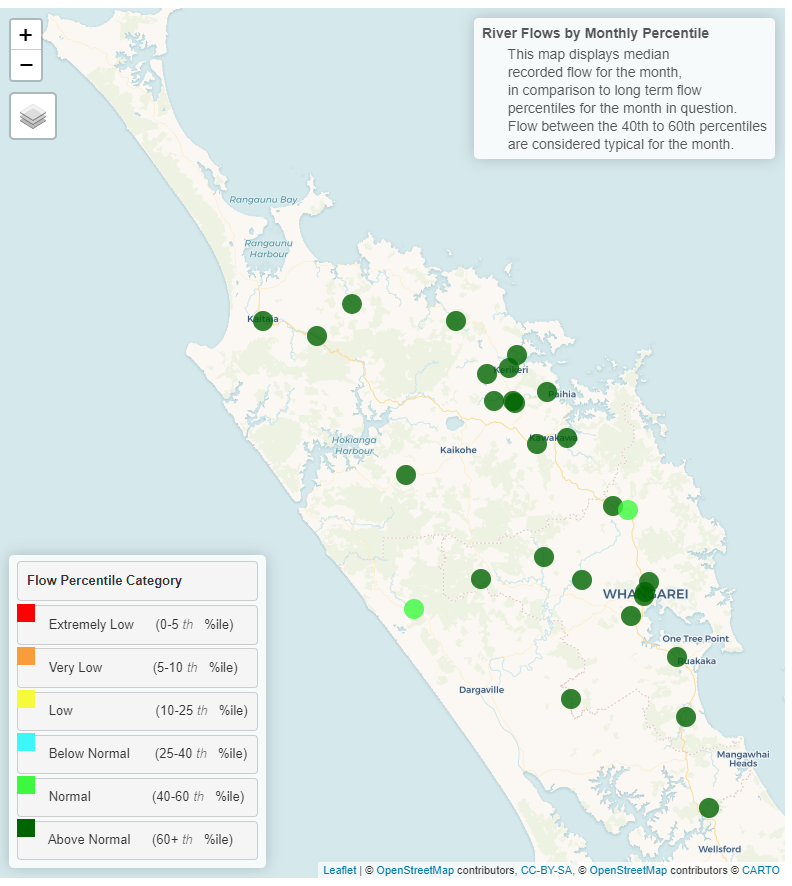
River flows by monthly percentile for Northland, December 2022.
Groundwater
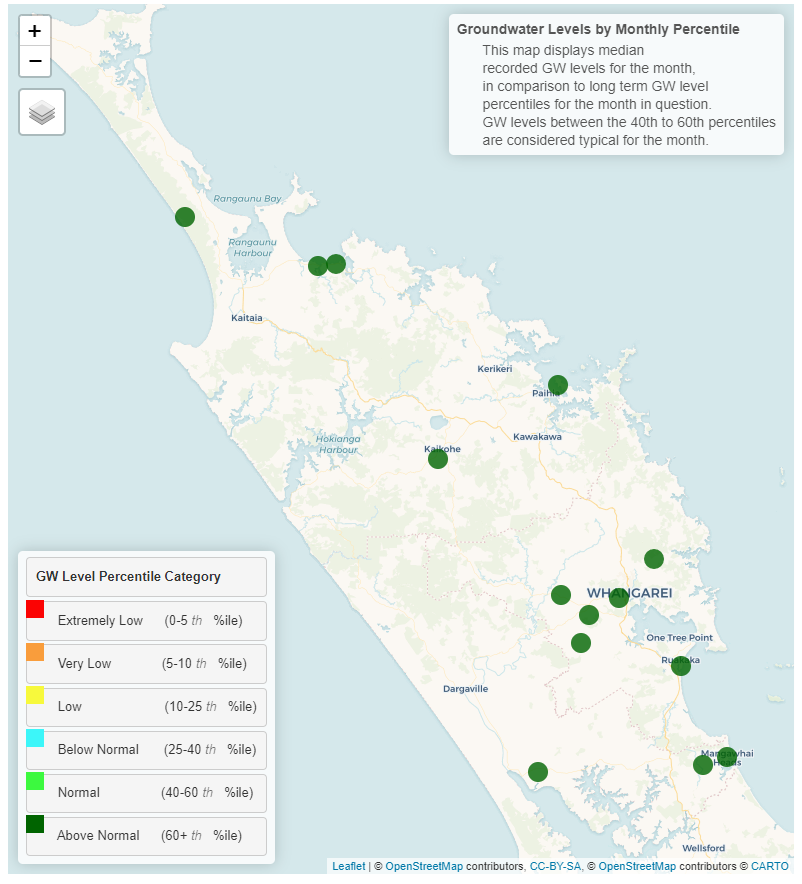
All the key aquifers in Northland are currently recording “Above Normal” water levels for December.
| Aquifer | Status | Percentile |
| Aupōuri | Above normal | 60th+ |
| Taipā | Above normal | 60th+ |
| Russell | Above normal | 60th+ |
| Kaikohe | Above normal | 60th+ |
| Poroti | Above normal | 60th+ |
| Whangārei | Above normal | 60th+ |
| Mangawhai | Above normal | 60th+ |
| Marsden - Ruakākā | Above normal | 60th+ |
| Ruawai | Above normal | 60th+ |
Groundwater map for December 2022
River flows by monthly percentile for Northland, December 2022.
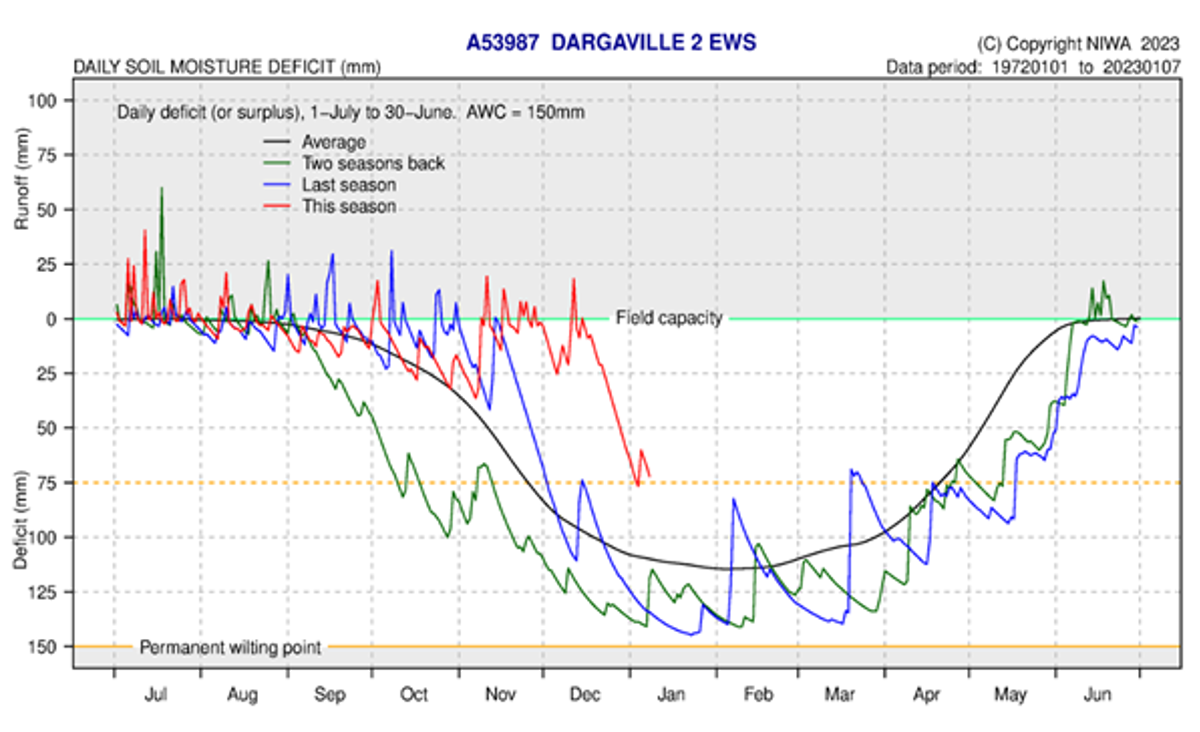
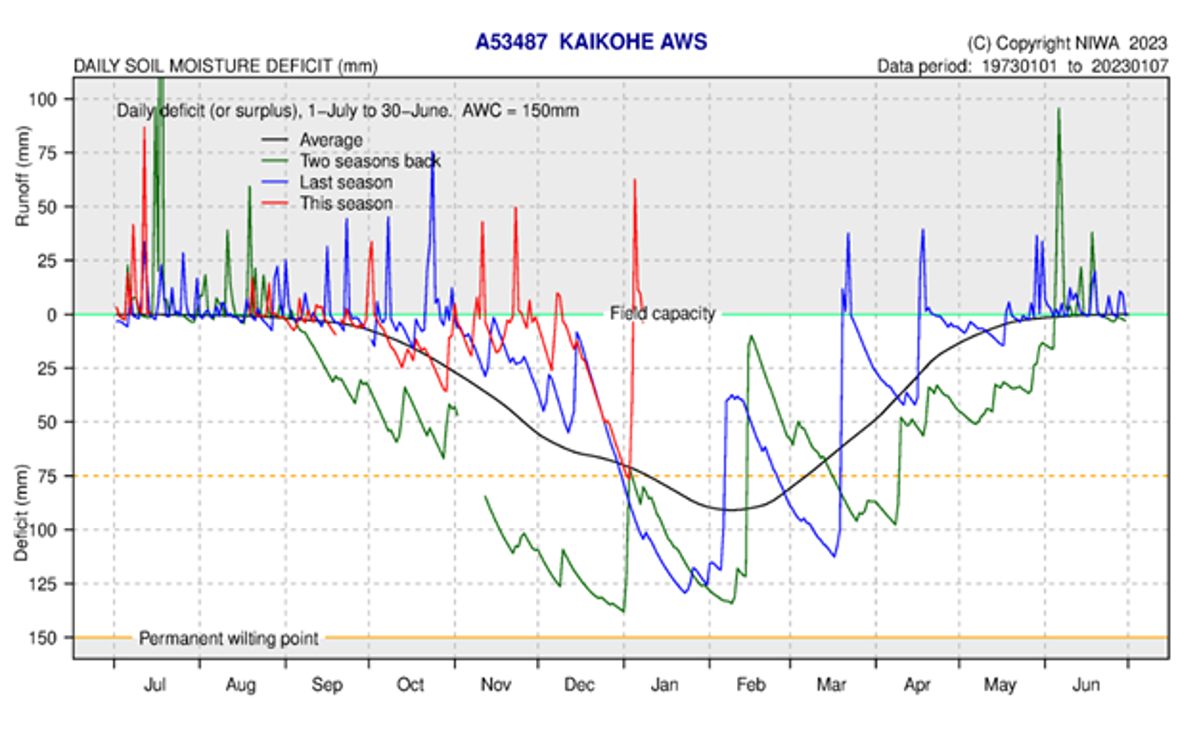
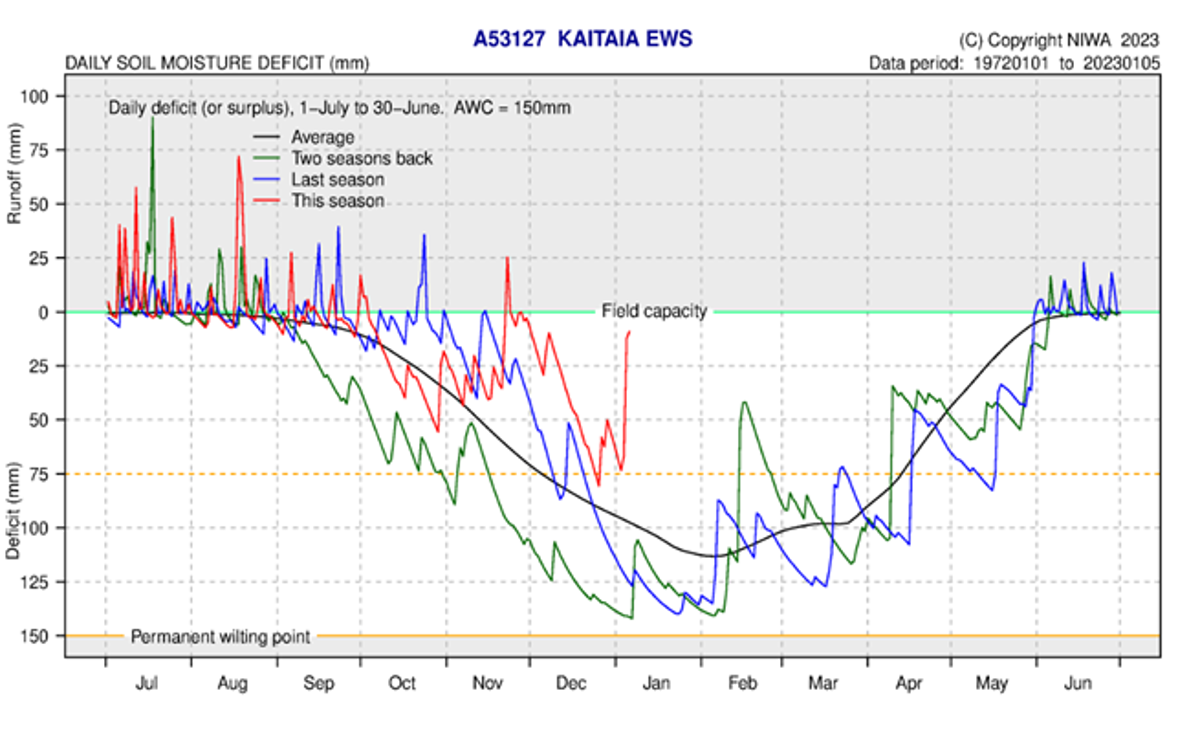
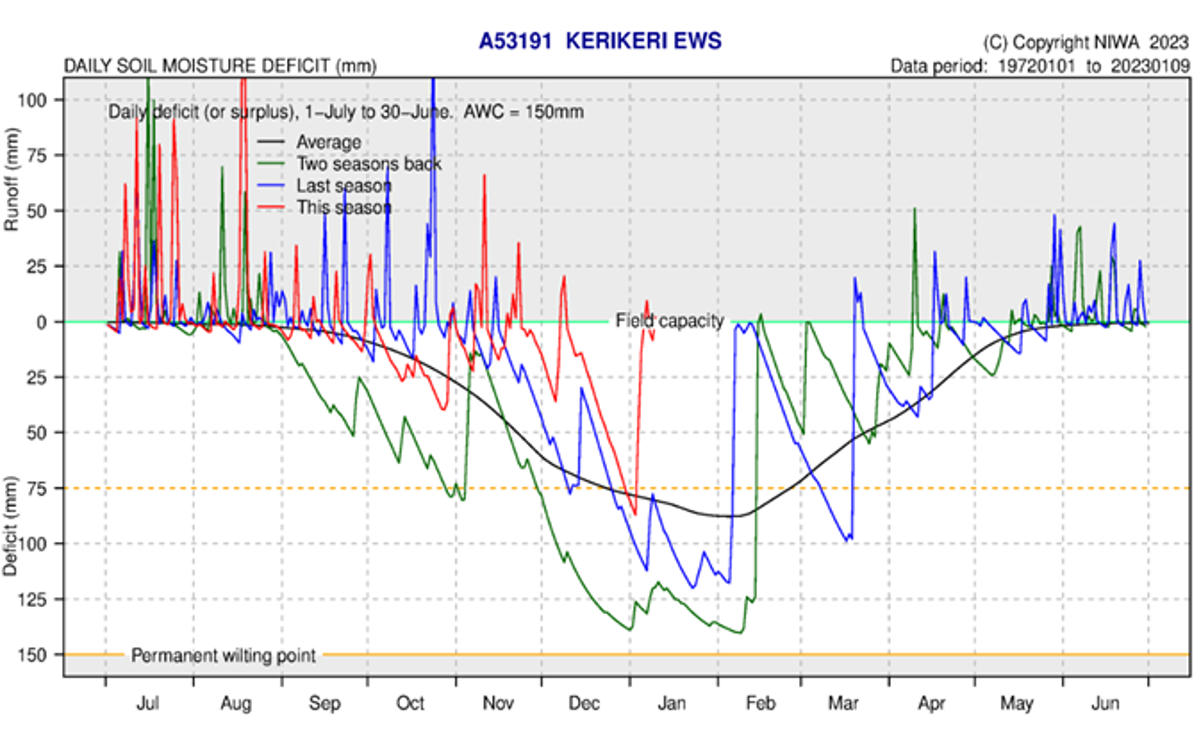
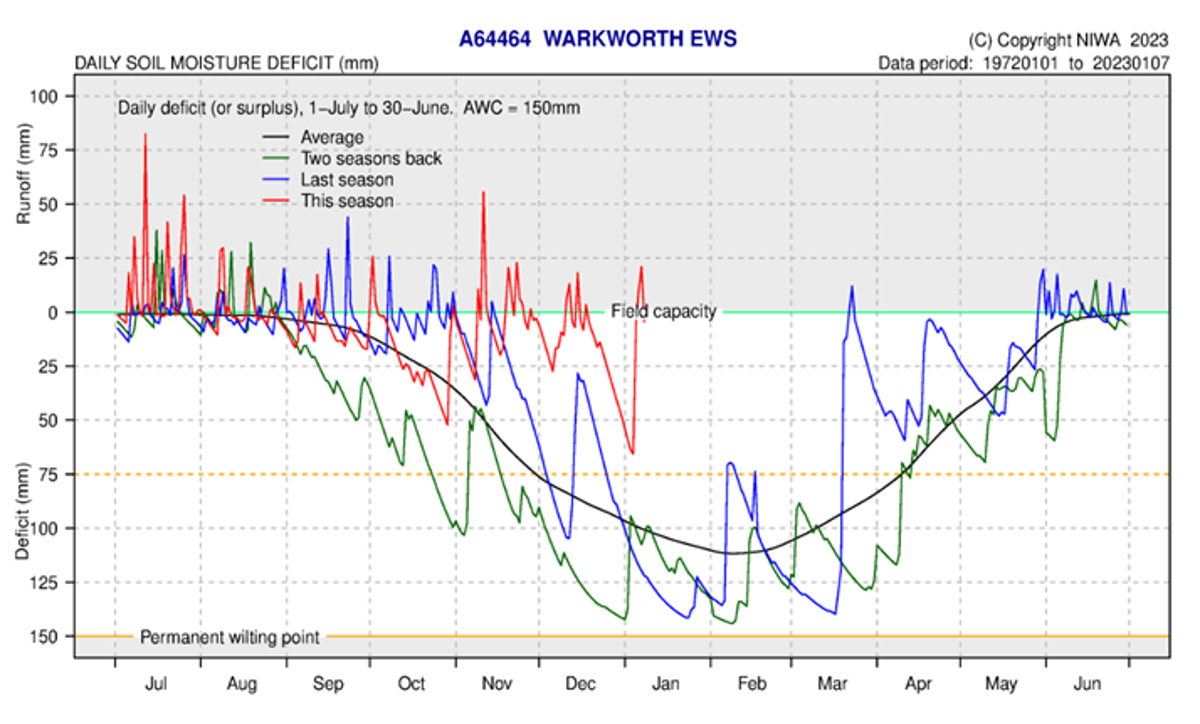
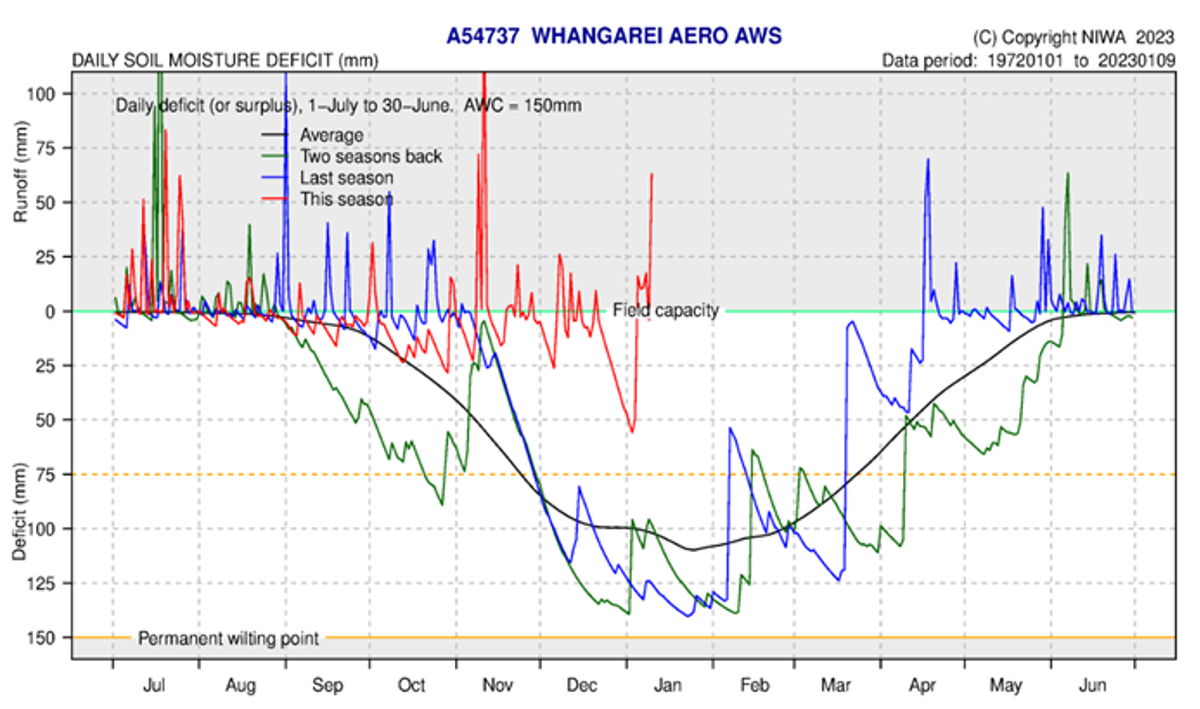
Soil moisture
Soil moisture in the first week of December started to drop, with most sites falling to a 25 – 50mm deficit in available plant water. However, soil water levels rose back to field capacity and had several spikes of run off, which coincided with larger rain events recorded during December.
In the last two weeks of December and into January, sites saw a steeper fall in available soil water dropping to the temporary wilting point at the end of December or beginning of January. However the rain events recorded in the first two weeks of January, rose water levels back to field capacity at most sites.
If there are any periods of extended dry weather, it is likely that soils will start to dry out quickly.
The current moisture contents, at the start of December, at all sites in Northland is higher than average as well as the previous two seasons. The soil moisture deficit is calculated based on incoming daily rainfall (mm), outgoing daily potential evapotranspiration (mm), and a fixed available water capacity (the amount of water in the soil 'reservoir' that plants can use) of 150 mm” (NIWA).