January 2023 climate report
10 Feb 2023, 8:36 AM
Summary
- La Niña appears to have peaked in intensity and has begun weakening, however is still the main driver of conditions for the end of summer and into autumn.
- Temperatures and rainfall likely to continue to be “above normal” between February – April, with a high likelihood of heavy rain events at the end of February.
- The average rainfall for Northland in January was 485% of what was expected, with a range of 977% - 174%.
- Standardised rainfall for 3 and 6-month periods showed that all of Northland has recorded “near average – wet” conditions.
- River flows and ground water levels are “above normal” for the whole Northland region.
- Soil moisture levels are higher than average, with large rain events causing substantial run off, all sites remain at of close to field capacity, but dry out quickly during dry periods.
Outlook
February to April 2023
La Niña conditions, along with marine heatwave conditions throughout January have resulted in unprecedented rainfall amounts and higher than average temperatures. During February – April, La Niña is predicted to weaken, but is still likely to be the main driver of weather events. There is a potential for stormy weather from ex-tropical storms to bring flooding, heavy rainfall, and coastal hazards in mid to late February. Over the next three months temperature, rainfall and river flows are all likely to be “above average”.
For more details, please refer to NIWA’s seasonal climate outlook for February - April 2023:
See the seasonal climate outlook on NIWA's website: niwa.co.nz
NIWA Temperature, Rainfall, Soil Moisture and River Flows probabilities for the period of February to April 2023
(Expressed as % likelihood for either Above Average, Near Average or Below Average conditions).
| Temperature | Rainfall | Soil moisture | River flows | |
| Above average | 65• | 45• | 45• | 50• |
| Near average | 30 | 35 | 45• | 40 |
| Below average | 05 | 20 | 10 | 10 |
Rainfall
The rainfall totals in January for Northland have been outstandingly high, and one of the wettest months that has been recorded in Northland. With an average total of 366 mm, which is 485% of the expected January rainfall, the highest rainfall amounts were recorded in the central and eastern areas of Northland, with over 17 sites recording greater than 500% of their individual expected totals.
The maximum rainfall was recorded at Glenbervie Forest, with 709.5 mm, which was 912% of its expected fall. The highest difference from the site average was recorded in Bream Bay at Marsden Point, which recorded 977%.
At the other end of the spectrum, Cape Reinga and Poutō Point recorded the lowest rain totals for the month, with 166.8 mm and 118 mm respectively. Both sites were higher than expected with Cape Rēinga recorded rainfall being 174% of its median and Poutō Point 185% of its median.
When looking at January totals for the long term record from Whakapara at Puhipuhi, with continuous record extending back to 1905, the 2023 January total of 618.5mm has only been exceeded by January 1989 (709.6mm).
Rainfall (% of Median) for January 2023 across Northland with a range of 977% to 174%
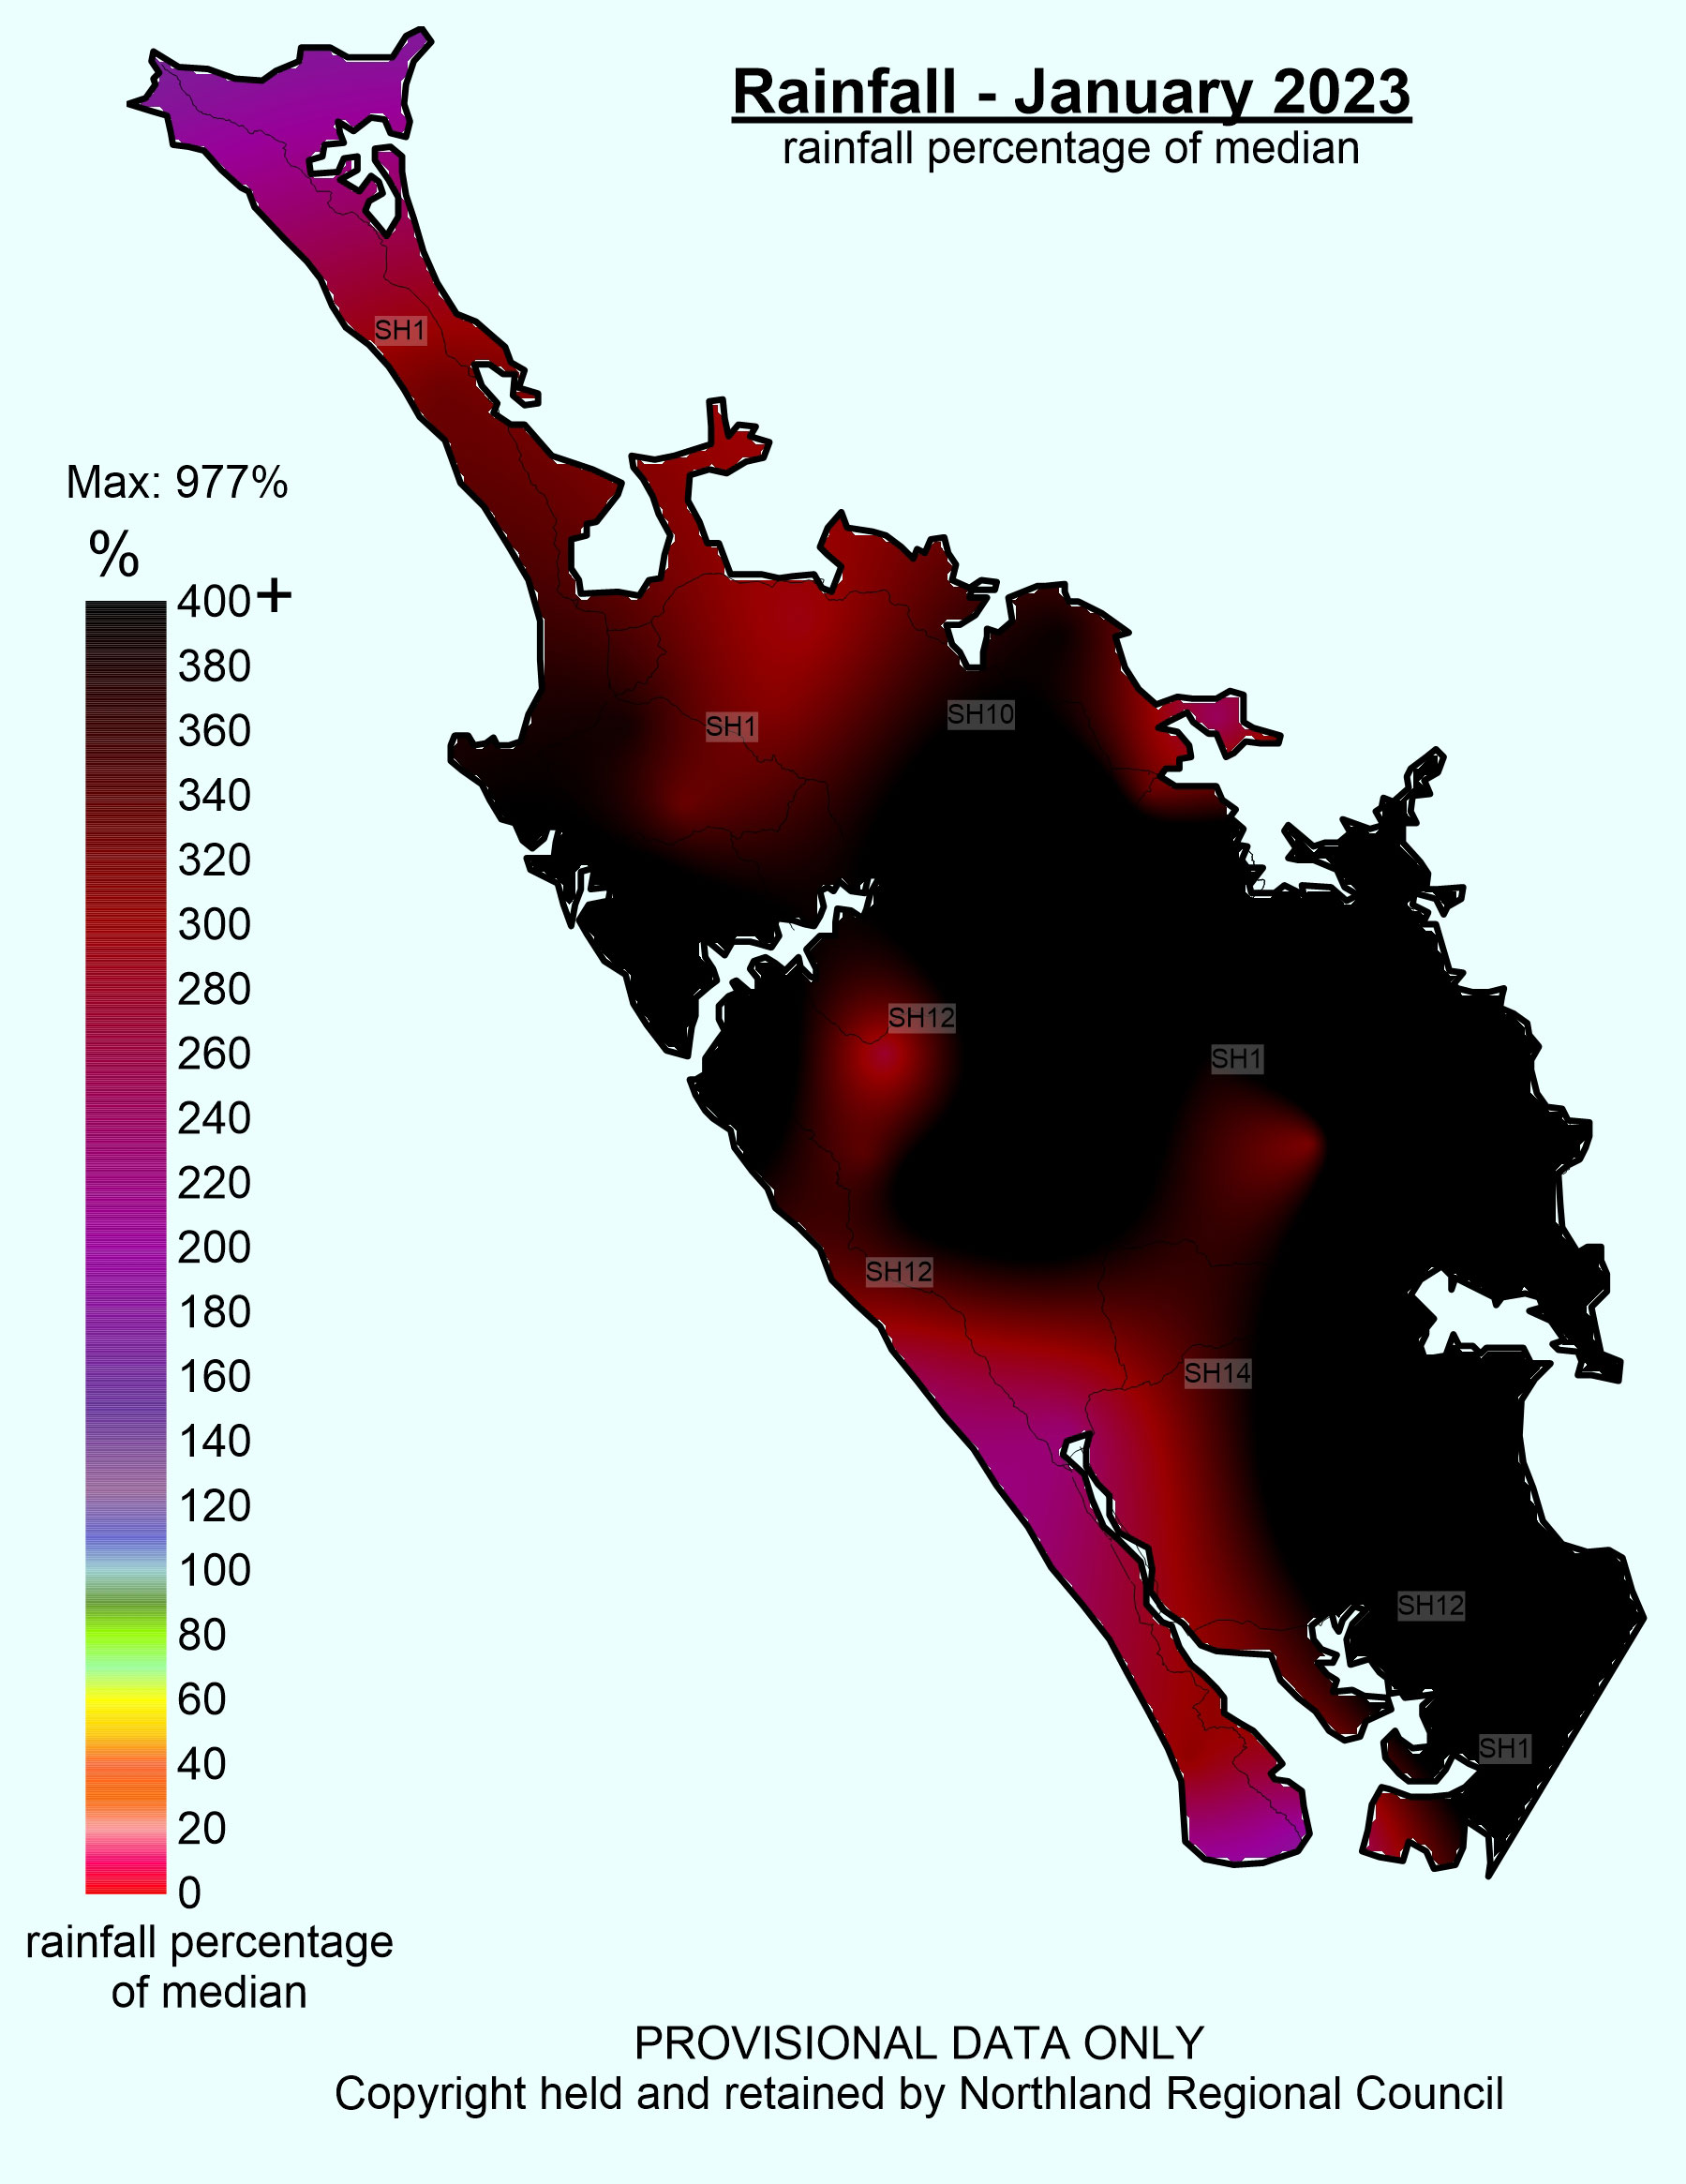
Rainfall (% of Median) for January 2023 across Northland.
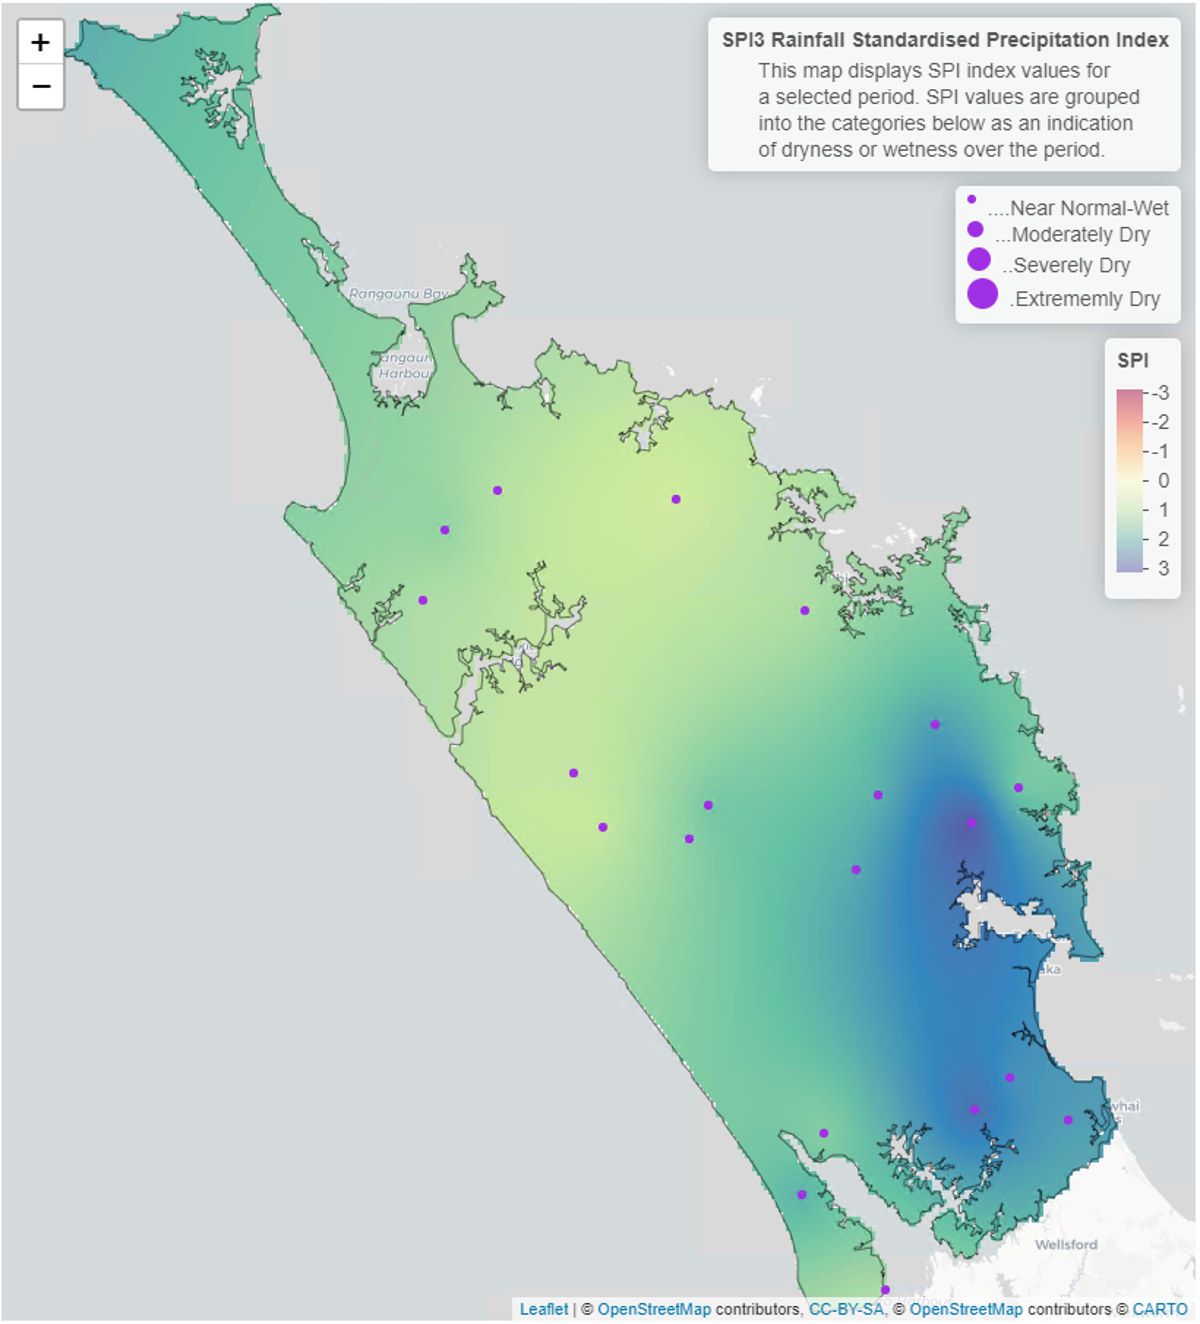
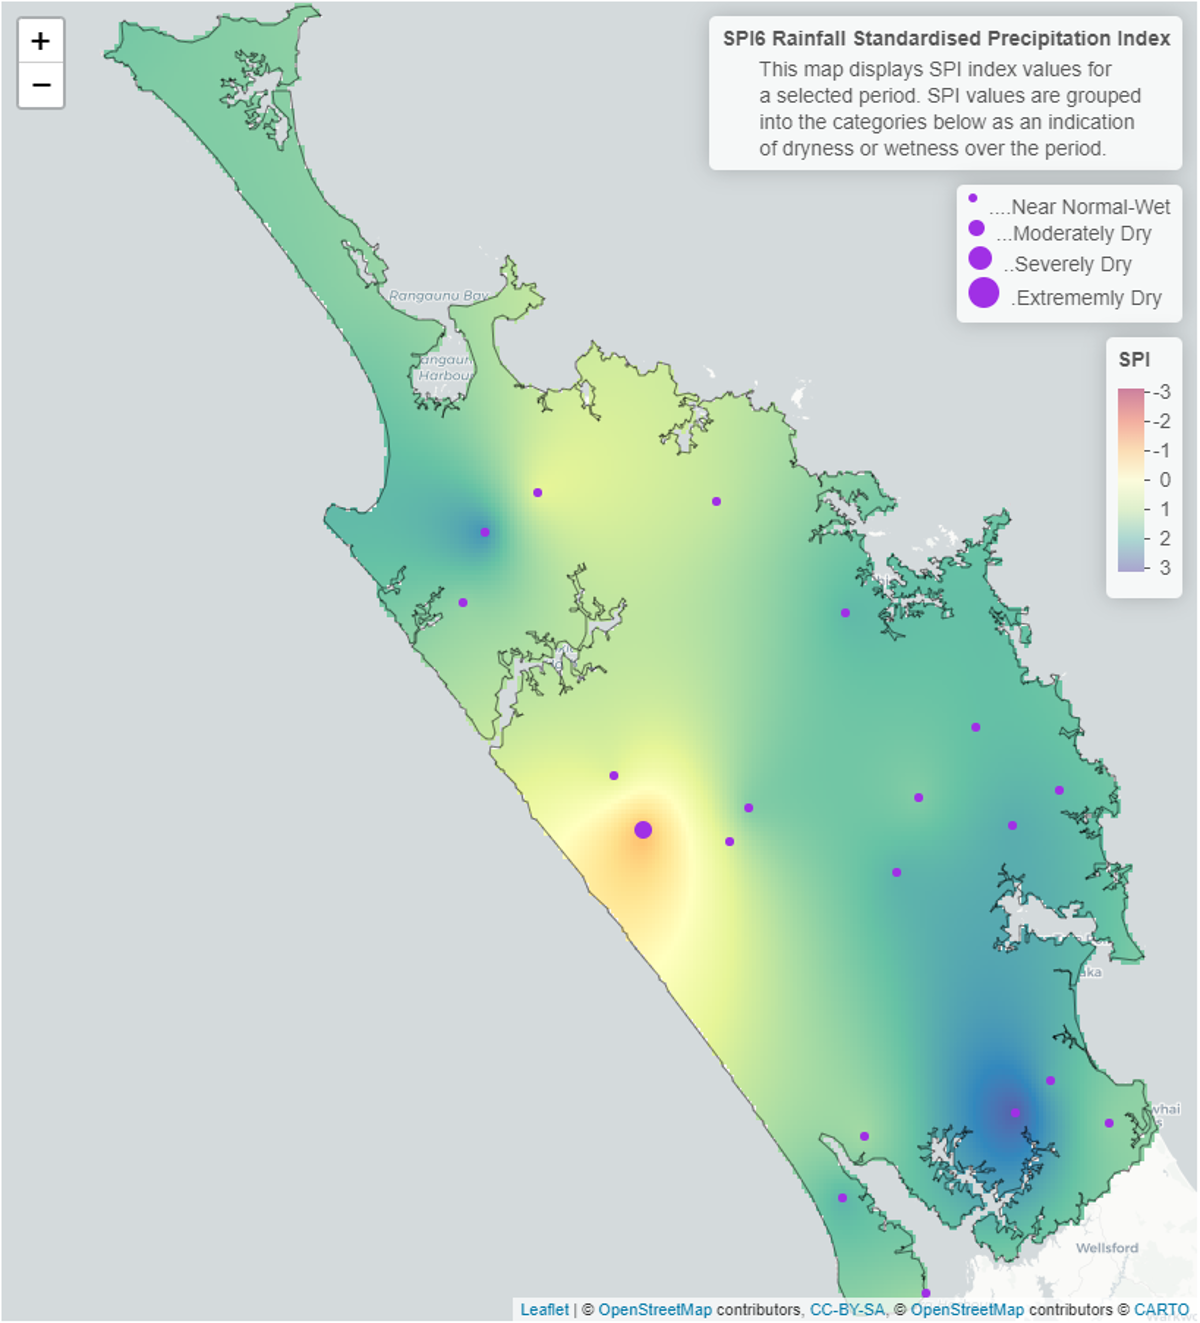
Standardised Precipitation index (SPI)
The Standardised Precipitation Index (SPI) on a three-month scale shows that all of Northland has been “near normal or wetter” between November to January. This has been driven by both November and January rainfall being substantially higher than average for the region.
The six-month SPI shows “near normal or wetter” conditions for most of Northland from August to January. However on the west coast at Kai Iwi Lakes, due to equipment faults, the areas appear to be “moderately dry”, which should be disregarded.
3 and 6-Month SPI (Standardised Precipitation Index) maps to January 2023
River flow
During January, river flows were driven by the far higher than average rainfalls recorded in Northland. With all key catchments recording “above normal” flows for January.
Monthly percentile river flows for January 2023
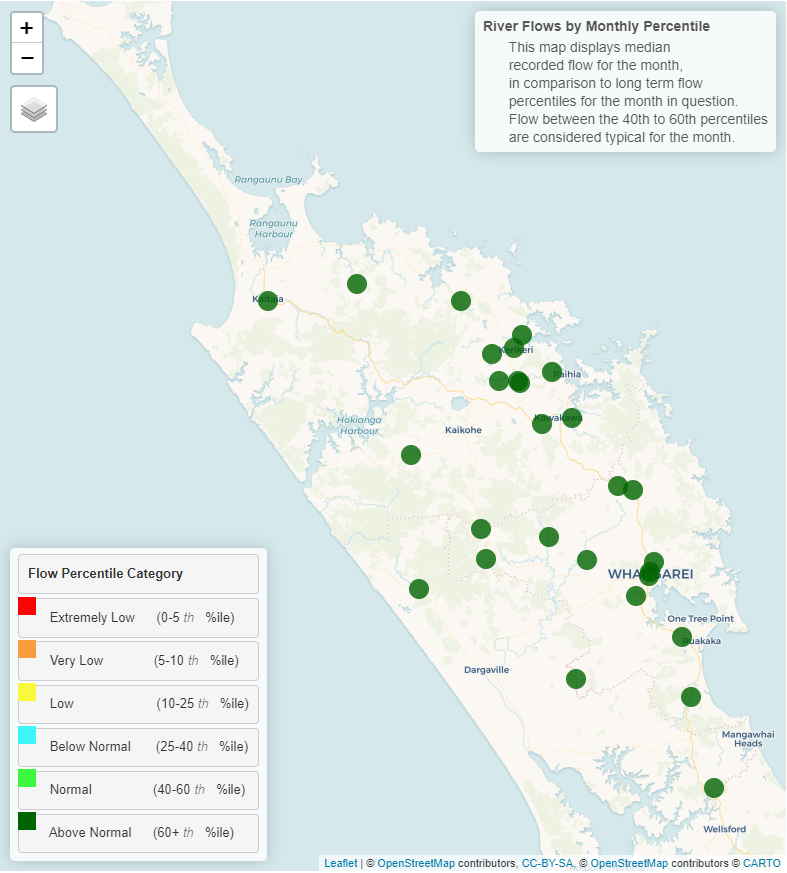
Monthly percentile River Flows for January 2023.
Groundwater
All key aquifers in Northland are currently recording “Above Normal” water levels for January.
| Aquifer | Status | Percentile |
| Aupōuri | Above normal | 60th+ |
| Taipā | Above normal | 60th+ |
| Russell | Above normal | 60th+ |
| Kaikohe | Above normal | 60th+ |
| Poroti | Above normal | 60th+ |
| Whangārei | Above normal | 60th+ |
| Mangawhai | Above normal | 60th+ |
| Marsden - Ruakākā | Above normal | 60th+ |
| Ruawai | Above normal | 60th+ |
Groundwater map for January 2023
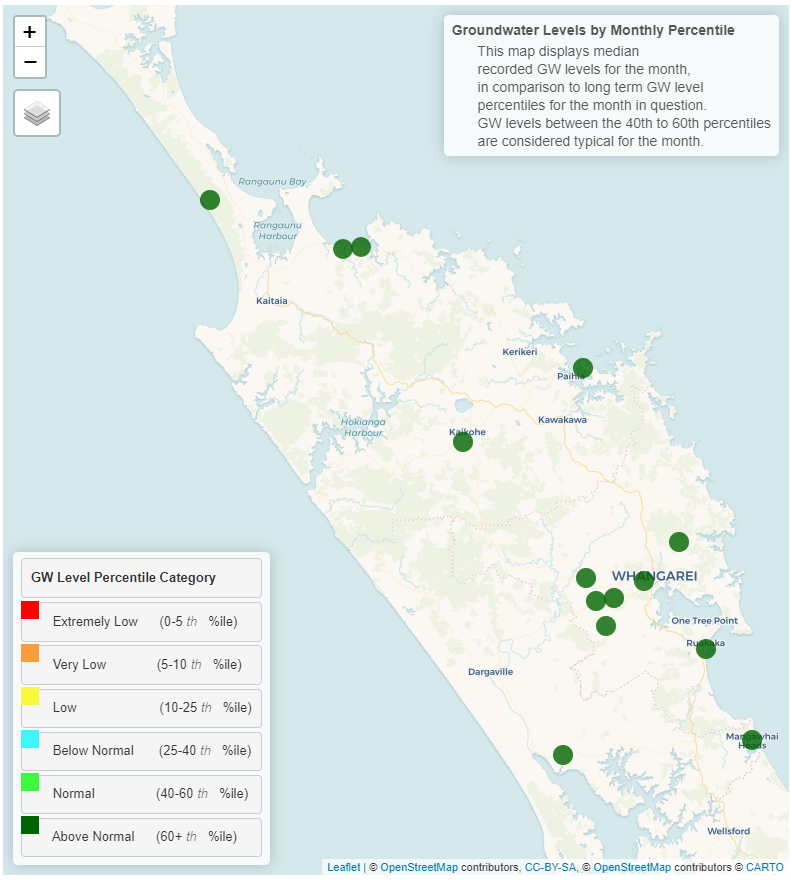
Groundwater map for January 2023.
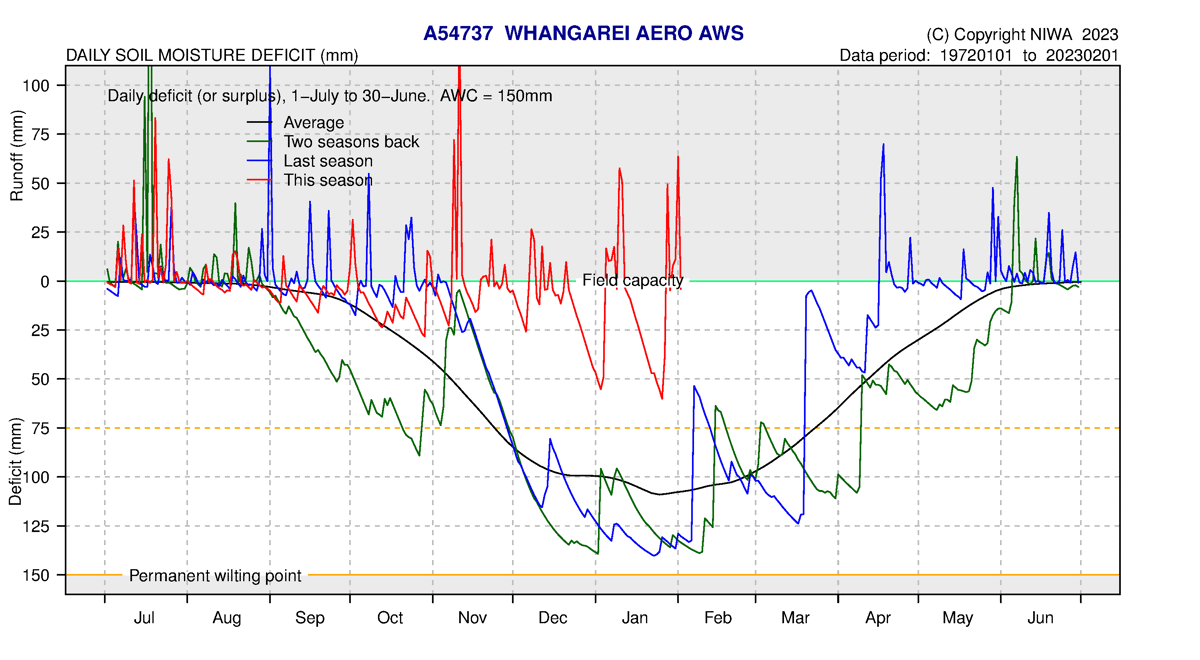
Soil moisture
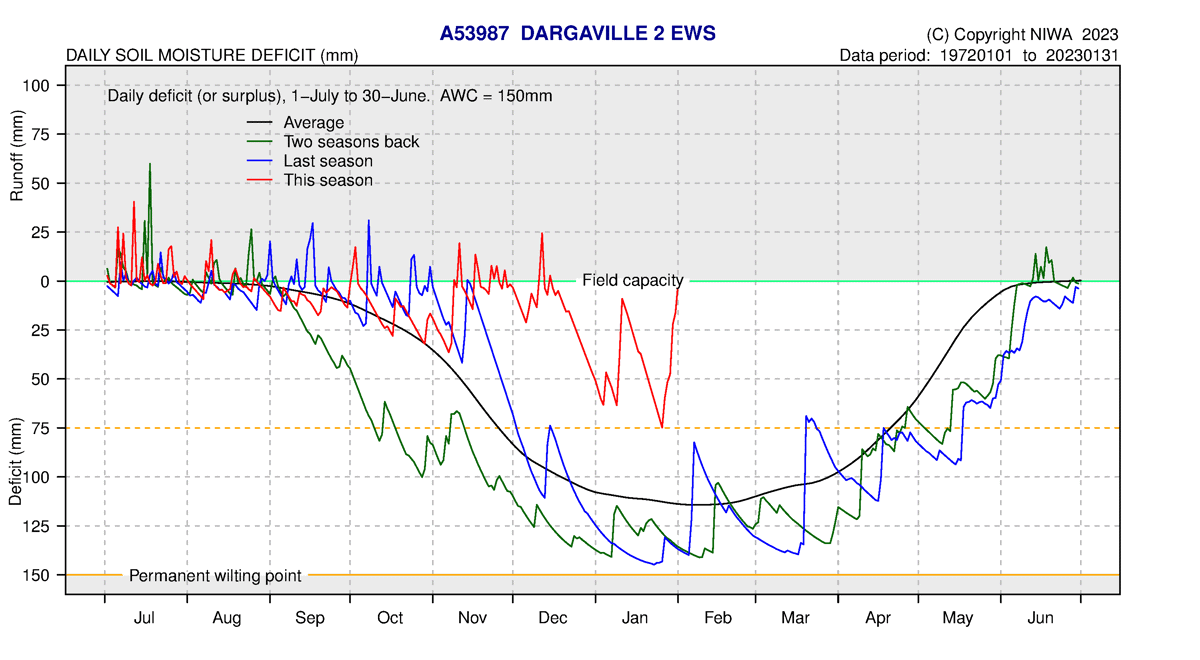
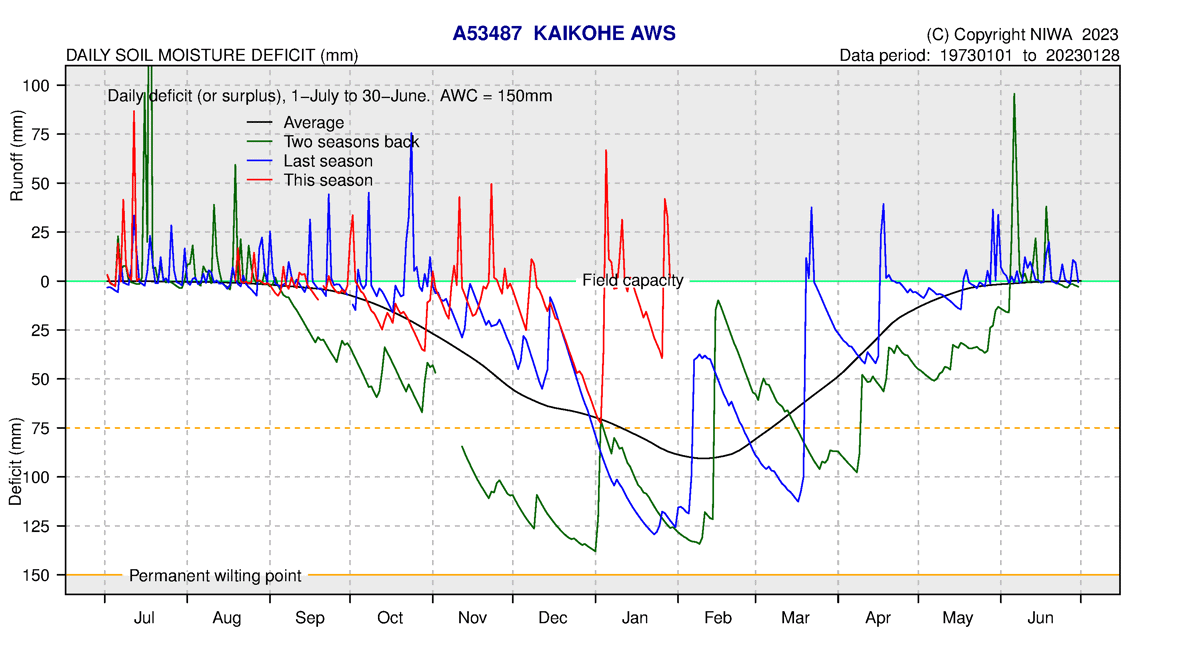
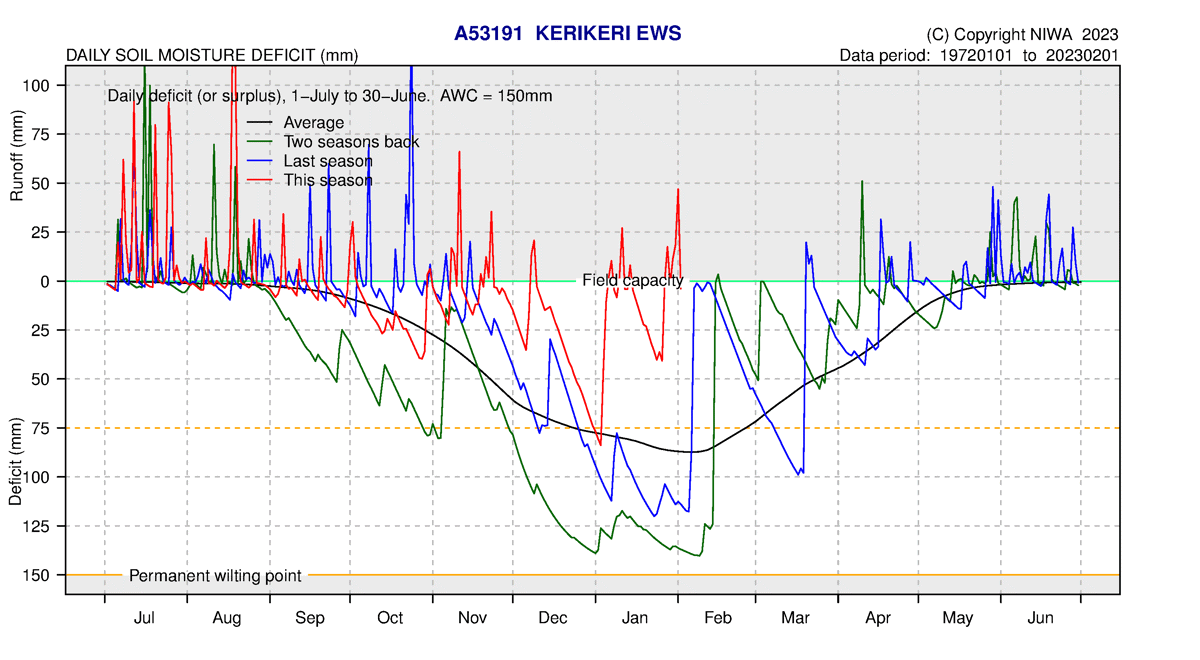
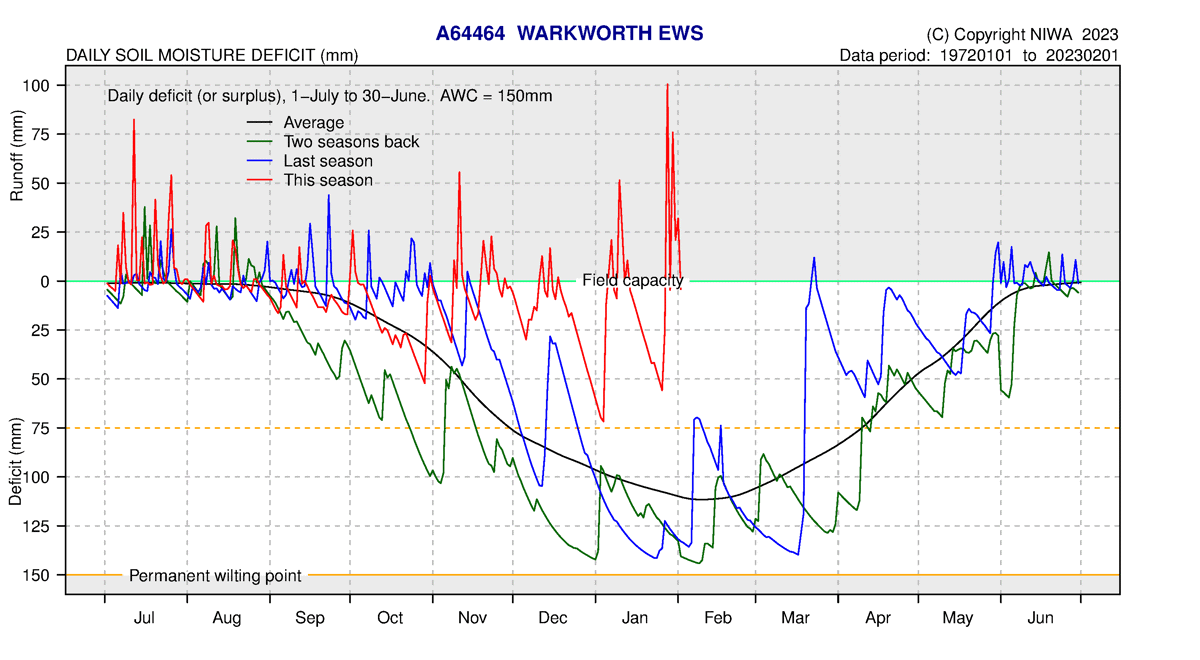
Across Northland soil moisture was higher far higher than average during January with soil water levels at most sites remaining close to field capacity.
Heavy rain events caused surface run off of between 15–100 mm at all sites except on the west coast (Dargaville) which recorded a rise in soil water levels with each rain event but only to field capacity. While rain events filled the soil capacity, during fine spells soils quickly dried out, with some sites experiencing temporary wilting of plants (75 mm deficit), due to the above average summer temperatures.
The soil moisture deficit is calculated based on incoming daily rainfall (mm), outgoing daily potential evapotranspiration (mm), and a fixed available water capacity (the amount of water in the soil 'reservoir' that plants can use) of 150 mm” (NIWA).