August 2022 climate report
9 Sep 2022, 9:22 AM
Summary
- La Nina is likely to drive the climate through out spring, with Northland set to have above average temperatures and near average rainfall, soil moisture and river flows.
- Northland had 107 % of the expected rainfall for the region, however this was concentrated to the east coast and north. With a range in expected rainfall for the month of 31% - 195 %.
- Standardised precipitation at a three and six month scale recorded near normal or wetter than expected rainfall levels for all of Northland.
- River flows on the east coast of Northland were either Above Normal or Normal for August, while to the south and west river levels were lower than expected.
- All aquifers in Northland are currently at either Above Normal or Normal levels for August.
- Soil moisture is sitting around field capacity at all sites, with any rain events causing run off. This pattern is likely to continue through September – November.
Outlook
September to November 2022
During the upcoming spring the main driver of the climate is likely to be the La Nina which re-strengthened throughout August. Rainfall is likely to be above or near average with a mixture of long lasting high pressure systems interrupted with occasional sub - tropical lows. Soil moisture and river flow in Northland is likely to be normal for September – November, while temperatures are likely to be above average.
For more details, please refer to NIWA’s seasonal climate outlook for September-November 2022:
See the seasonal climate outlook on NIWA's website: niwa.co.nz
NIWA Temperature, Rainfall, Soil Moisture and River Flows probabilities for the period of September 2022 to November 2022
(Expressed as % likelihood for either Above Average, Near Average or Below Average conditions).
| Temperature | Rainfall | Soil moisture | River flows | |
| Above average | 70• | 35• | 25 | 20 |
| Near average | 25 | 40• | 45• | 45• |
| Below average | 05 | 25 | 30 | 35 |
Rainfall
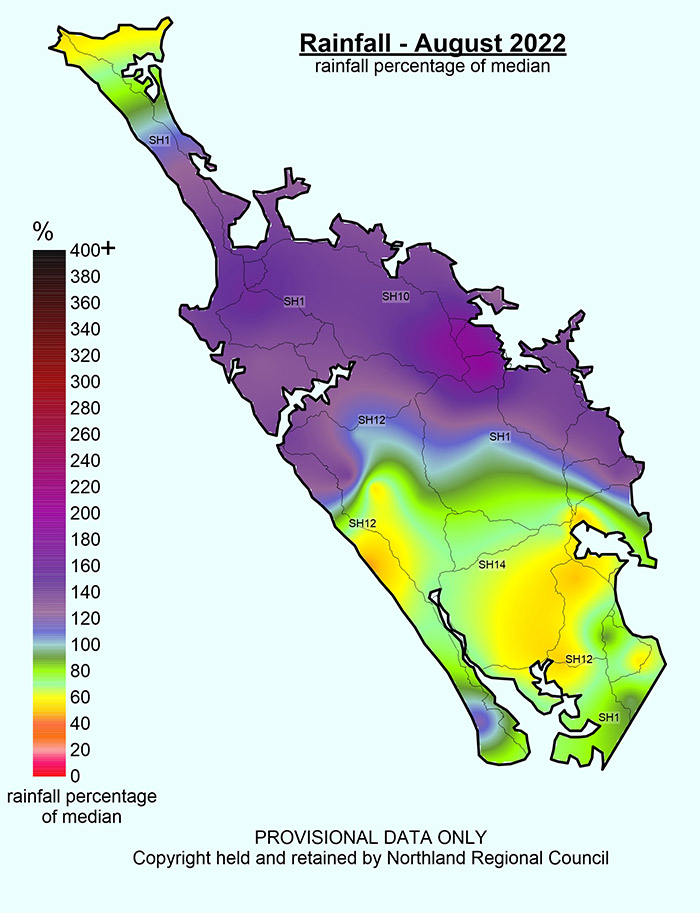
Rainfall varied greatly across Northland in August, ranging from 56.2mm at Cape Rēinga to 389.5mm at Waimamaku at Wekaweka Road and 347mm at Waitangi at Wiroa Road. On average Northland had 174 mm for August which is 107% of the expected fall for the region.
However Cape Rēinga and areas south of Whangārei received far less than expected (31% in Bream Bay, 43% at Kai Iwi Lakes, and 55% at Cape Reinga), while the north and east coast of Northland experienced heavy rain events and flooding, which led to higher than expected rainfall in Northland (195% at Waitangi at McDonald Road, 183% at Kerikeri, and 159% in Kaitaia).
Rainfall (% of Median) for August 2022 across Northland with a range of 31% to 195%
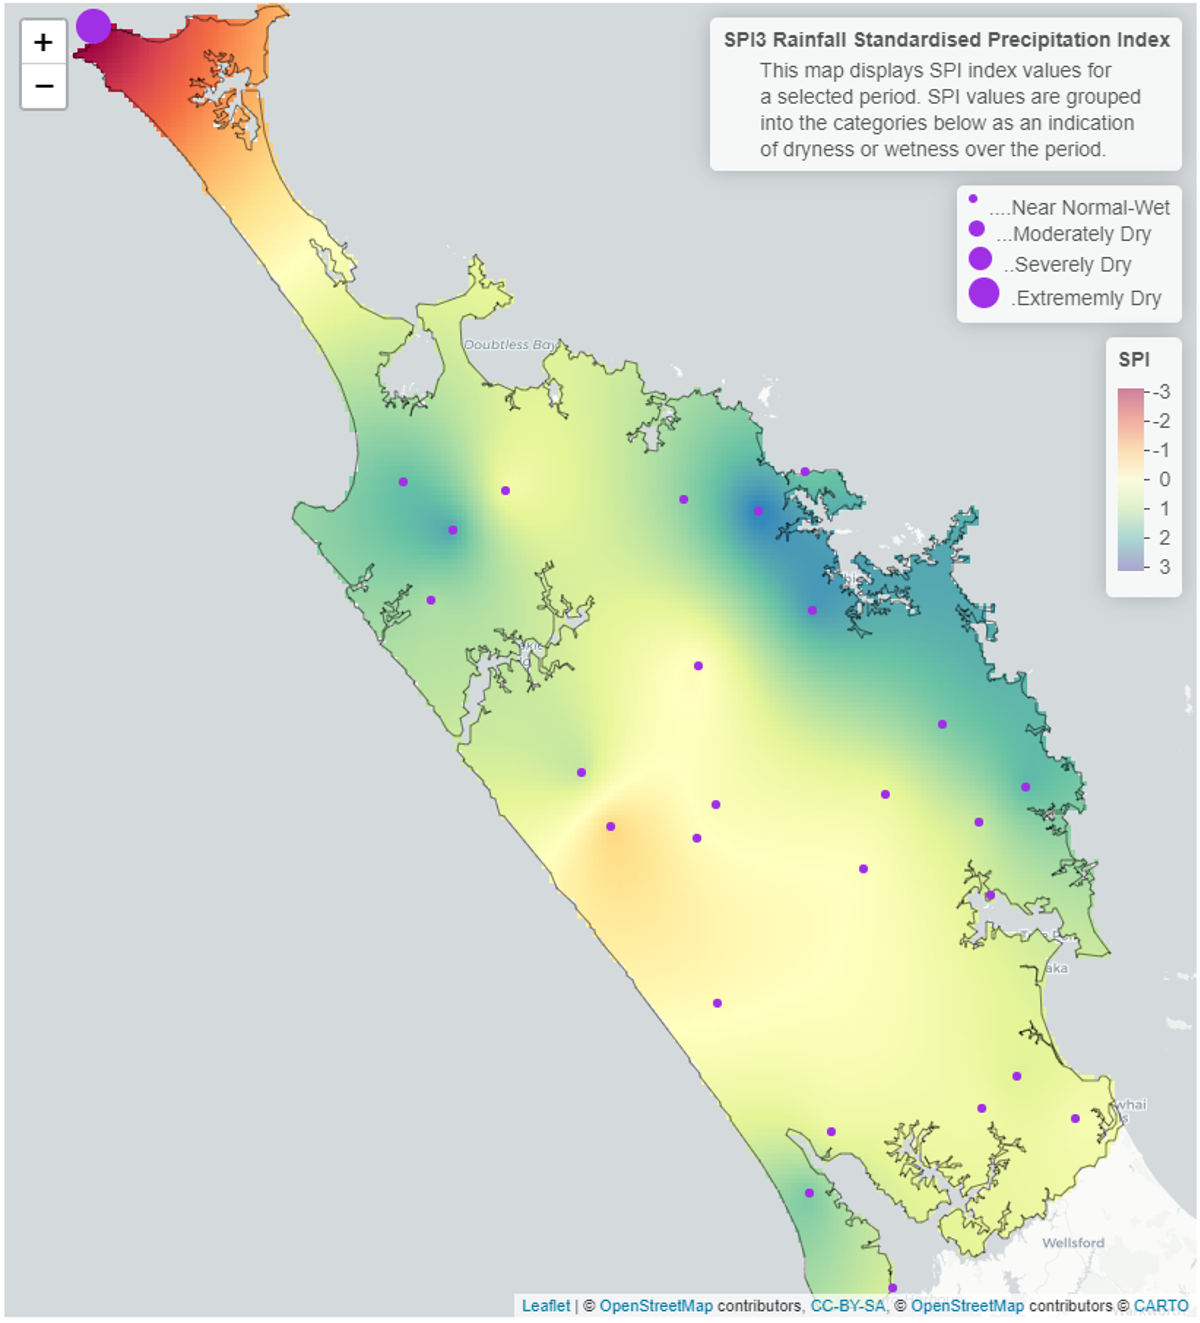
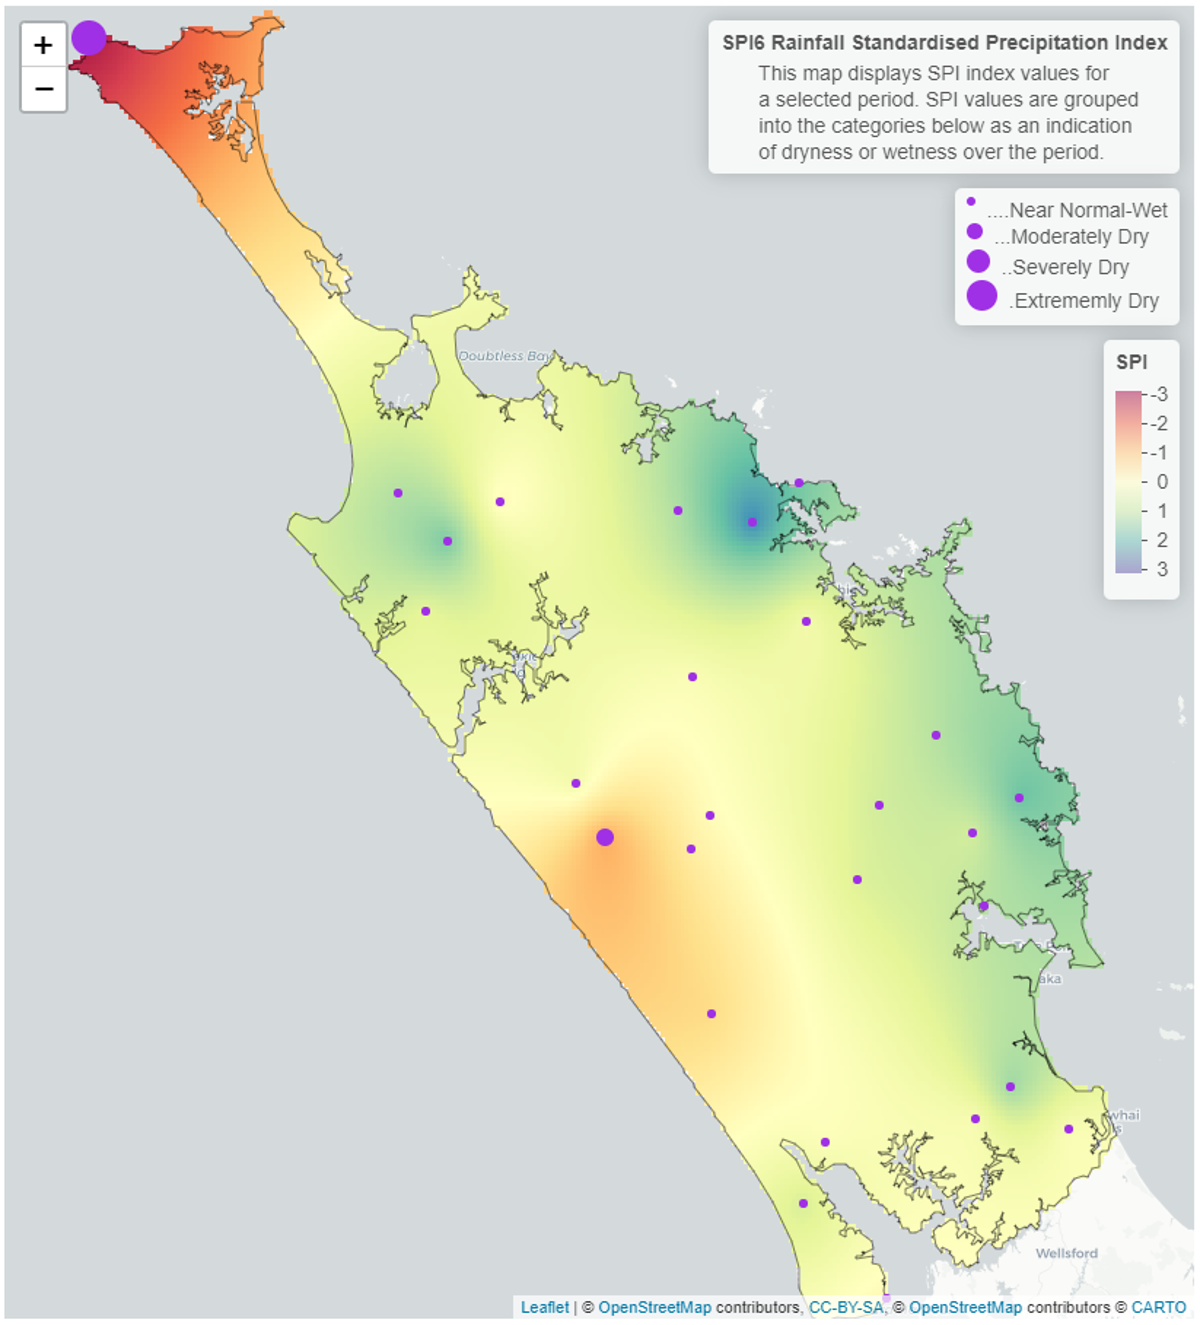
Standardised Precipitation index (SPI)
The Standardised Precipitation Index (SPI) on a three-month and six-month scale both show that rainfall in Northland has at most sites been near normal – to wetter than normal. At Cape Rēinga, due to equipment faults that Aupōuri Peninsula appears to be extremely dry, which should be disregarded.


River flow
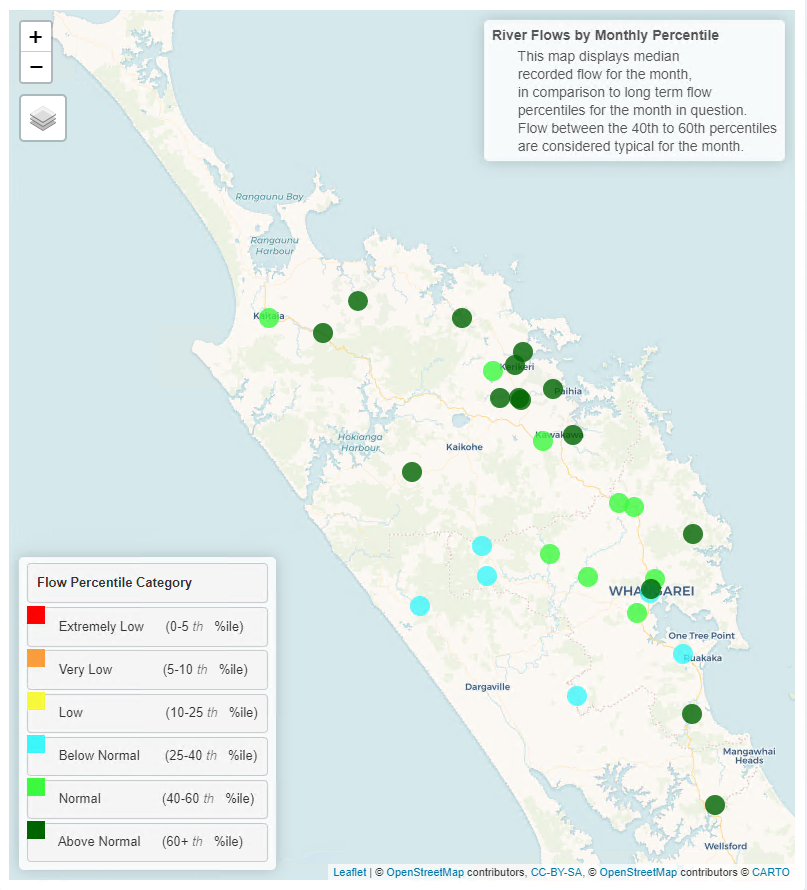
River flows in August in Northland showed a large range of variation with similar patterns to rainfall for the month. The east coast and northern catchments have mostly had “Above Normal” or “Normal” flows, while south of Whangārei and across to the west flows have been “Below Normal”, which is due to the below normal rainfall recorded in the same area.
Monthly percentile River Flows for August 2022
Groundwater
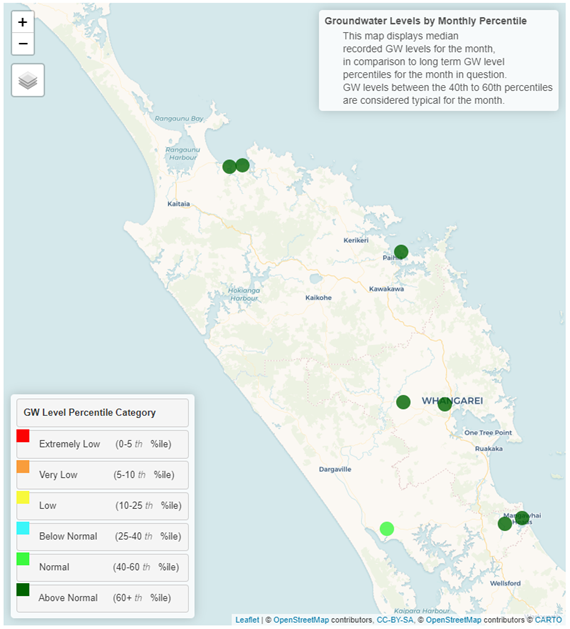
Majority of Aquifers in Northland are at “above Normal” levels for August. Compared to July groundwater levels increased in the Aupōuri and in Whangārei, while Ruawai declined back to the expected levels for August.
| Aquifer | Status | Percentile |
| Aupōuri | Above normal | 60th+ |
| Taipā | Above normal | 60th+ |
| Russell | Above normal | 60th+ |
| Kaikohe | Above normal | 60th+ |
| Poroti | Above normal | 60th+ |
| Whangārei | Above normal | 60th+ |
| Mangawhai | Above normal | 60th+ |
| Marsden - Ruakākā | Above normal | 60th+ |
| Ruawai | Normal | 40-60th |
Groundwater map for August 2022
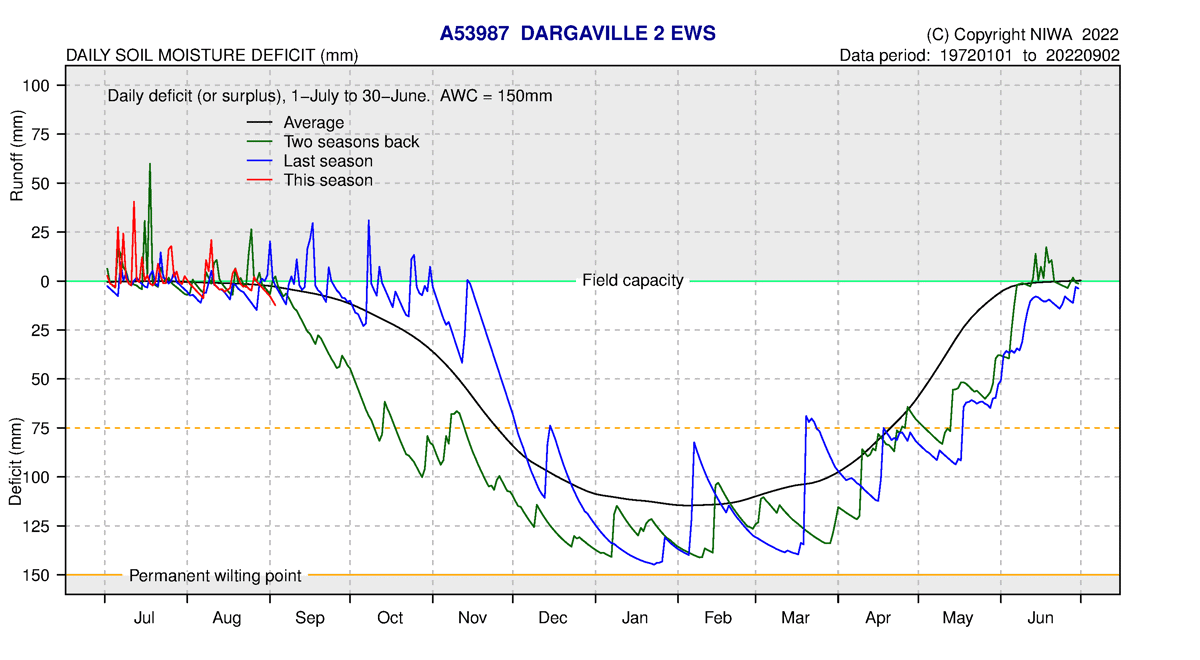
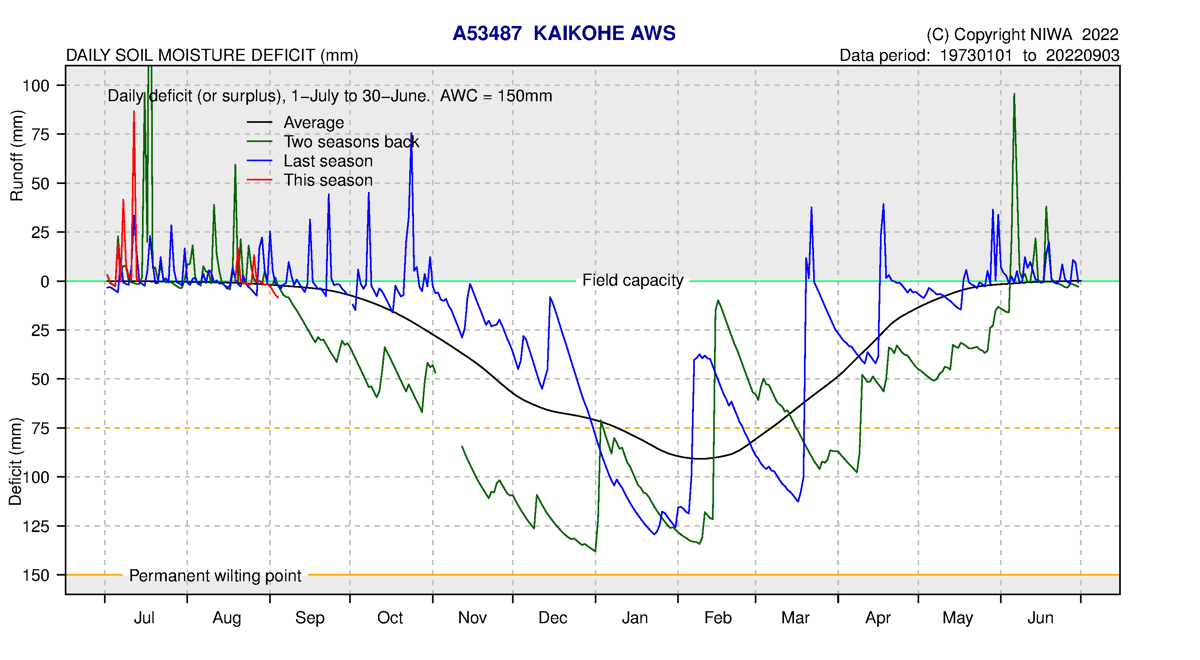
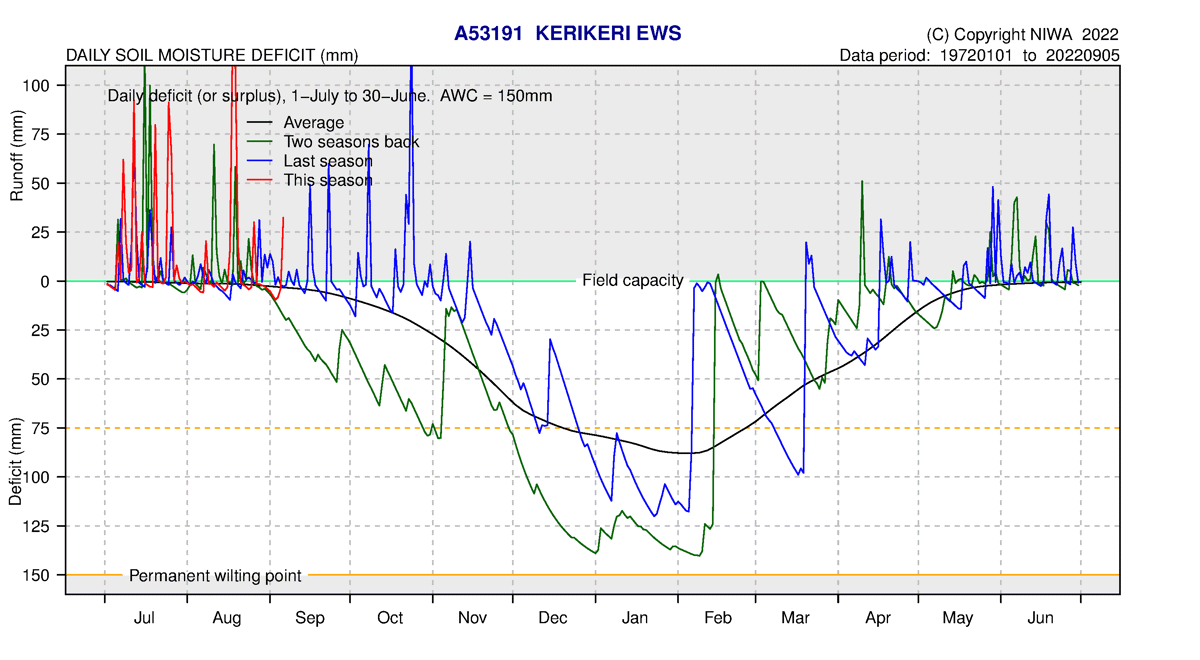
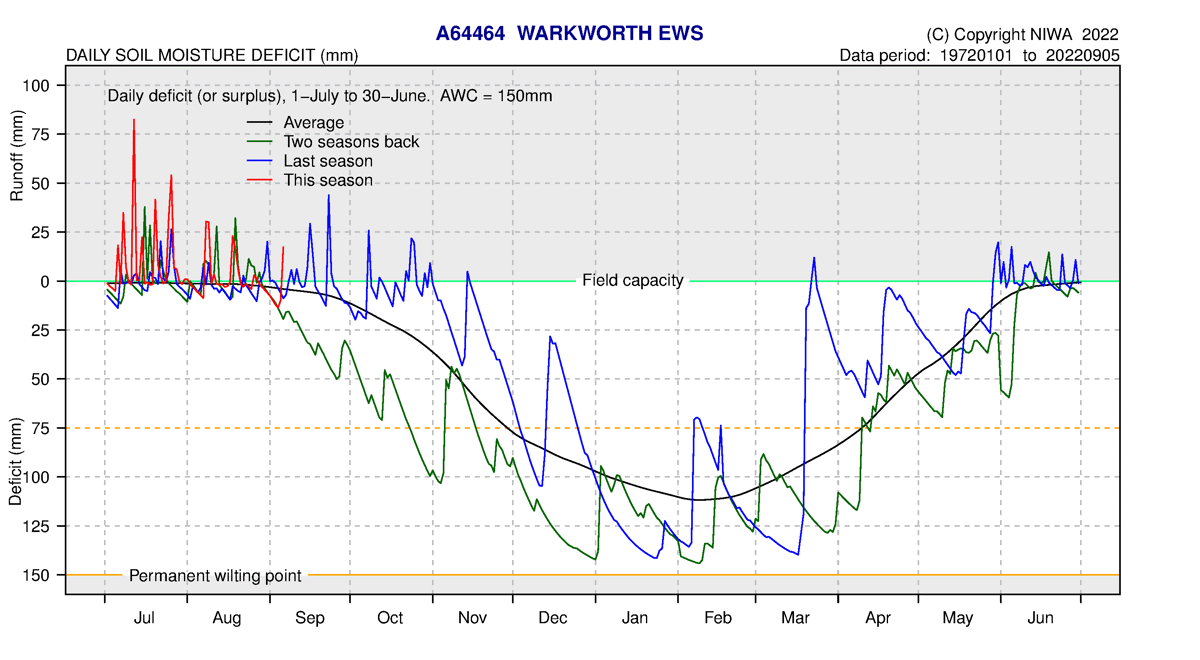
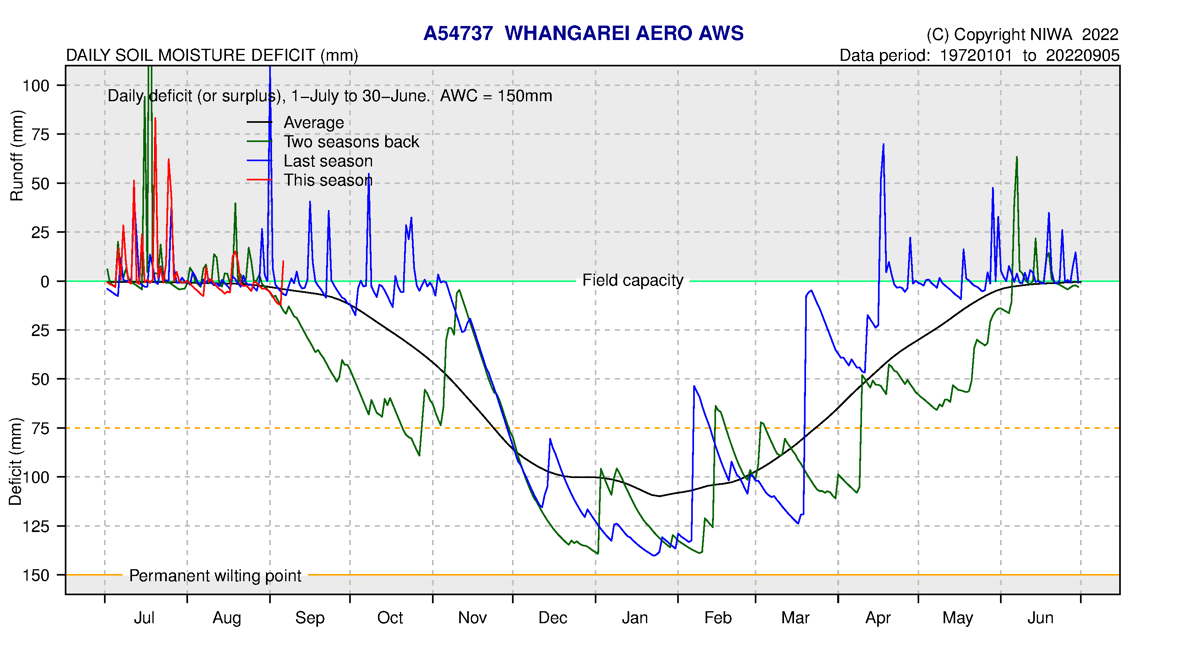
Soil moisture
Throughout August and into September soil moisture continued to be at field capacity or above, though the runoff peaks were generally lower compared to July. Further rainfall will result in run off and even small events could show some change in river levels. The soil moisture deficit is calculated based on incoming daily rainfall (mm), outgoing daily potential evapotranspiration (mm), and a fixed available water capacity (the amount of water in the soil 'reservoir' that plants can use) of 150 mm” (NIWA).