September 2022 climate report
5 Oct 2022, 10:48 AM
Summary
- La Nina is likely to drive the climate throughout spring and early summer, with Northland set to have “Above Average” temperatures and “Near Average” rainfall, soil moisture and river flows.
- Northland had 85 % of the expected rainfall for the region, with little variation across Northland with a range of 125% in the far north – 57% on the west coast.
- Standardised precipitation at a three and six month scale recorded “Near Normal or Wetter” than expected rainfall levels for all of Northland.
- River flows varied across Northland, however most rivers had “Above Normal” or “Normal” flows in the north and east, while in the south and west, rivers were lower than expected for September.
- Majority of aquifers in Northland are currently at either “Above Normal” or “Normal” levels for September. The exception being Ruawai which is “Low” for September.
- Soil moisture is sitting around field capacity at all sites, with any rain events causing run off.
Outlook
October to December 2022
The main climate driver for the end of spring and into summer (October – December 2002) is set to be La Nina conditions, which remain strong since July and August. The Indian Dipole has also strengthened and is likely to increase available moisture throughout October before weakening again. Temperatures are predicted to be “Above Average”, while rainfall, soil moisture and river flow are likely to be “Near Average” or “Above Average”. There is increased risk of cyclone activity in the Southwest Pacific due to cool La Nina conditions in the equatorial area, which may affect New Zealand. Sea surface temperatures for September were “Above Average” These conditions are modelled to continue for October – December leading to favourable conditions for a marine heatwave to develop.
For more details, please refer to NIWA’s seasonal climate outlook for October-December 2022:
See the seasonal climate outlook on NIWA's website: niwa.co.nz
NIWA Temperature, Rainfall, Soil Moisture and River Flows probabilities for the period of October 2022 to December 2022
(Expressed as % likelihood for either Above Average, Near Average or Below Average conditions).
| Temperature | Rainfall | Soil moisture | River flows | |
| Above average | 70• | 35• | 35• | 35• |
| Near average | 25 | 40• | 45• | 45• |
| Below average | 05 | 25 | 20 | 20 |
Rainfall
During September showery conditions dominated the weather in Northland but no particularly heavy storms were seen in the region.
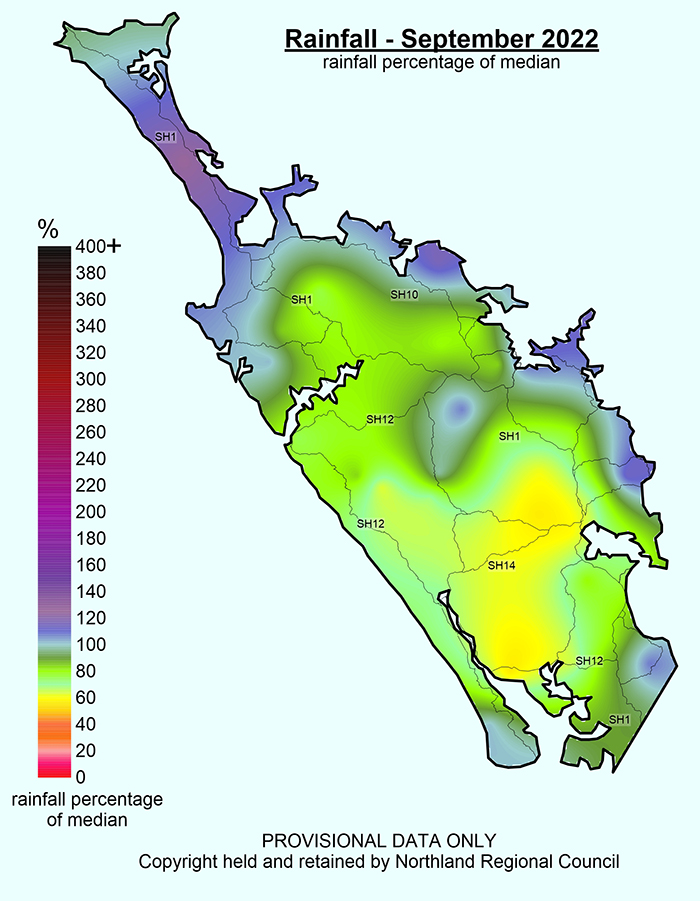
The majority of the region experienced less rainfall than expected, with Northland receiving 85% of the average September rainfall, with an average total of 110 mm. Waihopo in the far north received 125% while in the west Ruawai only received 57%. The maximum total was 207 mm in Waimamaku in the northwest, followed by Whangaroa with 193.5mm, the lowest recorded rainfalls were 59 mm in Ruawai, and Waipao west of Whangārei received 62.5 mm.
After a very wet July and August, totals and percentages were much lower for September for all areas of Northland, there was also less variation between the minimum and maximum rainfall sites as well as less range in the variation from average for September rainfall.
Rainfall (% of Median) for September 2022 across Northland with a range of 57% to 125%
Standardised Precipitation index (SPI)
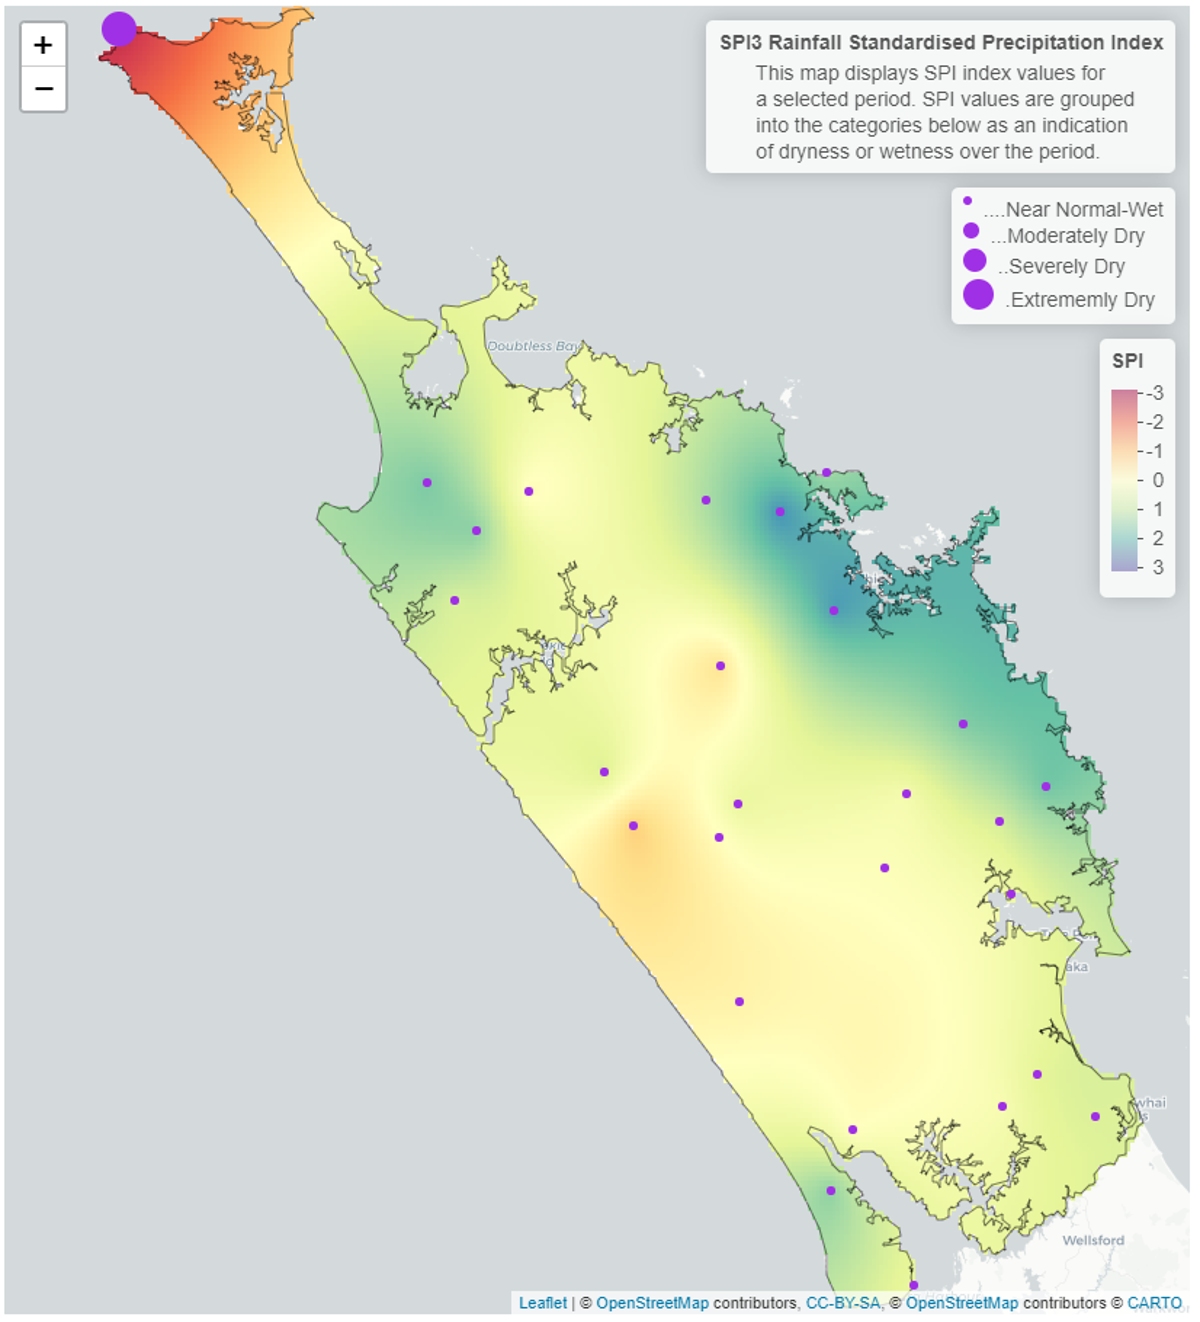
The standardised Precipitation Index (SPI) on a three-month continues to show the same patterns seen throughout winter in Northland with rainfall at most sites being “Near Normal or Wetter” than normal.
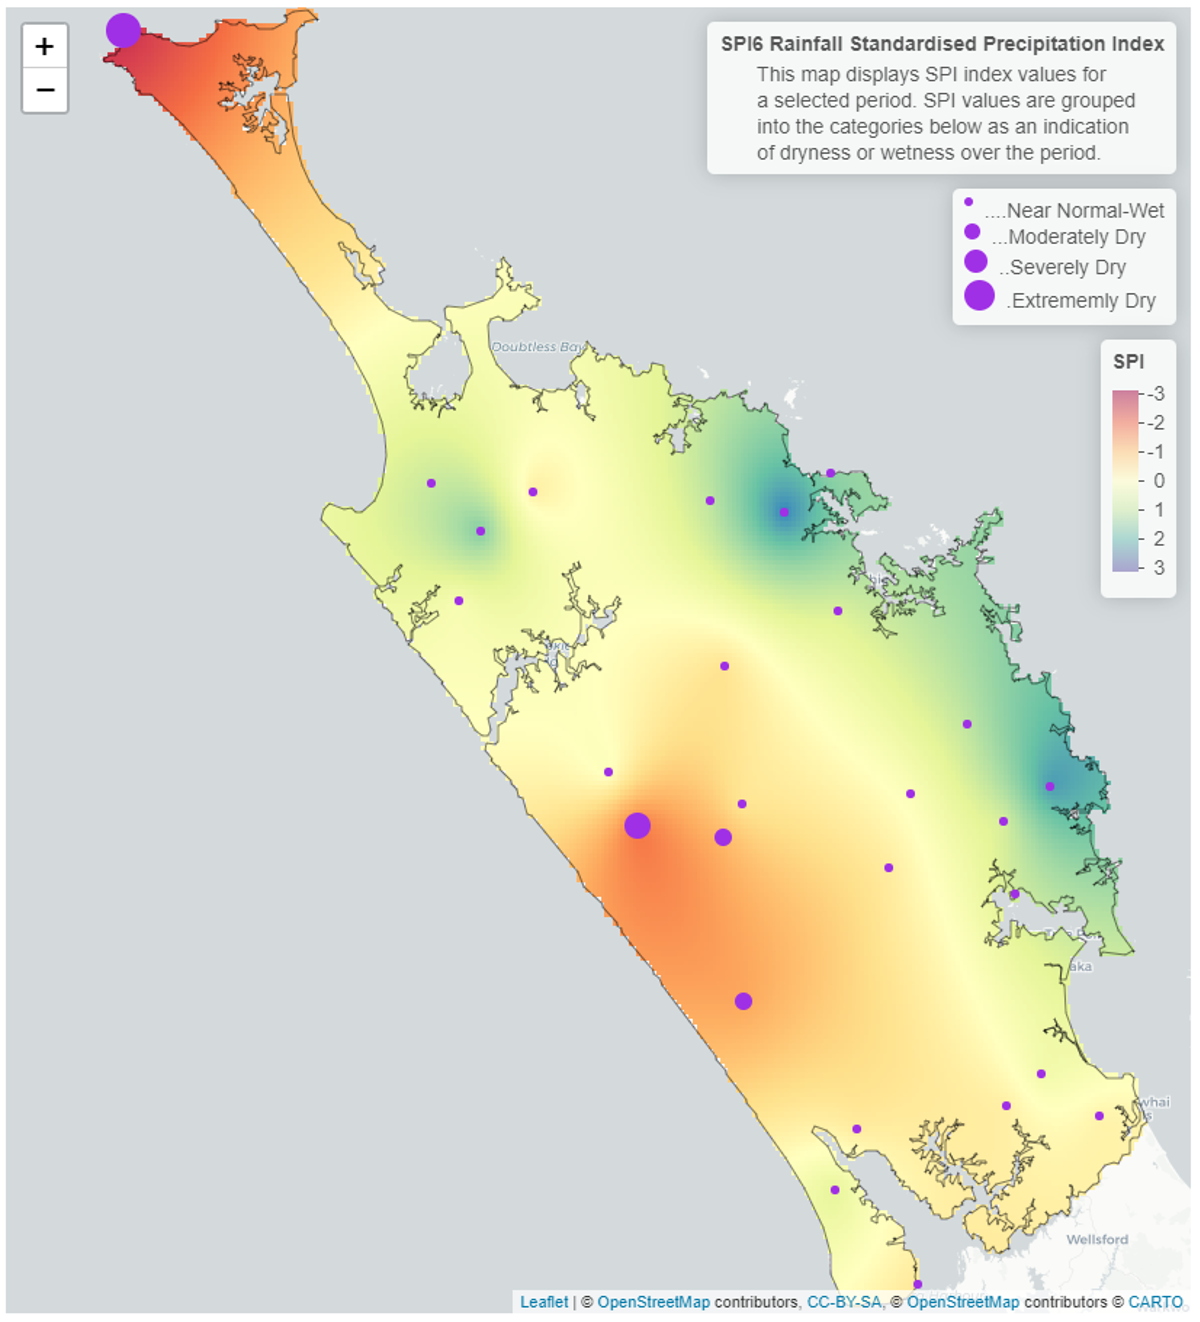
At Cape Reinga, due to equipment faults that Aupōuri Peninsula appears to be extremely dry, which should be disregarded. The six-month SPI shows “Moderately Dry” (the “Severely Dry” conditions seen at Kai Iwi are due to instrument failure) conditions in the west of Northland, while rainfall in the central, east, and northern areas of Northland has been “Near Normal to Wet”.


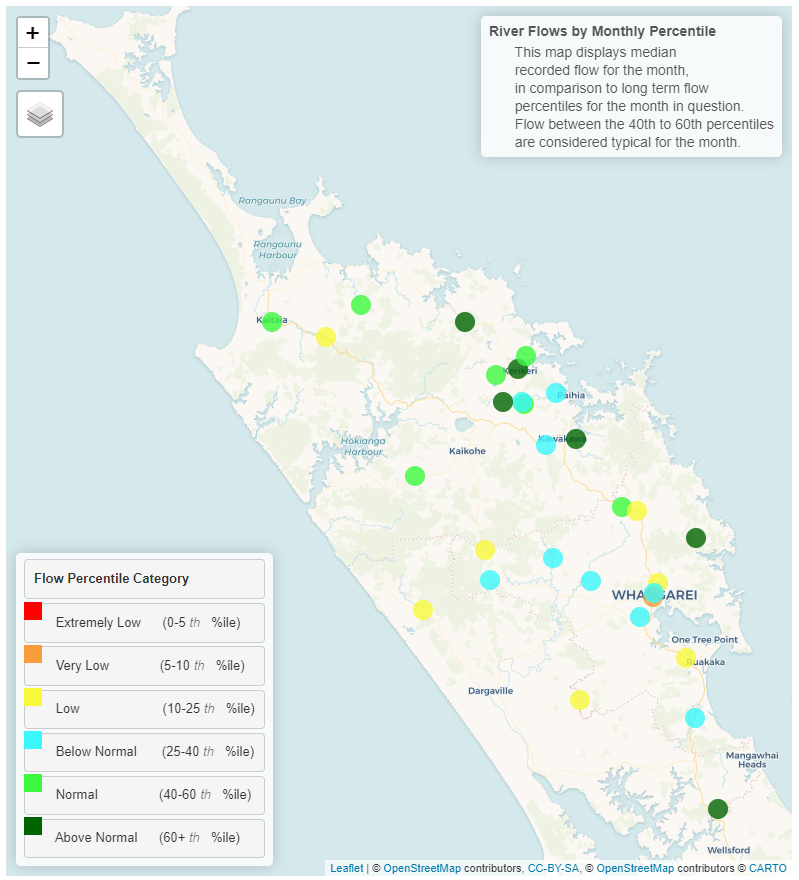
River flow
River flows during September has varied greatly across Northland. Many catchments in the north and east have been either “Above Normal” or “Normal”, however exceptions to this have been the Victoria River which recorded “Low” flows for September, and the Waitangi River which was “Below Normal”.
In the south and west of Northland, river flows were generally either “Below Normal” or “Low” for September, exceptions to this were the Hakaru River on the southern boundary recording “Above Normal” flows, while the Raumanga River in Whangārei recorded “Very Low “flows of what was expected in September. The variation in river flows is likely due to no large regional rain events, but rather inflows driven but smaller convection activity causing localised storms, and variations in how soil types in each catchment drain.
Monthly percentile River Flows for September 2022
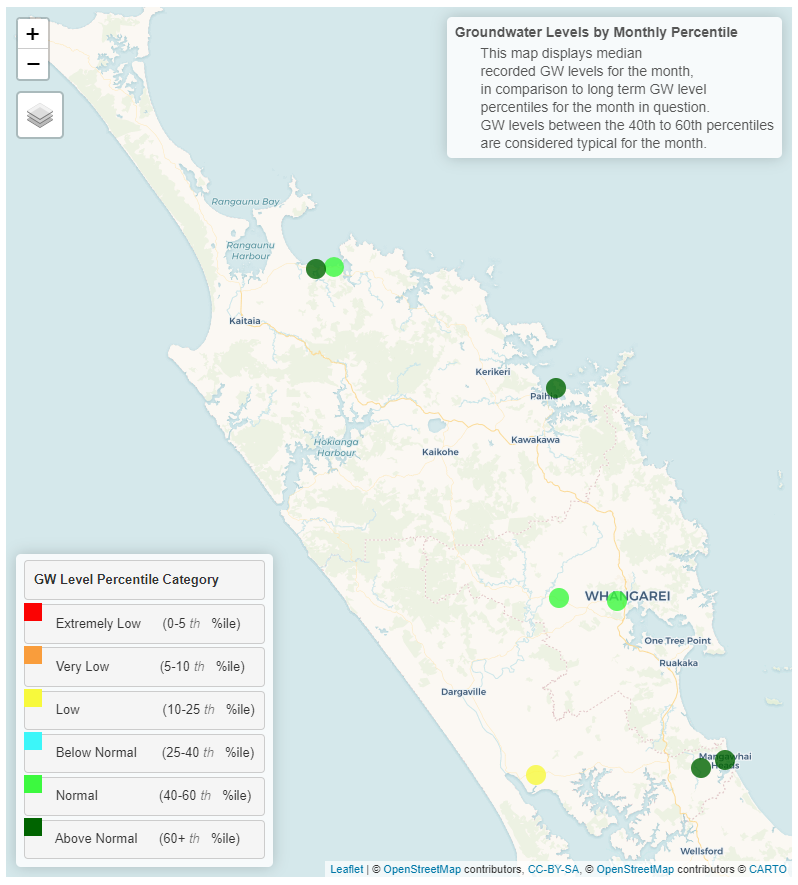
Groundwater
Majority of aquifers in Northland continue to be “Above Normal” or “Normal” water levels for September. Compared to July and August the Ruawai aquifer continued to decline from its average, with the water level in September being “Low” for what is expected for the month.
| Aquifer | Status | Percentile |
| Aupōuri | Above normal | 60th+ |
| Taipā | Above normal | 60th+ |
| Russell | Above normal | 60th+ |
| Kaikohe | Normal | 40-60th |
| Poroti | Normal | 60th+ |
| Whangārei | Normal | 60th+ |
| Mangawhai | Above normal | 60th+ |
| Marsden - Ruakākā | Above normal | 60th+ |
| Ruawai | Low | 10-25th |
Groundwater map for September 2022
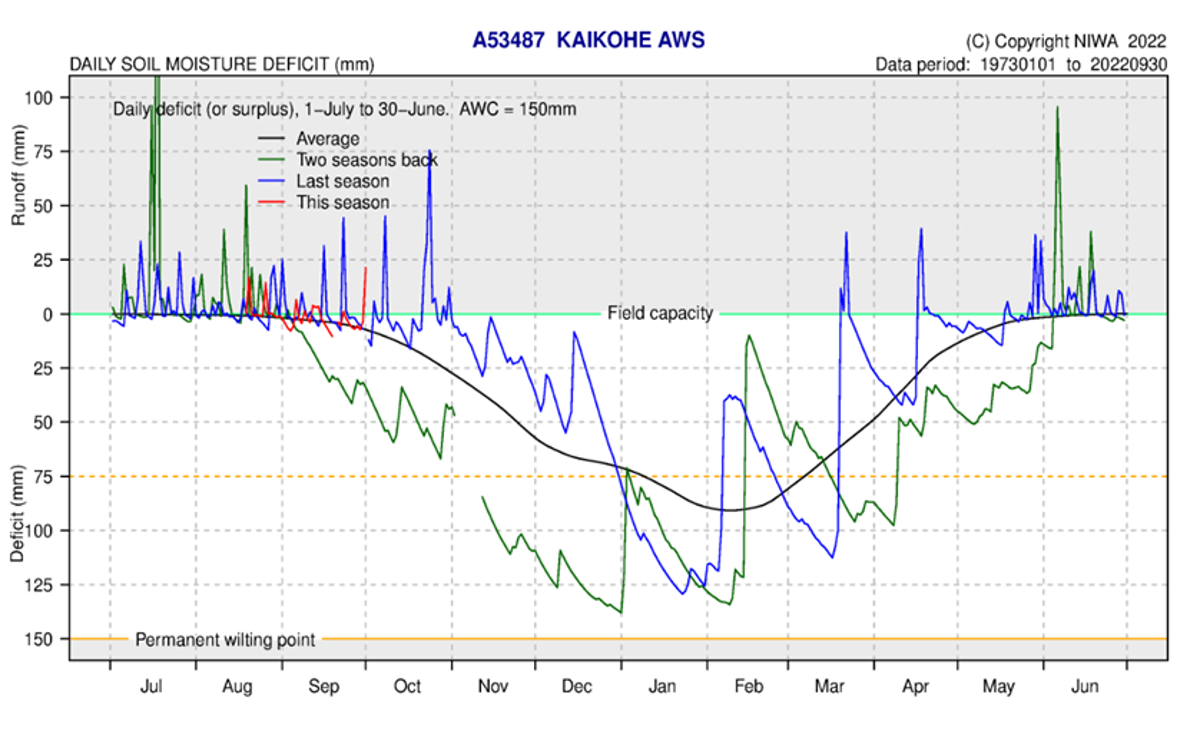
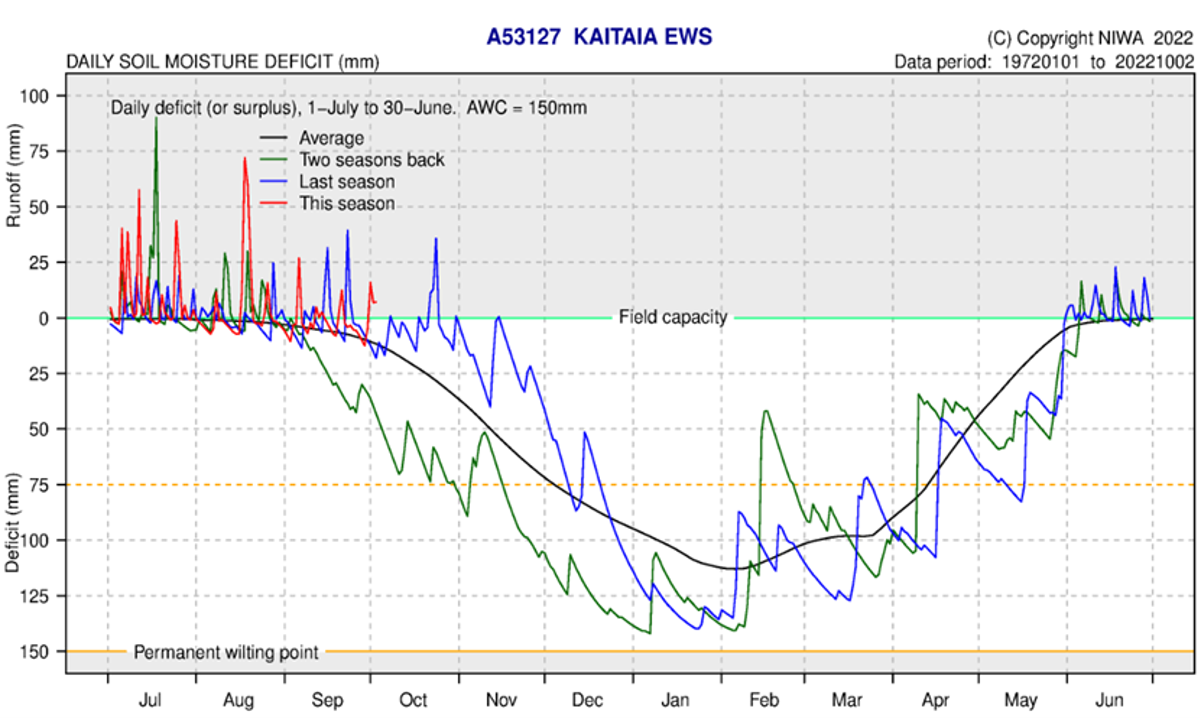
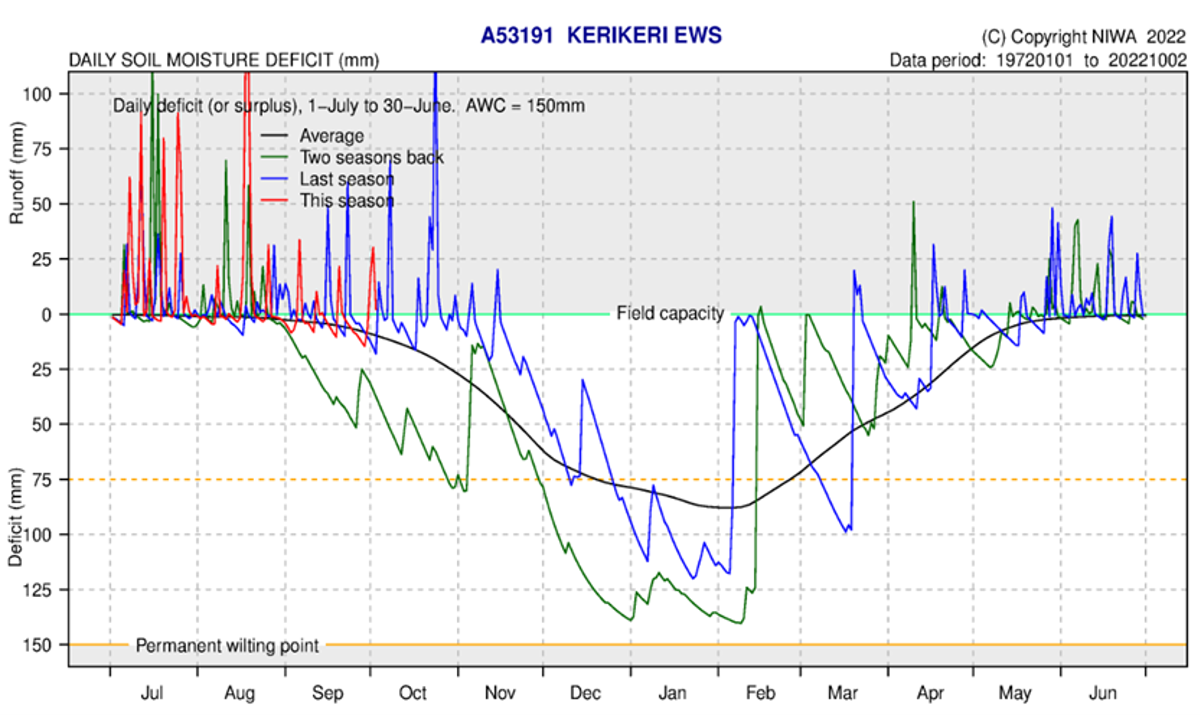
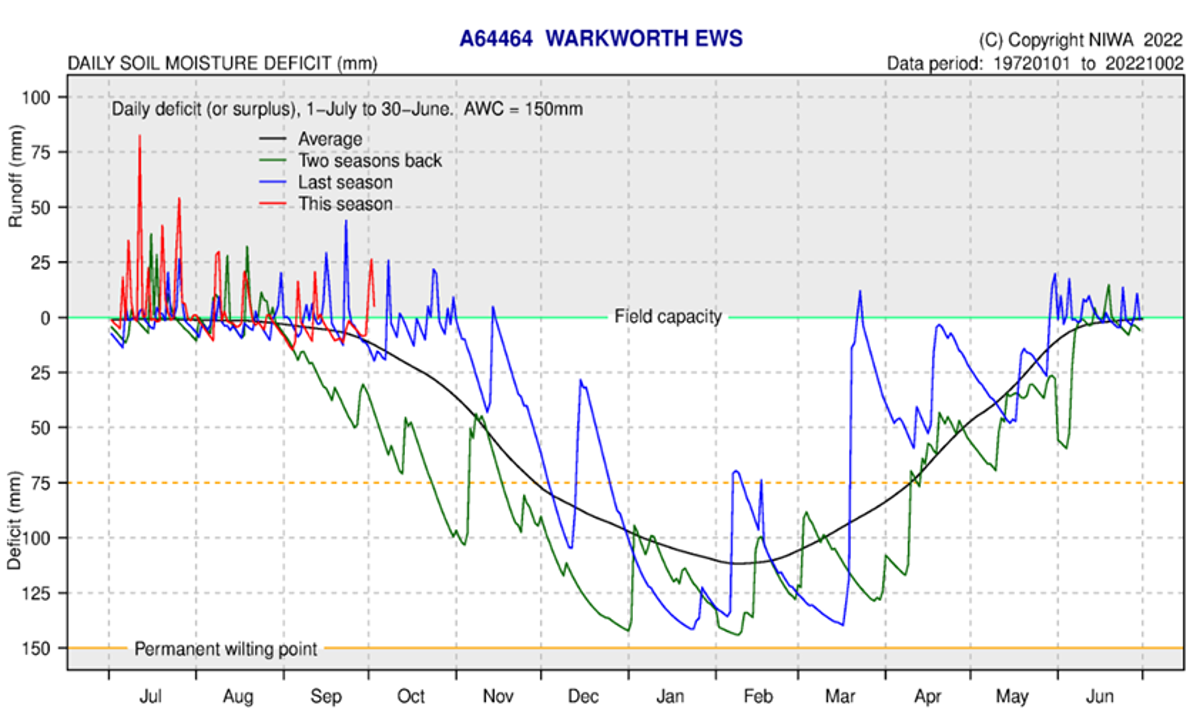
Soil Moisture
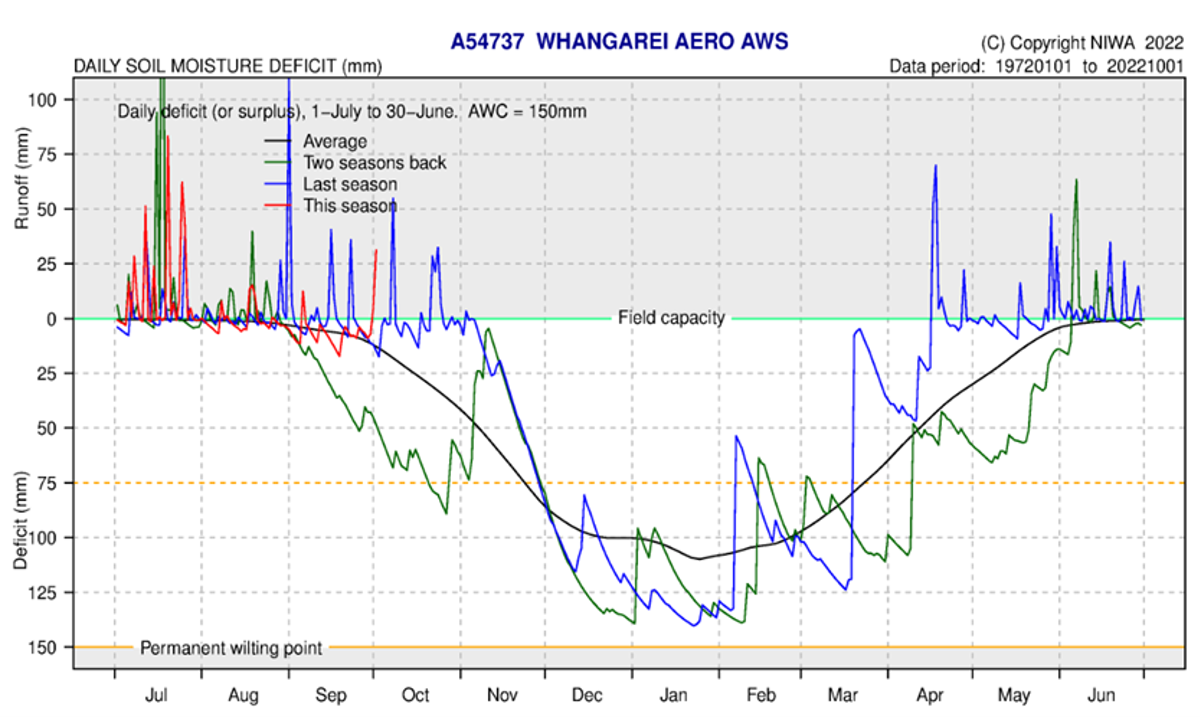
Soil moisture in September at all sites remained at or just below field capacity, with spikes of between 5 – 20 mm of run off when localised rain events occurred, with sites in the west and south of Northland experiencing fewer or no runoff events.
At the beginning of October, all sites except Dargaville recorded a runoff event of around 25 mm, this however was not maintained and quickly dropped back to field capacity. These conditions are likely to continue throughout October as similar climate conditions to the 2021 season are predicted for October – December.
The soil moisture deficit is calculated based on incoming daily rainfall (mm), outgoing daily potential evapotranspiration (mm), and a fixed available water capacity (the amount of water in the soil 'reservoir' that plants can use) of 150 mm” (NIWA).