October 2022 climate report
8 Nov 2022, 2:18 PM
Summary
- La Nina continues to intensify and is the main driver for the up coming summer weather.
- Temperatures are likely to be “above average” for November – January, with rainfall being “near average”.
- Rainfall in October was higher than expected with the region receiving 138% more rainfall than expected.
- Standardized rainfall for 3- and 6-month periods have recorded “near normal to wet” conditions across Northland.
- River flows are “normal” for October on the east coast of Northland, but “low” or “below normal” in the central/ west coast catchments.
- Ground water levels in all aquifers are all either “average” or “above average”.
- Soil moisture levels are beginning to decline, following each site average, with rain events not generally coming above field capacity.
Outlook
November 2022 to January 2023
La Nina continues to be the main influence of the climate for New Zealand for the coming summer months (November 2022 – January 2023). Temperatures are predicted to be “Above Average”, while rainfall, soil moisture and river flow are likely to be “Near Average” or “Above Average”. There is increased risk of cyclone activity in the Southwest Pacific due to cool La Nina conditions in the equatorial area, which may affect New Zealand. Sea surface temperatures for October were “Above Average” These conditions are modelled to continue for November – January leading to favourable conditions for a marine heatwave to develop.
For more details, please refer to NIWA’s seasonal climate outlook for November 2022 - January 2023:
See the seasonal climate outlook on NIWA's website: niwa.co.nz
NIWA Temperature, Rainfall, Soil Moisture and River Flows probabilities for the period of November 2022 to January 2023
(Expressed as % likelihood for either Above Average, Near Average or Below Average conditions).
| Temperature | Rainfall | Soil moisture | River flows | |
| Above average | 70• | 20 | 15 | 15 |
| Near average | 25 | 45• | 40• | 40• |
| Below average | 05 | 35 | 45• | 45• |
Rainfall
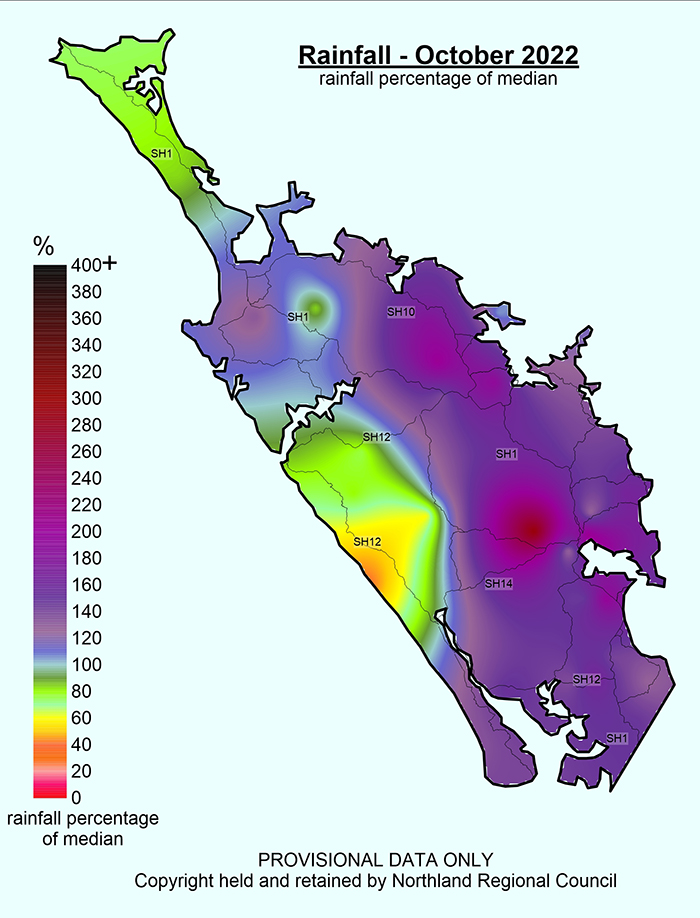
October weather was generally fine, with only two large rain events recorded, one at the start and the other at the end of October. The rain events were concentrated to the east coast, with a number of sites on the eastern and south of Northland experiencing greater than 200% of the expected October rainfall, with a maximum of 297% recorded in Poroti, west of Whangārei. While sites in the far north and west coast were on the dry side with only 39% - 60% of the expected rainfall recorded. Overall the Northland region had 138% of the expected rainfall, with an average of 126 mm.
Rainfall (% of Median) for October 2022 across Northland with a range of 39% to 297%
Standardised Precipitation index (SPI)
The standardised Precipitation Index (SPI) on a three-month continues to show the same patterns seen throughout winter in Northland with rainfall at most sites being “Near Normal or Wetter” than normal. The six-month SPI shows “Moderately Dry” conditions in the west of Northland, while rainfall in the central, east, and northern areas of Northland has been “Near Normal to Wet”. At Cape Reinga and Kai Iwi Lake, due to equipment faults, the areas appear to be extremely dry, which should be disregarded.


River flow
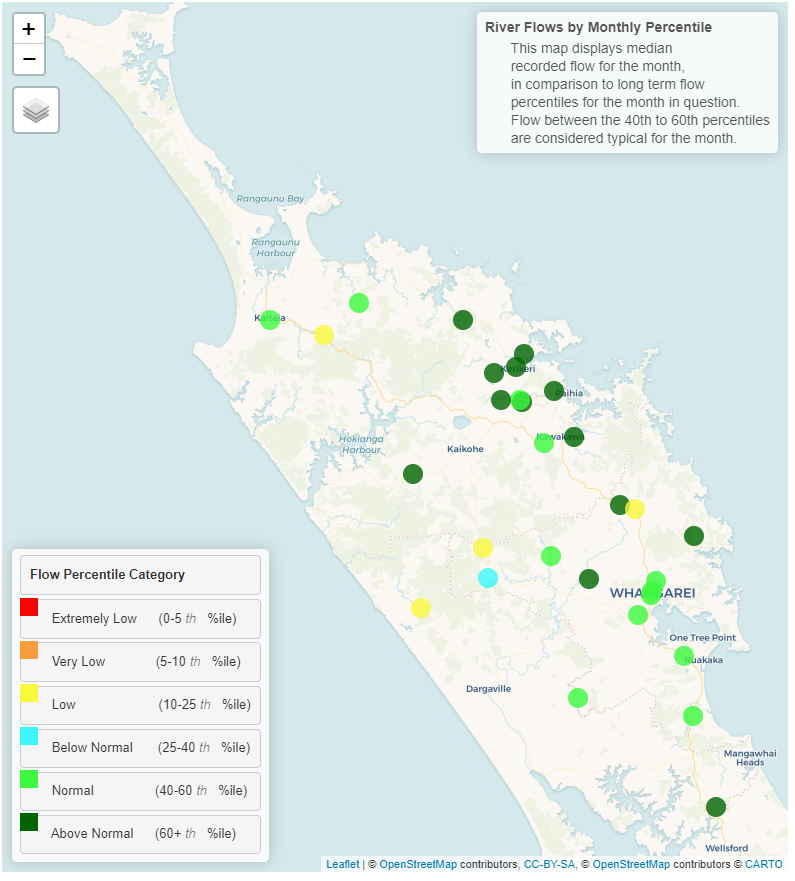
During October, river flows followed a similar pattern to the rain events across Northland. The east coast catchments generally had “above normal” or “normal” flows. While the central and west coast catchments recorded “below normal” or “low” flows for what is expected in October. As soil moisture levels begin to drop, catchments are beginning to show some variation in their reaction to rain events, as well as variation in more localised rain events which is normal for the time of year.
Monthly percentile River Flows for October 2022
Groundwater
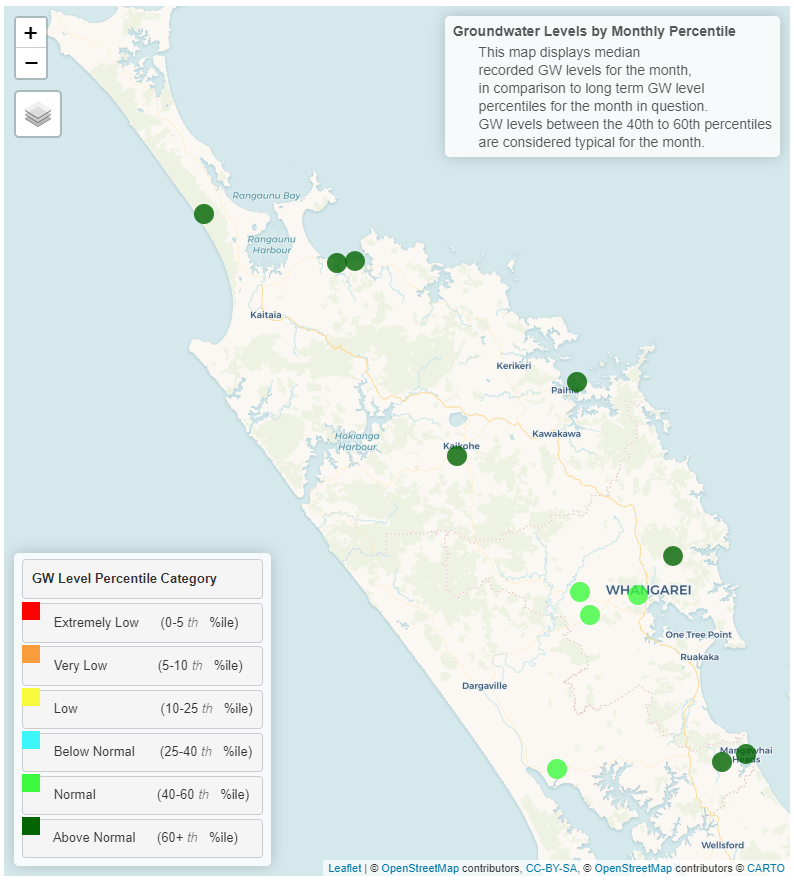
All the key aquifers in Northland are either “Above Normal” or “Normal” water levels for October.
| Aquifer | Status | Percentile |
| Aupōuri | Above normal | 60th+ |
| Taipā | Above normal | 60th+ |
| Russell | Above normal | 60th+ |
| Kaikohe | Normal | 40-60th |
| Poroti | Normal | 60th+ |
| Whangārei | Normal | 60th+ |
| Mangawhai | Above normal | 60th+ |
| Marsden - Ruakākā | Above normal | 60th+ |
| Ruawai | Normal | 40-60th |
Groundwater map for October 2022
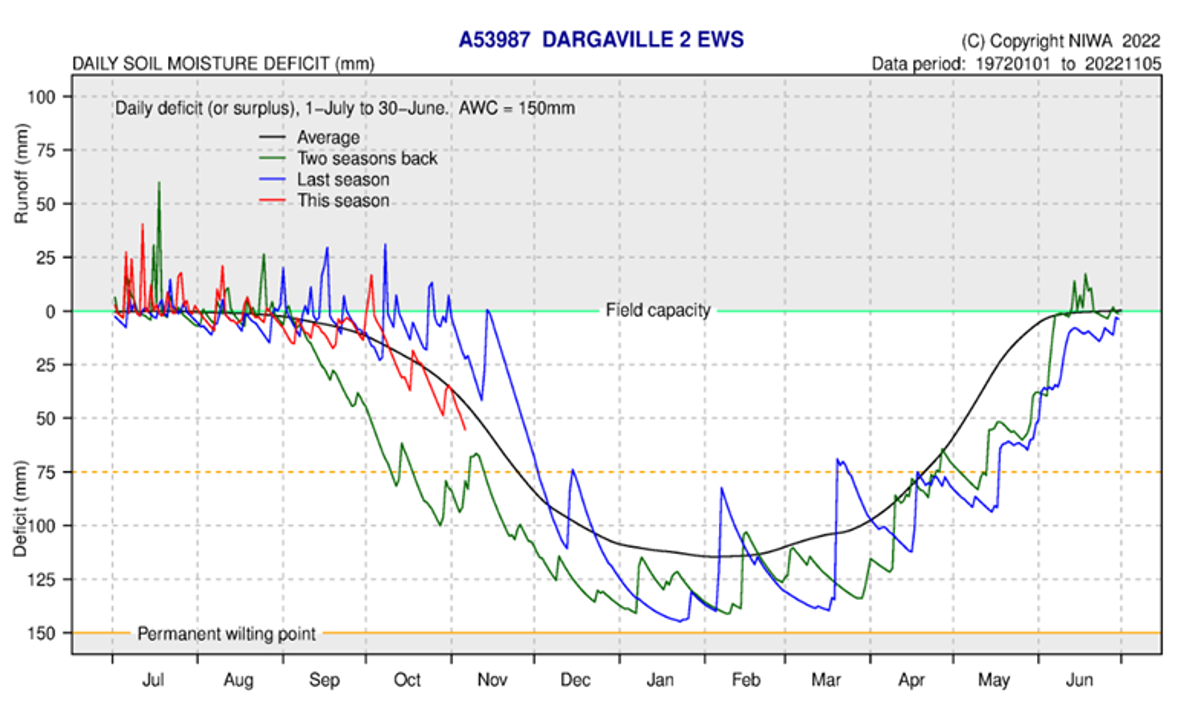
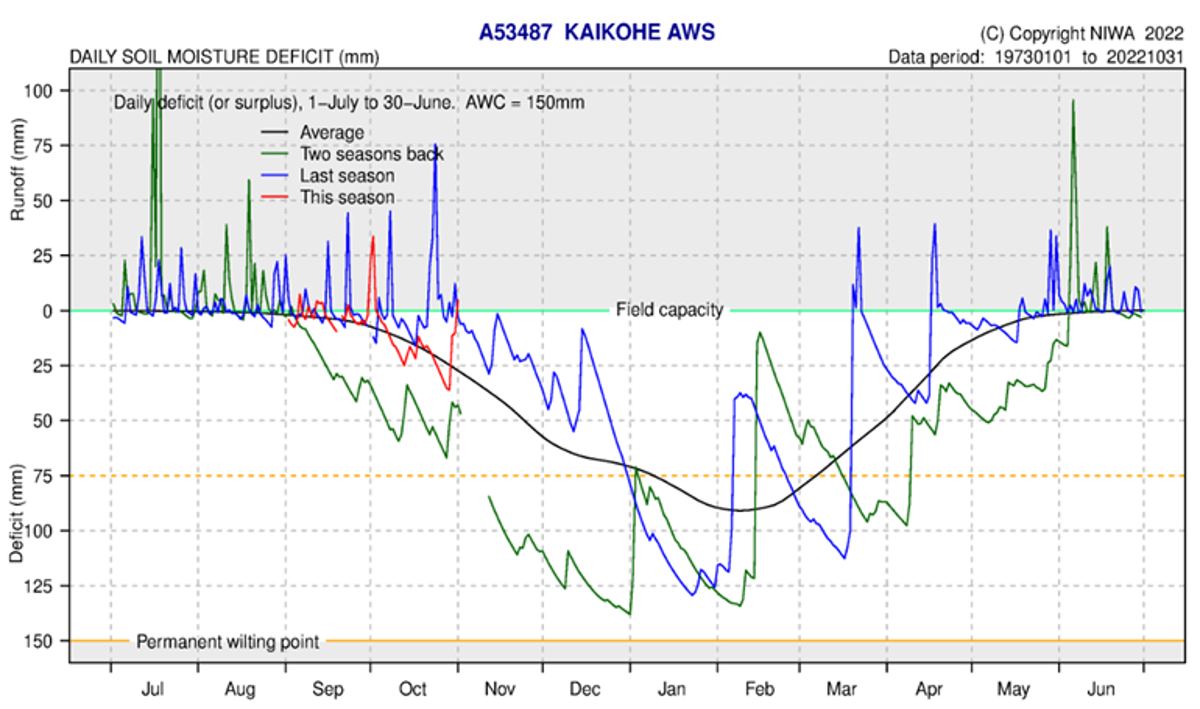
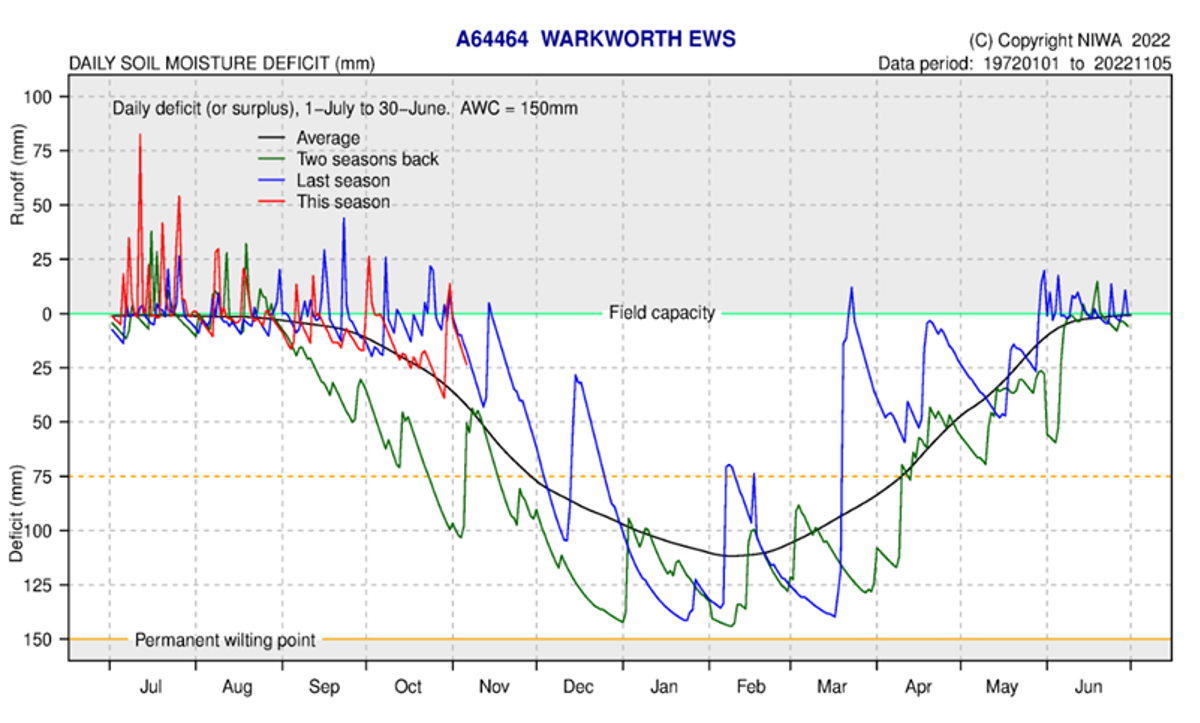
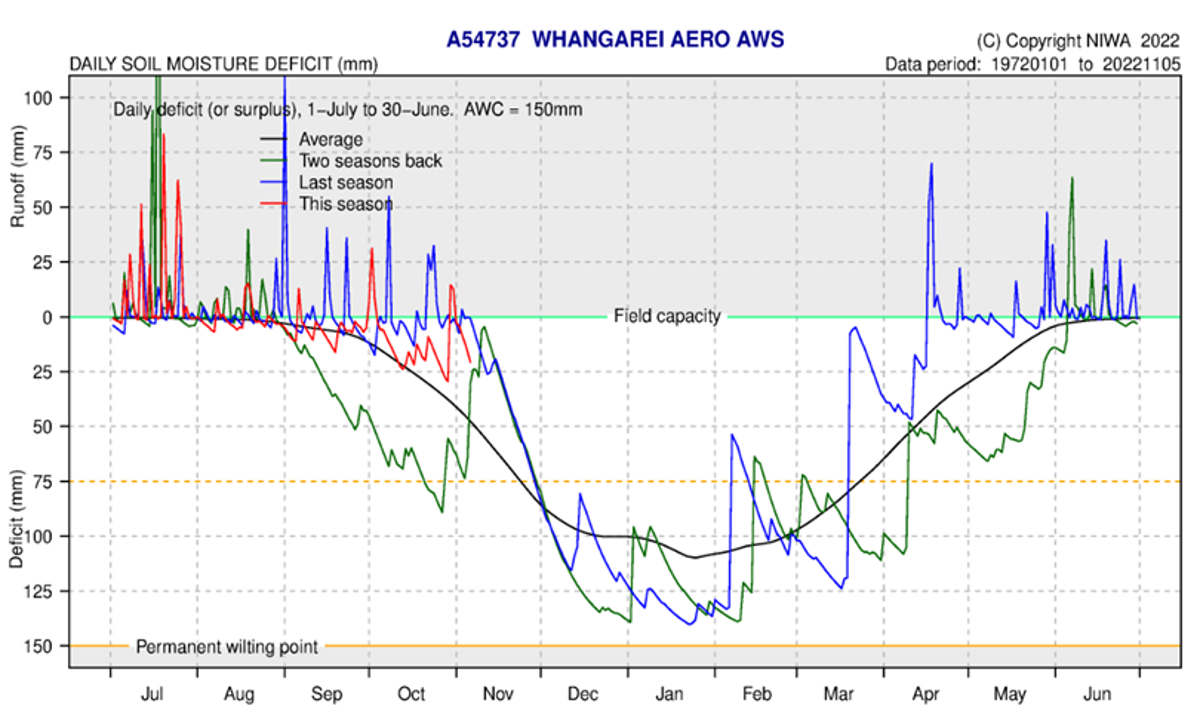
Soil moisture
Soil moisture in October and the first week of November started to drop with most sites falling to a 25 – 50 mm deficit in available plant water. Rain events did show a rise in available water with each event that came through, with some of east coast sites rising past field capacity for a short amount of time at the end of October. Climate conditions are likely to continue to influence the soil moisture as the warmer weather intensifies, with NIWA predicting that soil moisture will be about average compared to previous seasons. The soil moisture deficit is calculated based on incoming daily rainfall (mm), outgoing daily potential evapotranspiration (mm), and a fixed available water capacity (the amount of water in the soil 'reservoir' that plants can use) of 150 mm” (NIWA).