April 2022 climate report
9 May 2022, 2:27 PM
Summary
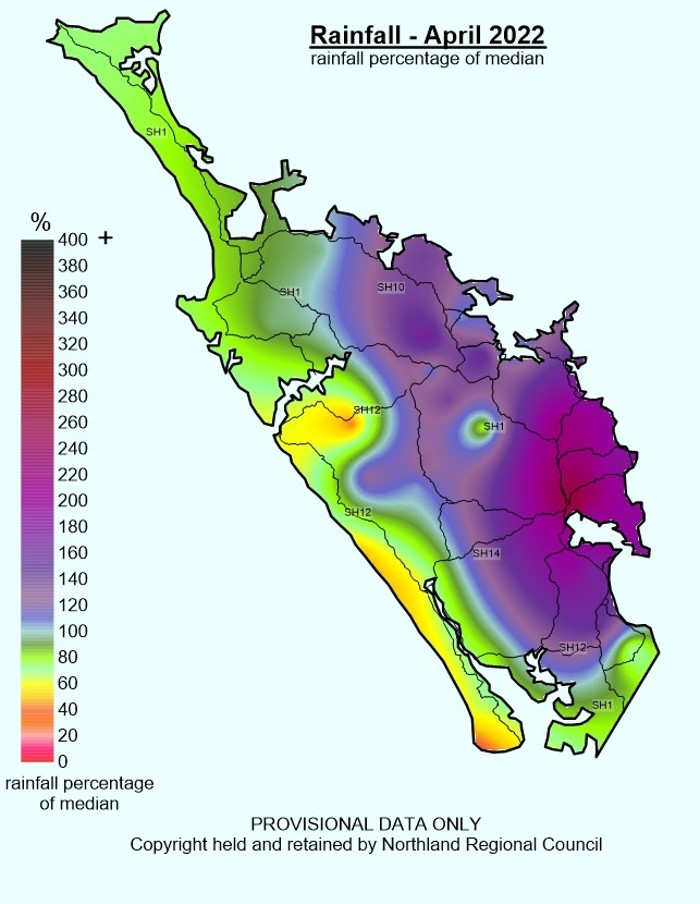
- Rainfall in April 2022 was concentrated in the east, with Glenbervie, east of Whangārei receiving 252% of its expected rainfall. While in the west Hokianga and Pouto received only 62% and 61% of their expected rainfall.
- The standardised precipitation index for both the three- and six-month periods from April resulted in near normal rainfall across Northland.
- Majority of ground water aquifers in Northland were “Normal” or “Above Normal” in April.
- Soil moisture has improved through out April with all sites having water readily available to plants, with central and eastern Northland having soil moisture levels at or close to field capacity, meaning there is a high likelihood that any rain events could cause overland flow and increased river levels.
- La Nina conditions are predicted to continue, with above normal air temperatures and near normal rainfall expected between May and July 2022.
Outlook
May to July 2022:
The NIWA long term forecast indicates that La Nina conditions are continuing. This is causing warmer than normal marine conditions and above average (70% chance) air temperatures in Northland. Rainfall will likely be near normal or above normal, but the region may experience a pattern of long dry spells with periodic heavy rainfall events. Soil moisture and river flows are likely to be near normal to below normal between May and July. For more details, please refer to NIWA’s seasonal climate outlook for May - July 2022:
See the seasonal climate outlook on NIWA's website: niwa.co.nz
NIWA Temperature, Rainfall, Soil Moisture and River Flows probabilities for the period of May 2022 to July 2022
(Expressed as % likelihood for either Above Average, Near Average or Below Average conditions).
| Temperature | Rainfall | Soil moisture | River flows | |
| Above average | 70• | 35• | 20 | 20 |
| Near average | 25 | 40• | 40• | 40• |
| Below average | 05 | 25 | 40• | 40• |
Rainfall
Rainfall in April was higher than average in the east and centre of northland, and below average in the north and west. Most of the rain fell at the end of Easter weekend with the highest rainfall recorded at near Whangārei at Glenbervie (160mm in 24 hours). The highest monthly totals were at Glenbervie (285mm), which was 252% of expected. In the west the lowest rainfalls were recorded at Hokianga at Opononi/Omapere (38.5 mm) and Poutō Point (33.5 mm) which were only 62% and 61% of their expected rainfall respectively.
Rainfall (% of Median) for April 2022 across Northland with a range of 252 % to 61%
The 3-month standardised precipitation index (SPI 3) values for February – April 2022 depicts near normal – wet conditions across northland. While there have been very dry periods, large storms and cyclone activity have averaged out the rainfall seen. The 6-month standardised precipitation index (SPI 6) shows “Near Normal” conditions from October 2021 – April 2022, with only the far north showing “Moderately Dry” conditions.
The values for the rainfall deficit for the previous periods from the end of April are shown in the table below, with all sites showing no deficit on a one-month or three – month scale. For a six to twelve-month scale, sites on the east of Northland recorded greater than expected or near average rainfall, while the more western sites recorded some deficits for the respective periods.
3 and 6 Month SPI (Standardised Precipitation Index) Maps for April 2022


Monthly Median Rainfall deficit values (mm) for April 2022
Negative values represent rainfall deficit, positive values represent rainfall in excess of “typical” rainfall.
| Site | End date | 1 Month | 3 Months | 6 Months | 12 Months |
| Kaitaia Ews | April 2022 | -14.77 | -23.28 | -130.44 | -142.34 |
| Kerikeri Ews | April 2022 | 29.99 | 68.17 | 4.51 | 369.13 |
| Kaikohe Aws | April 2022 | 7.94 | 96.44 | -12.23 | 138.18 |
| Whangārei Aero Aws | April 2022 | 141.69 | 177.74 | 45.08 | 242.88 |
| Dargaville 2 Ews | April 2022 | -28.56 | -28.87 | -134.42 | -179.91 |
| Awaroa at Wallace Road | April 2022 | -26.05 | 0.52 | -32.67 | -158.38 |
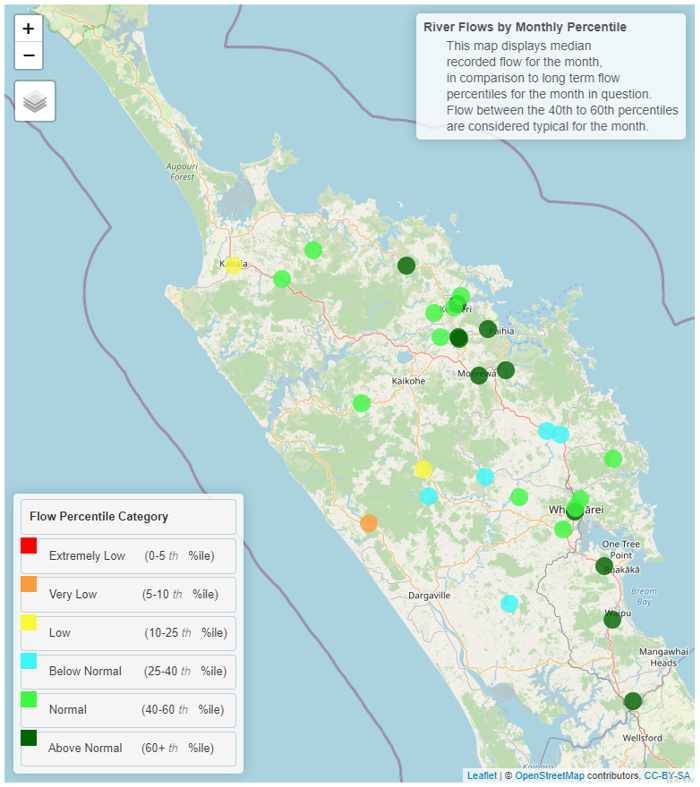
River flow
River flows across Northland in April showed some variation. Stations around Whangārei, the south and the Bay of Islands recorded either “Normal” or “Above normal” flows. Rivers flowing through the Kaipara/ Wairoa catchment out to the west coast recorded lower flow, with most sites “Below Normal” and two sites either “Low” or “Very Low” closer to the coast. In Kaitaia, river flows were also “Low” compared to the long-term record for April. The river flows line up well with observed rainfall patters for April.
Monthly percentile River Flows for April 2022
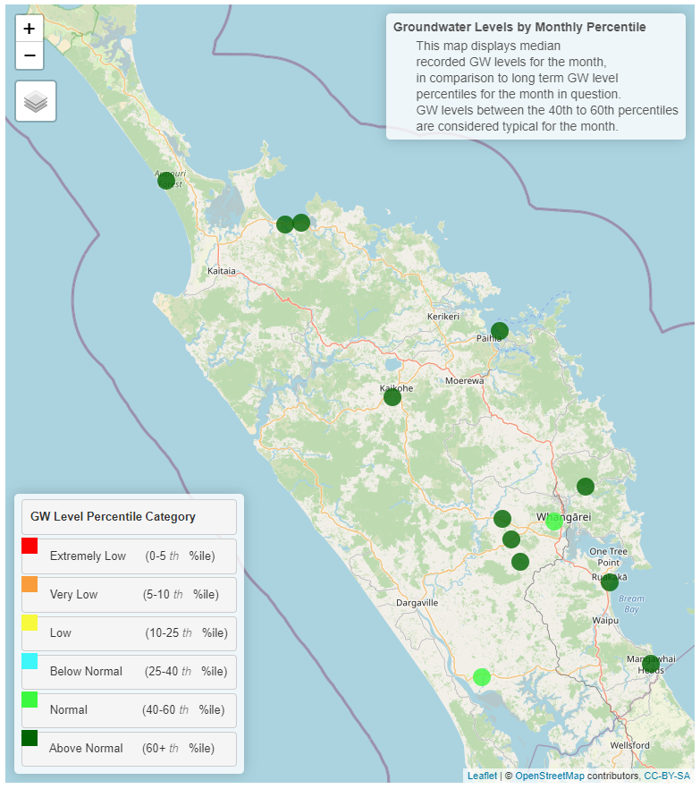
Groundwater
Groundwater levels in April continued to increase from their summer levels with Majority of sites at “Above Normal” levels. Only Whangārei and Ruawai aquifers recorded “Normal” levels for April. This is likely related to the number of heavy rain events seen in March and April across Northland recharging groundwater systems across the region.
| Aquifer | Status | Percentile |
| Aupōuri | Above normal | 60th+ |
| Taipā | Above normal | 60th+ |
| Russell | Above normal | 60th+ |
| Kaikohe | Above normal | 60th+ |
| Poroti | Above normal | 60th+ |
| Whangārei | Normal | 40-60th |
| Mangawhai | Above normal | 60th+ |
| Marsden - Ruakākā | Above normal | 60th+ |
| Ruawai | Normal | 40-60th |
Groundwater map for April 2022
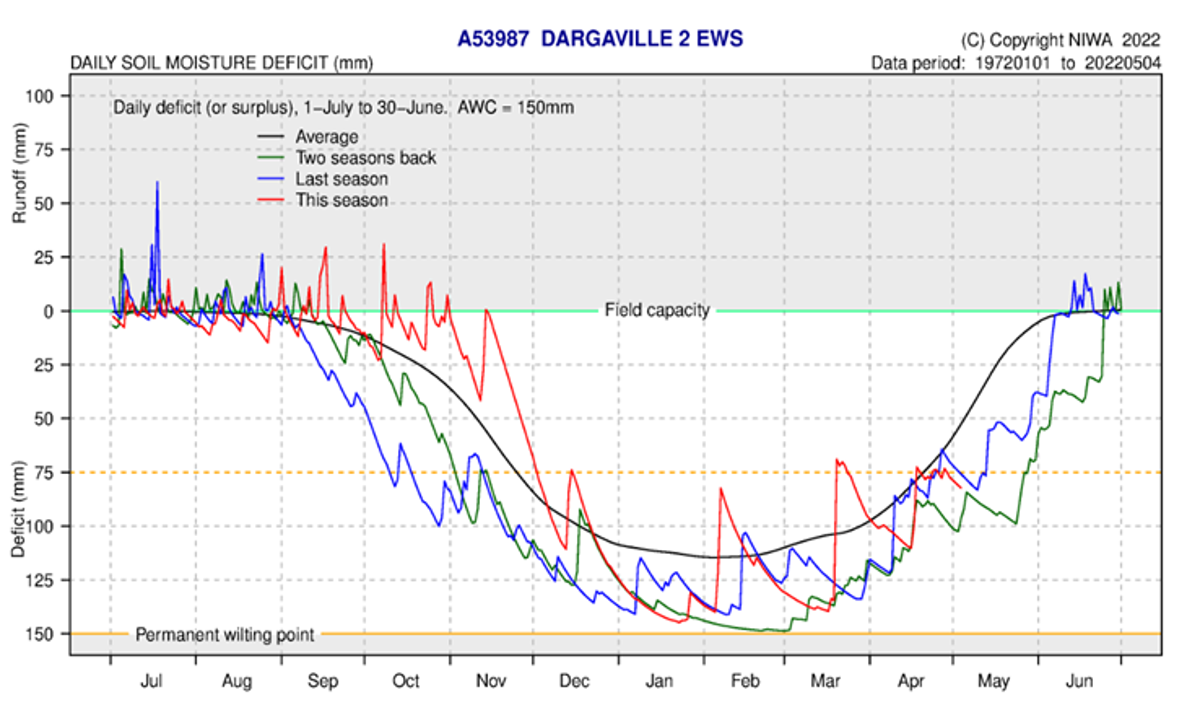
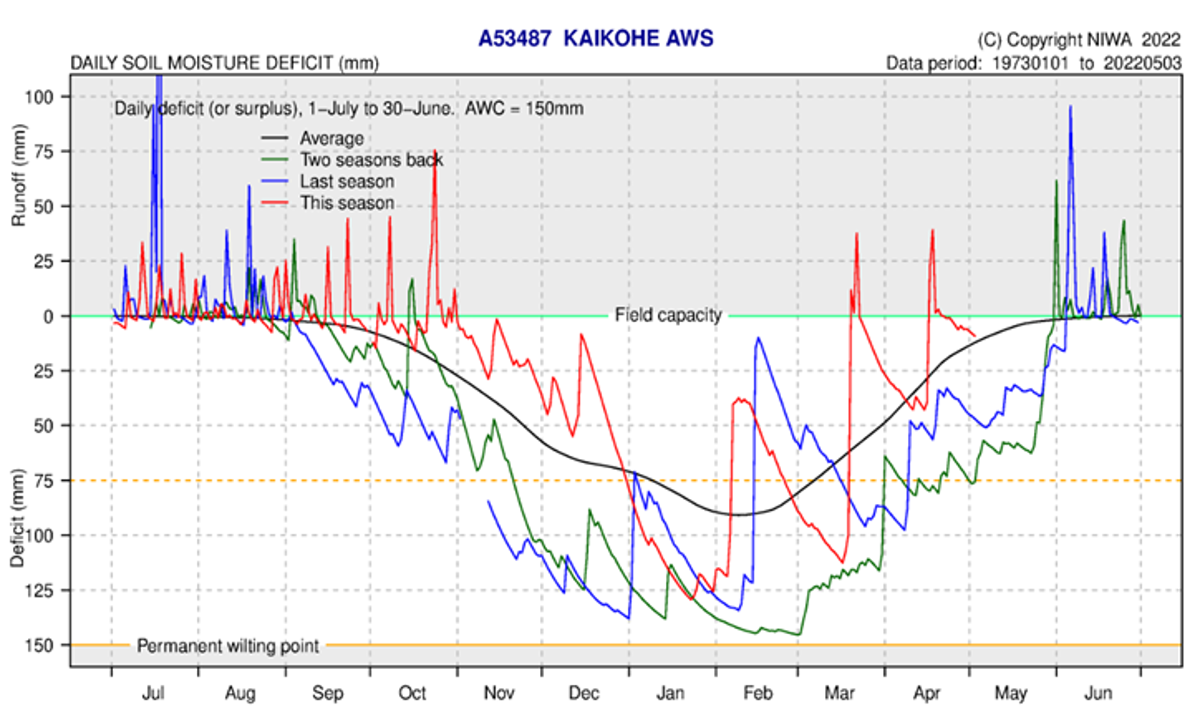
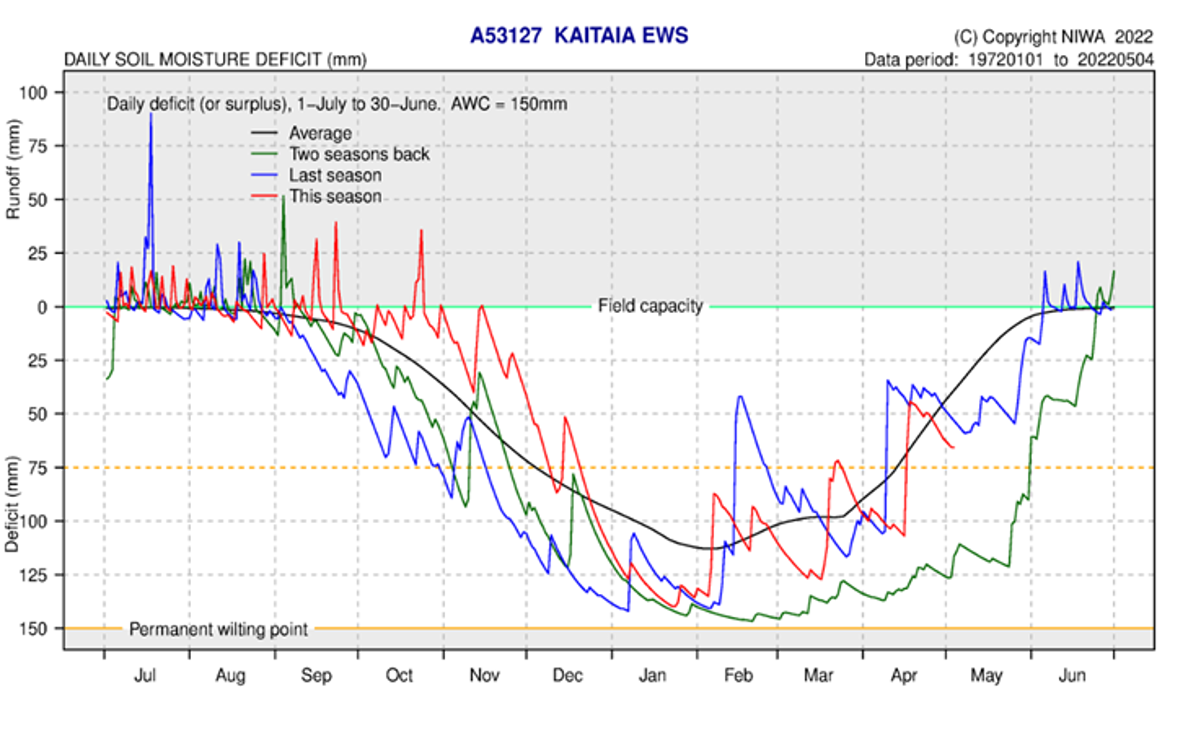
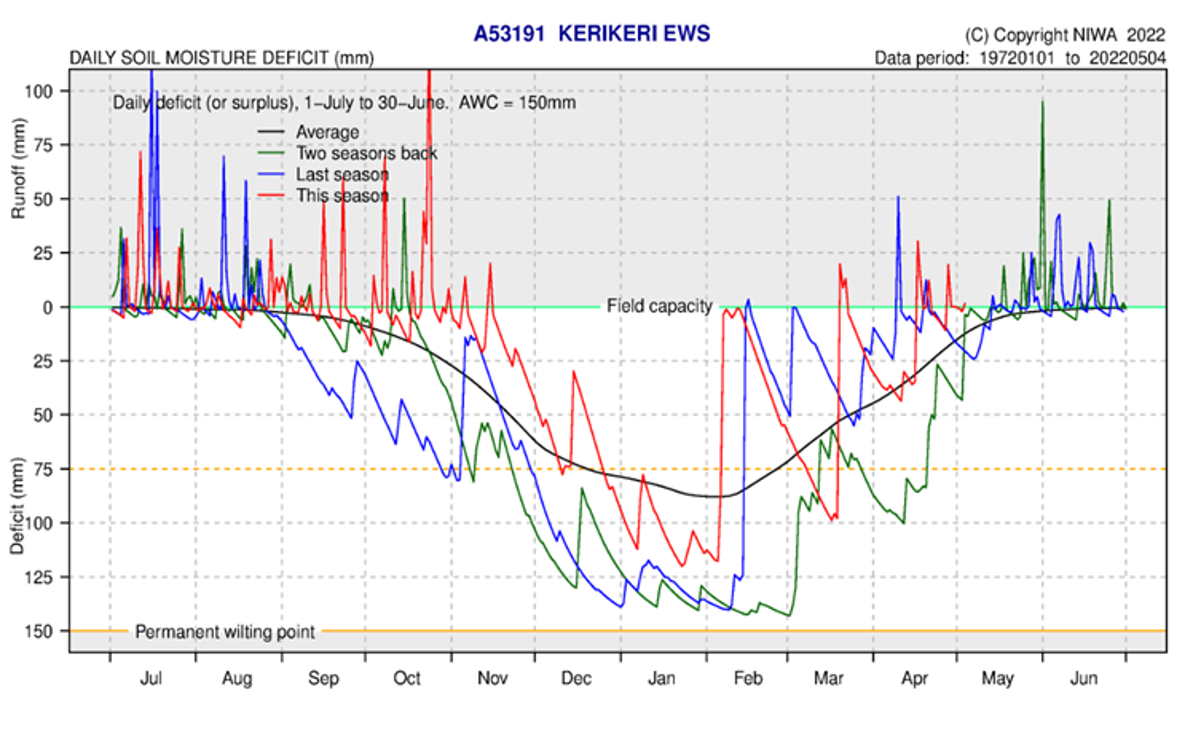
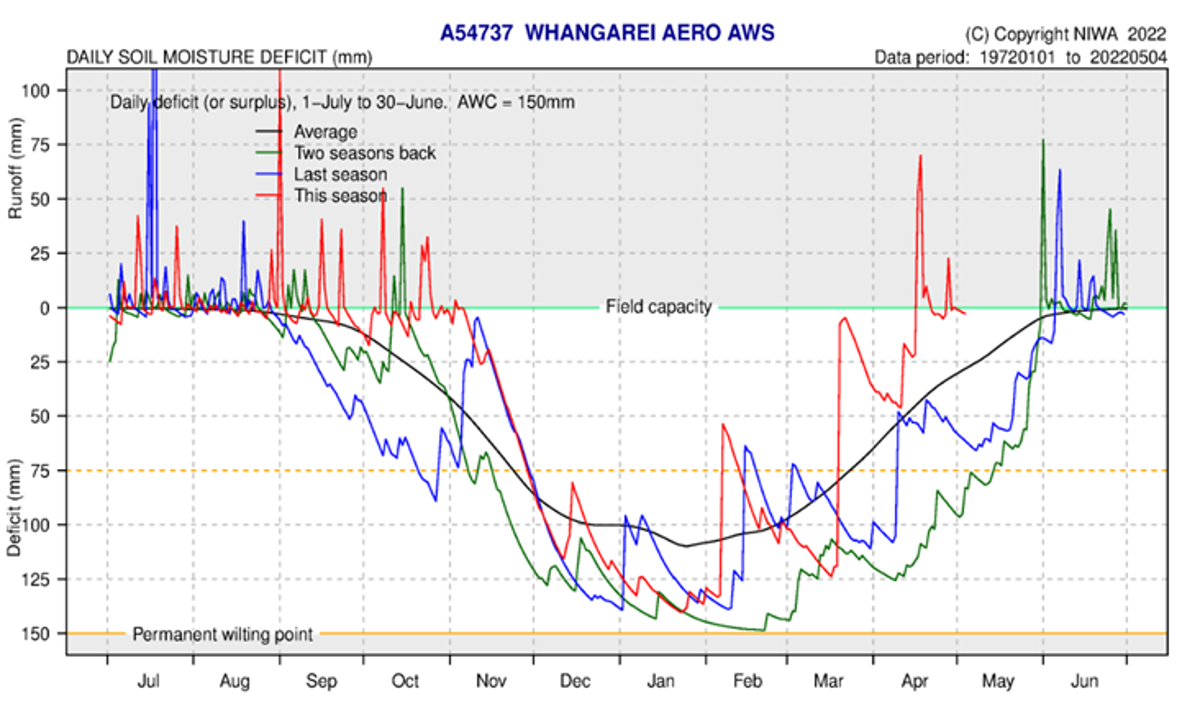
Soil moisture deficits
Soil moisture levels in April showed a similar pattern at most sites to March, where the was a large rise during the Easter weekend rain events, with sites on the east coast and to the south showing overland flow. All sites recorded soil moisture levels rising past 75 mm, where water is readily available to plants, with Dargaville and Kaitaia finishing April with soil capacity available. Sites along the East coast and central Northland are at field capacity or just below, following smaller rain events through to the end of April which were concentrated in the east.
Any rain events in the East are likely to have some over land flow and faster increases in river flow are to be expected. However, in the North and along the West Coast any minor rain events are unlikely to cause any significant changes to river flows. The soil moisture deficit is calculated based on incoming daily rainfall (mm), outgoing daily potential evapotranspiration (mm), and a fixed available water capacity (the amount of water in the soil 'reservoir' that plants can use) of 150 mm” (NIWA).
Soil moisture plots modelled at representative sites across Northland for the period ending in April 2022