May 2022 climate report
22 Jun 2022, 8:24 AM
Summary
- La Niña conditions are continuing to drive the climate in Northland along with warmer than average sea temperatures.
- NIWA forecasts temperatures to be warmer than average through winter, and any cold snaps are likely to be less frequent than usual.
- Rainfall, river flows and soil moisture are likely to be above normal for June.
- Rainfall in May was less than expected at most sites in Northland, with the region only receiving around 75% of its expected rainfall.
- Standardised precipitation (SPI) on the 3- and 6-month time scales were generally “Near Normal”.
- River flows were approximately “Normal” in the east but were “Low” to “Extremely Low” in the west.
- Majority of groundwater aquifers are at “Above Normal” levels.
- Soil moisture either remained at or increased steadily to reach field capacity by the beginning of June at all sites except Dargaville. Dargaville remains approximately 30 mm below field capacity.
Outlook
June to August 2022
The NIWA long term forecast indicates the winter temperatures are likely to be warmer than average (60 %) due to warmer than average sea surface temperatures and the continuation of La Niña. Cold snaps are likely to be less frequent and of shorter duration than expected. Rainfall, soil moisture and river flows are expected to be “Above Normal” (50 – 55 %) with sub-tropical moisture plumes causing heavy rainfall and potential flooding in Northland. For more details, please refer to NIWA’s seasonal climate outlook for June-August 2022:
See the seasonal climate outlook on NIWA's website: niwa.co.nz
NIWA Temperature, Rainfall, Soil Moisture and River Flows probabilities for the period of June 2022 to August 2022
(Expressed as % likelihood for either Above Average, Near Average or Below Average conditions).
| Temperature | Rainfall | Soil moisture | River flows | |
| Above average | 60• | 50• | 55• | 50• |
| Near average | 35 | 30 | 35 | 40 |
| Below average | 05 | 20 | 10 | 10 |
Rainfall
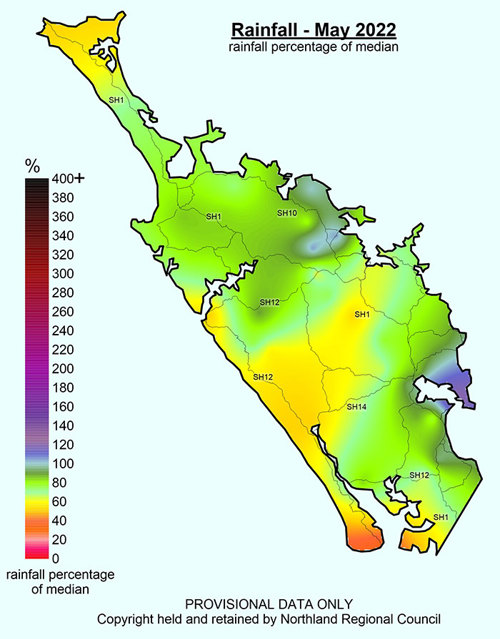
Rainfall in May 2022 was generally drier than usual, with only two large rain events during the month, resulting in intense thunderstorms along the east coast, bringing the average rainfall in Northland to 75% of what was expected. Only Marsden Point exceeded the expected rainfall (122%), and only five sites reached 100%.
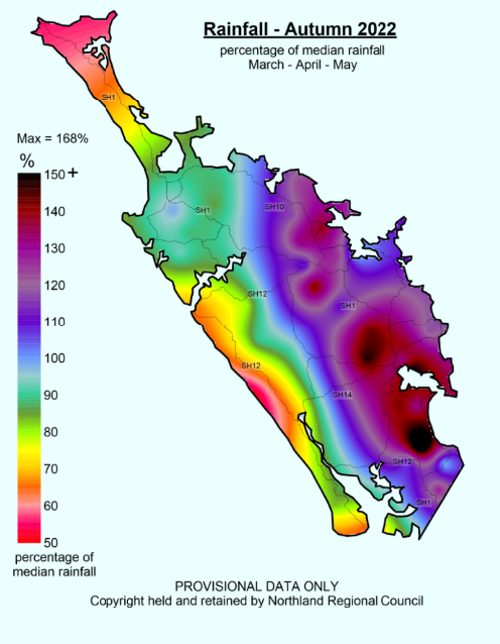
Many sites recorded below 50% of their expected rainfall, the lowest being recorded at Pouto Point with only 35% of what was expected. For autumn (March – May) there was a distinct difference in rainfall between the east and west of Northland. The east coast exceeded the expected rainfall for the season while the west coast and the far north was drier than expected. This was largely driven by the intense storms in March.
Overall Northland had 109% of its expected rainfall for autumn, with the maximum percentage recorded at the Brynderwyn rain gauge (168%) and the Minimum at Kai Iwi Lakes (47%).
Rainfall (% of Median) for May 2022 across Northland with a range of 122% to 35%
Rainfall (% of Median) for Autumn 2022 (March – May) across Northland with a range of 168% to 47%
The 3-month standardised precipitation index (SPI 3) values for March – May 2022 depicts near normal – wet conditions across Northland. However, the east coast was on the wetter side while the west tended to be drier. As discussed above, autumn in Northland was driven by several thunderstorms, which averaged rainfall in the region to be “Near Normal”. The 6-month standardised precipitation index (SPI 6) shows “Near Normal” conditions from November 2021 – May 2022 for most of the region. The west coast showed “Moderately Dry” conditions; however, this is biased by one station showing “Extremely Dry” conditions due to a fault with the monitoring equipment on site.
The values for the rainfall deficit for the previous periods from the end of May are shown in the table below, with sites in the east showing no deficit on a one-month or three – month scale, while some sites in the north and west showed minor deficits. For a six to twelve-month scale, sites on the east of Northland recorded greater than expected or near average rainfall, while the more western sites recorded some deficits for the respective periods.
No data was available north of Kaitaia due to a fault at the Cape Regina station with no data recorded for the end of May. However, the rainfall maps for autumn give us a good picture that the Far North area not modelled was likely to be dry in a similar fashion to the rest of the west coast further to the south.
3 and 6 Month SPI (Standardised Precipitation Index) Map for May 2022 (note lack of data at Cape Regina did not allow the Far North to be fully modelled)

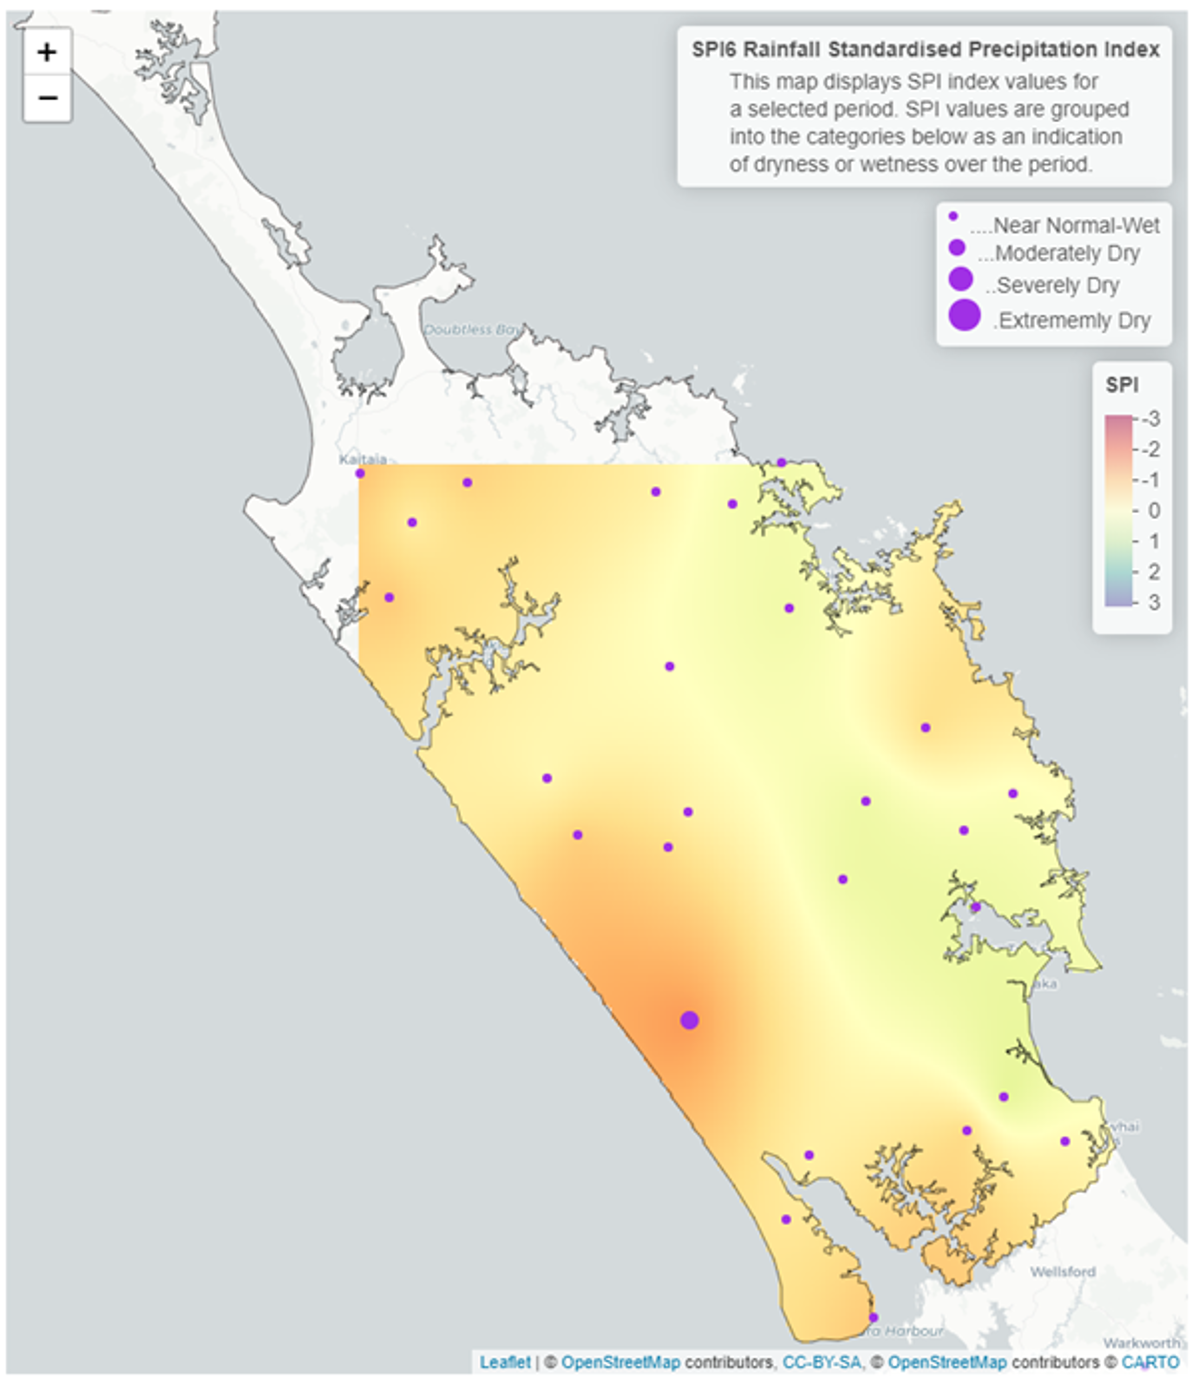
Negative values represent rainfall deficit, positive values represent rainfall in excess of “typical” rainfall.
| Site | End date | 1 Month | 3 Months | 6 Months | 12 Months |
| Kaitaia Ews | May 2022 | -32.28 | -55.66 | -154.97 | -119.26 |
| Kerikeri Ews | May 2022 | 34.11 | 60.56 | 27.59 | 456.27 |
| Kaikohe Aws | May 2022 | -35.61 | 50.79 | -24.29 | 187.10 |
| Whangārei Aero Aws | May 2022 | -9.49 | 152.11 | 71.50 | 299.59 |
| Dargaville 2 Ews | May 2022 | -58.17 | -75.68 | -174.72 | -186.23 |
| Awaroa at Wallace Road | May 2022 | -9.62 | -25.51 | -60.85 | -115.69 |
River flow
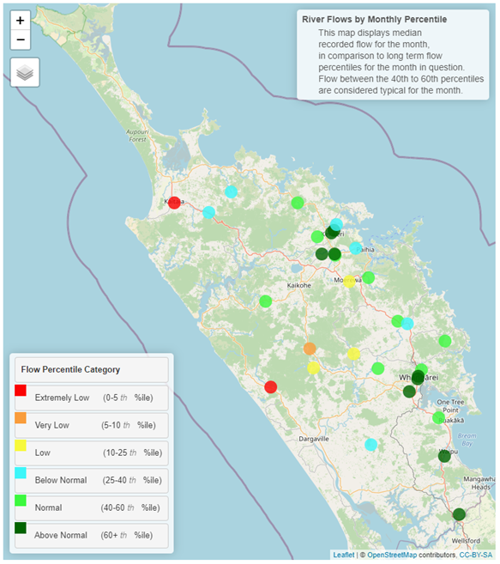
River flows varied widely across Northland in May, with sites around Kerikeri and Whangārei either recording “Normal” or “Above Normal” flows. While sites through the centre and on the west coast ranged between “Low” to “Extremely Low flows”, with drier conditions observed further to the west. The flows for May reflect the rainfall patterns observed for the month, with “Above Normal” flows recorded in areas where thunderstorm activity was concentrated.
Monthly percentile River Flows for May 2022
Groundwater
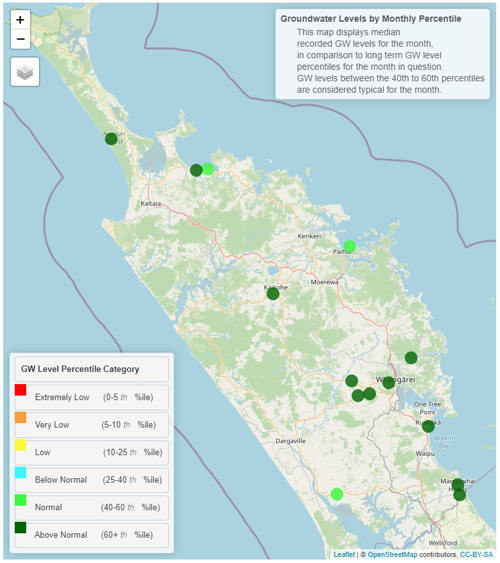
Groundwater levels in May remained stable and were similar to April, with majority of sites at “Above Normal” water levels. Russell was the only aquifer that had a decrease in ground water level to “Normal”.
| Aquifer | Status | Percentile |
| Aupōuri | Above normal | 60th+ |
| Taipā | Above normal | 60th+ |
| Russell | Normal | 40-60th |
| Kaikohe | Above normal | 60th+ |
| Poroti | Above normal | 60th+ |
| Whangārei | Normal | 40-60th |
| Mangawhai | Above normal | 60th+ |
| Marsden - Ruakākā | Above normal | 60th+ |
| Ruawai | Normal | 40-60th |
Groundwater map for May 2022
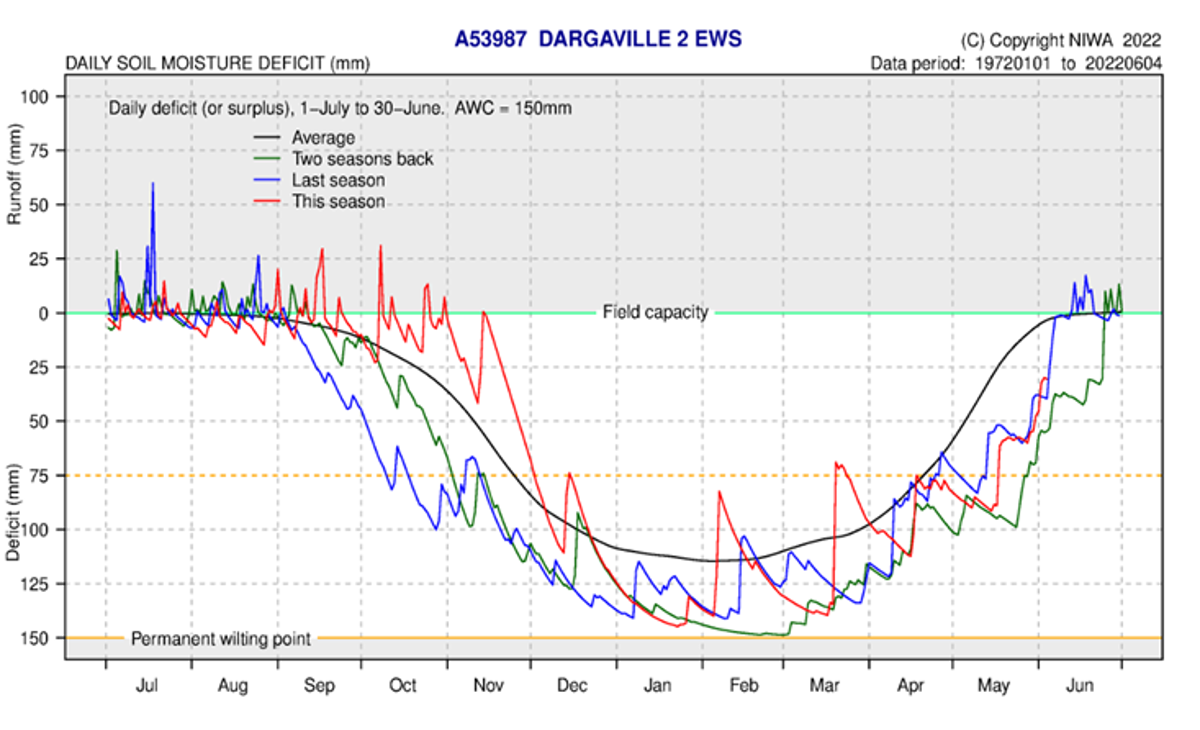
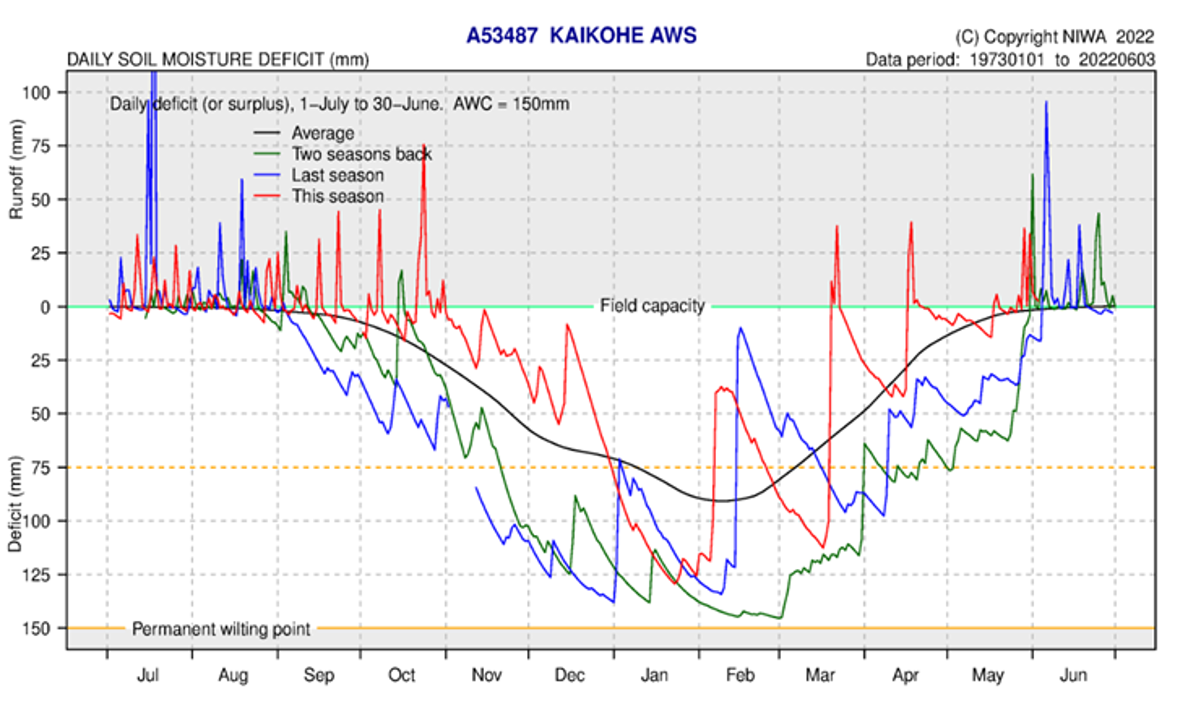
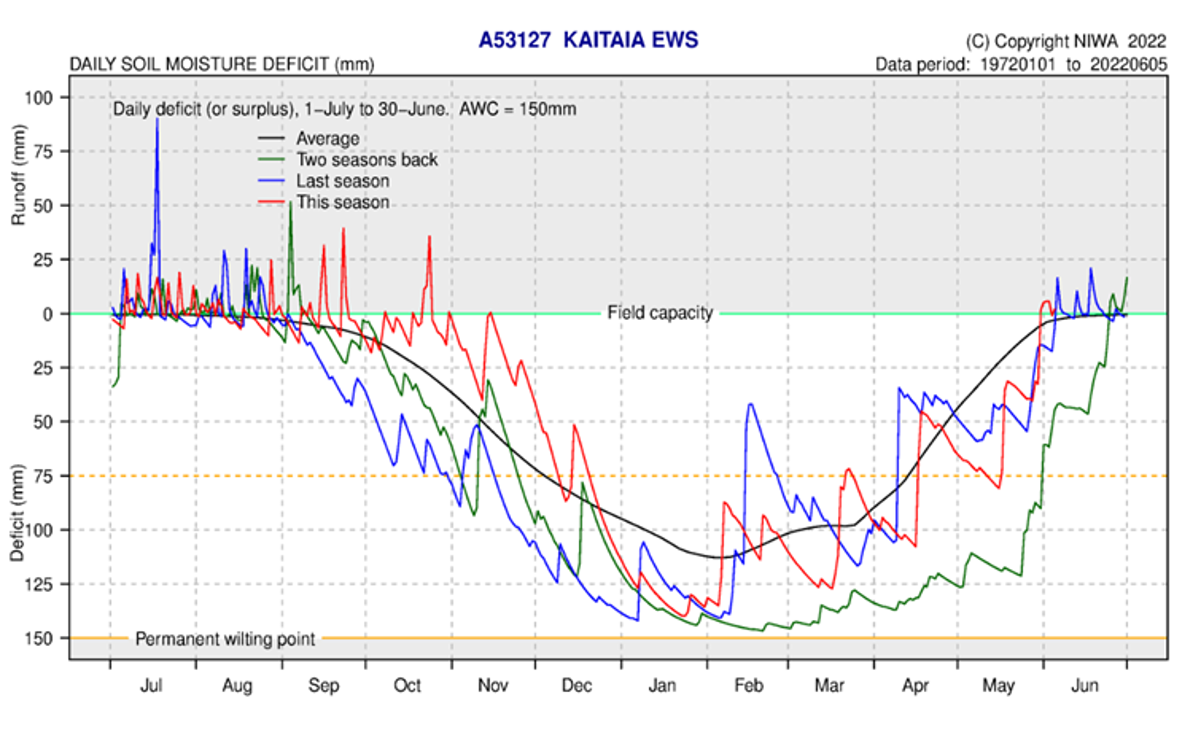
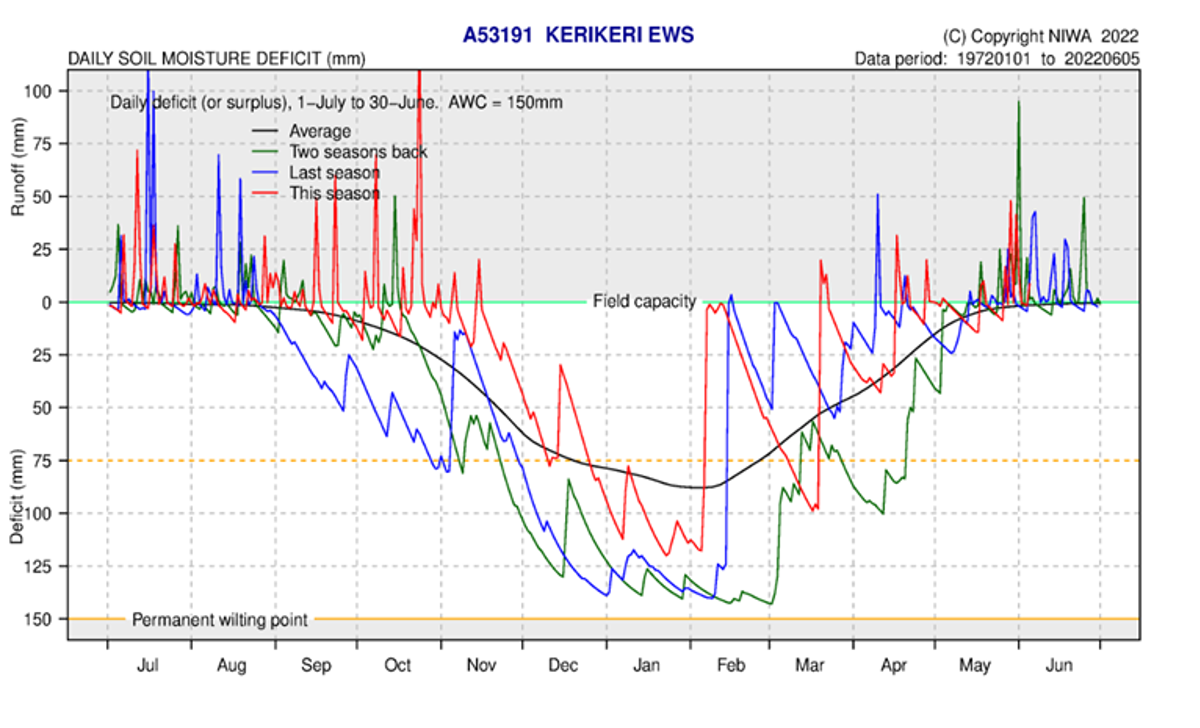
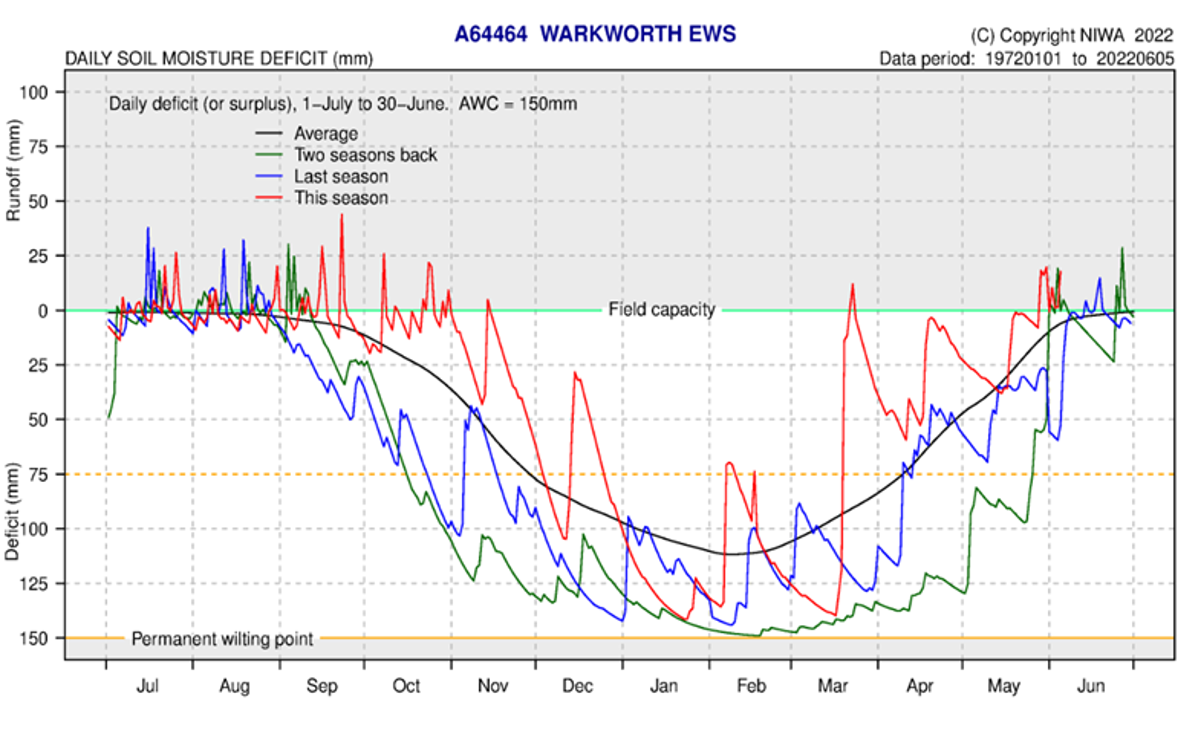
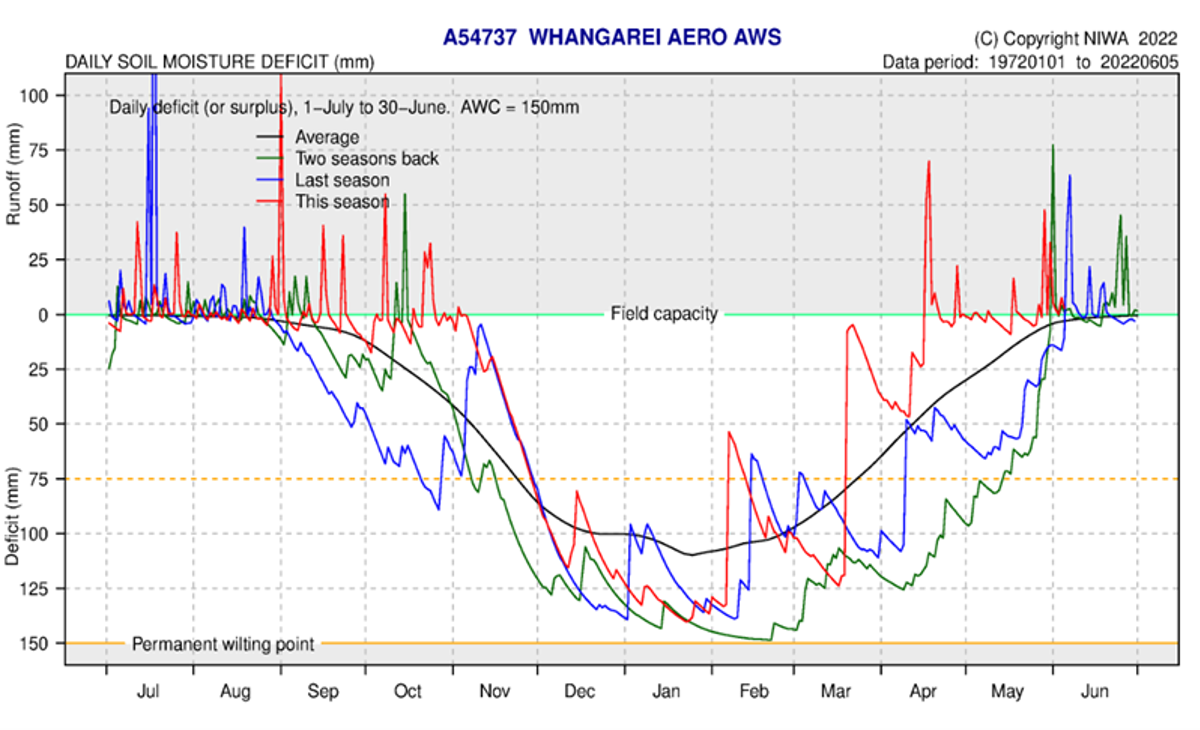
Soil moisture deficits
Soil moisture in May floated around field capacity at most sites and reacted quickly to rain events with over land flow and likely fast increases in river flows along with sustained higher base flows. Kaitaia and Warkworth which started the month below field capacity rose quickly and steadily through the month finishing at the beginning of June at field capacity. Only one site remained below field capacity for May.
Although showing a steady rise throughout May, Dargaville finished the month with a 30mm deficit. This correlates well to the below average rainfall recorded on the west coast throughout autumn and particularly May. Apart from Kerikeri most other stations recorded above average soil moisture, even topping the autumn season last year (2021). The Kerikeri station was about equal to the previous season.
The stations on the west coast have similar patterns to last year, and remained below average for all of autumn, however only Dargaville is still below the sites average at the start of June. The soil moisture deficit is calculated based on incoming daily rainfall (mm), outgoing daily potential evapotranspiration (mm), and a fixed available water capacity (the amount of water in the soil 'reservoir' that plants can use) of 150 mm” (NIWA).
Soil moisture plots modelled at representative sites across Northland for the period ending at the beginning of June 2022