June 2022 climate report
19 Jul 2022, 9:12 AM
Summary
- The driving forces of the weather in Northland currently are the continuation of La Nina, and the strengthening of the Indian Ocean Dipole.
- Temperatures are predicted to be “above normal” for July – September, while rainfall and river flows are likely to be “normal”.
- Rainfall in June were 95% of what was expected, even though most days in the month had some rainfall.
- River flows and ground water continue to generally be “normal” or “above normal” for June.
- Soil Moisture levels across northland are all at or above field capacity, any rain events are likely to cause overland flow and increase river levels quickly.
Outlook
July to September 2022
The NIWA long term forecast continues to indicate that La Nina conditions are likely to continue, and along with the Indian Ocean Dipole developing into negative conditions, will drive tropical moisture systems down to New Zealand increasing the risk of flooding in Northland. These drivers are likely to cause, warmer than average temperatures, due to warmer than average sea surface temperatures as well as majority of winds coming from the north and east. Rainfall, soil moisture and river flows are all likely to be near average or above average for this time of year.
For more details, please refer to NIWA’s seasonal climate outlook for July-September 2022:
See the seasonal climate outlook on NIWA's website: niwa.co.nz
NIWA Temperature, Rainfall, Soil Moisture and River Flows probabilities for the period of July to September 2022
(Expressed as % likelihood for either Above Average, Near Average or Below Average conditions).
| Temperature | Rainfall | Soil moisture | River flows | |
| Above average | 60• | 40• | 35 | 35 |
| Near average | 35 | 40• | 45• | 45• |
| Below average | 05 | 20 | 20 | 20 |
Rainfall
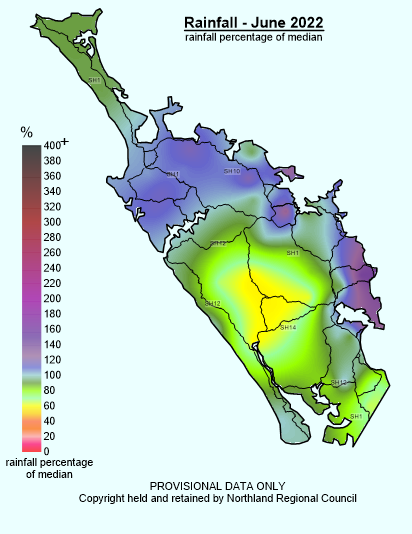
Through June, most days had some rainfall across most of Northland. These events however were generally small showers and less than 10 mm, with the largest event recording 70 mm in the Ngunguru catchment on the 24th of June.
Overall, the region averaged 150 mm, which while the month felt particularly damp was only 95% of what was expected for the region in June. The east coast experienced the most rain, with the maximum rainfall recorded at Ngunguru at Dugmores rock (251 mm) which was 142% of expected.
The lowest rainfall was recorded at Waipao at Draffin Road to the west of Whangārei, and at Dargaville both which recorded 86.5 mm. However, the centre of northland experienced the driest expected conditions with Mangakahia at Twin Bridges registering only 59% of the expected June rainfall.
Rainfall (% of Median) for June 2022 across Northland with a range of 142% to 59%
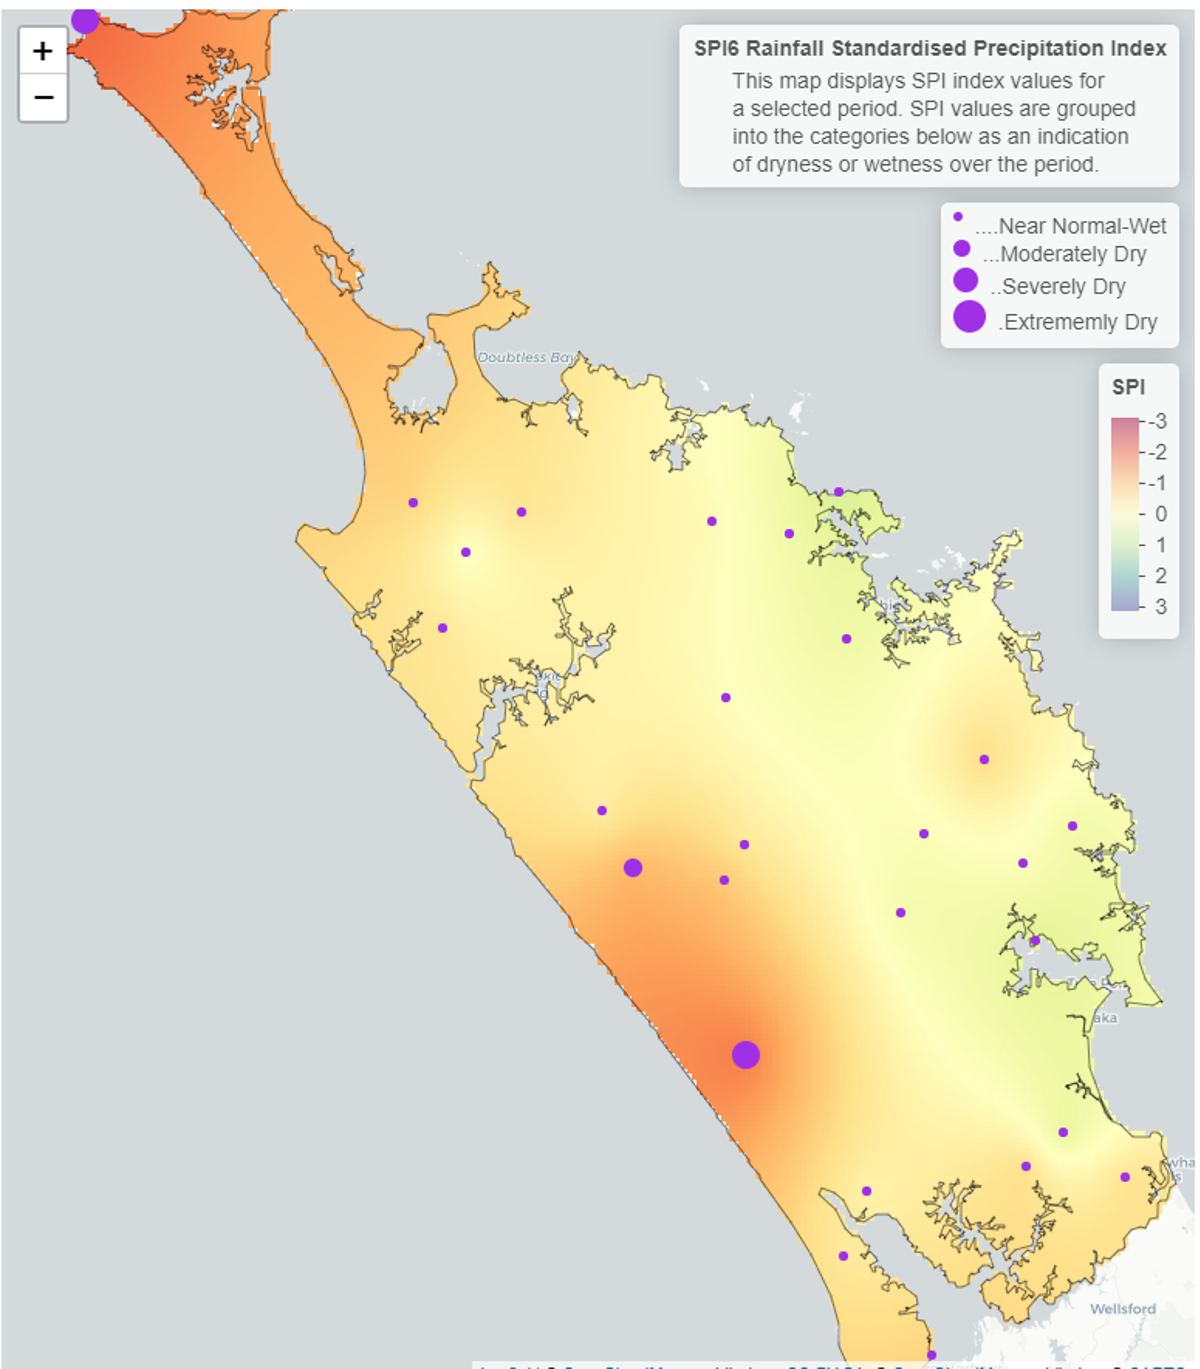
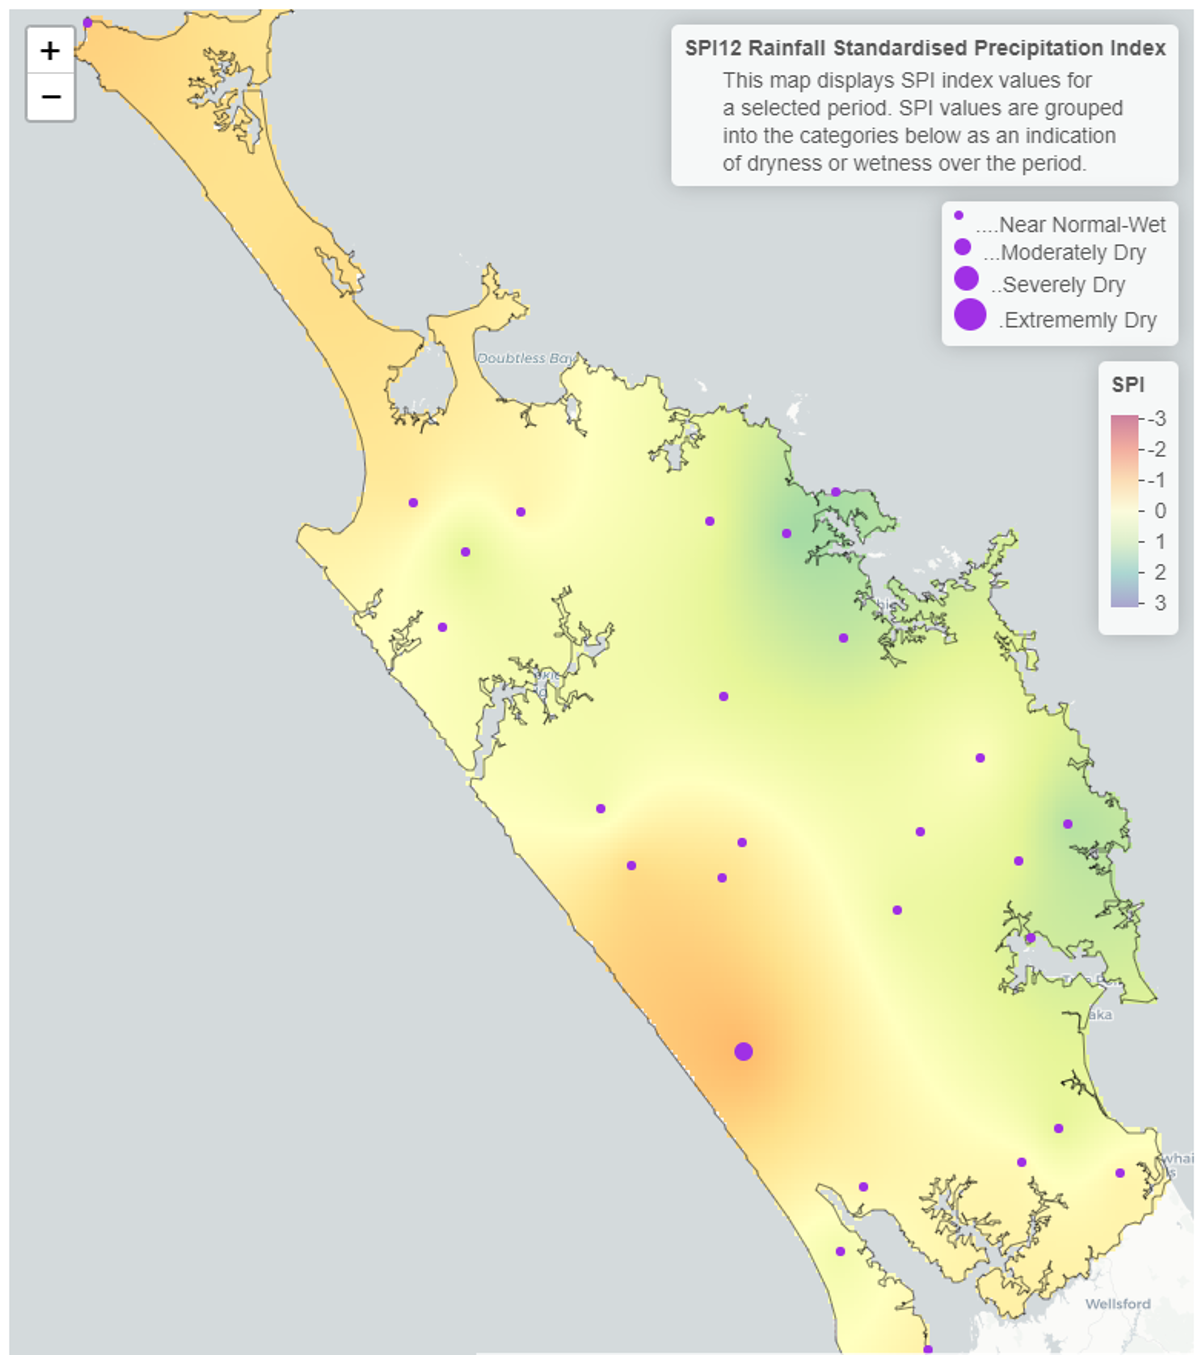
The 6-month standardised precipitation index (SPI 6) shows “near normal” conditions from December 2021 – June 2022 for most of the region. The west coast showed “moderately dry” conditions; however, this is biased by one station showing “extremely dry” conditions due to a fault with the monitoring equipment on site during May.
The 12-month (SPI 12) map shows that most of Northland was “near normal” for the 2021 – 2022 season. The far north and the west coast were drier, however the west coast shows more dry conditions than the rest of the region this is due to equipment faults rather than a true picture of what happened.
6 and 12 Month SPI (Standardised Precipitation Index) Maps for June 2022


River flow
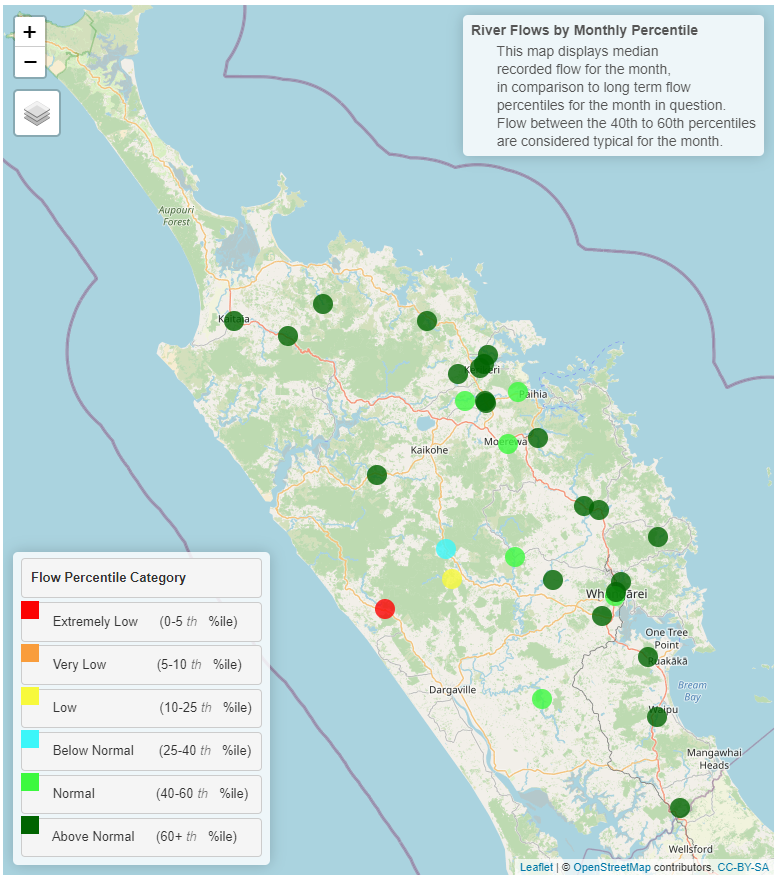
In June, river flows in the north and along the east coast were either “above normal” or “normal” for the first month of winter. While river flows in the centre and west coast of Northland ranged between “below normal” to “extremely low”. The flows likely remained high due to heavy rain events in May, followed by small top up events throughout June, and a lack of continuous sunshine hours, reducing the ability for soil evaporation, allowing base flows to remain high.
Groundwater
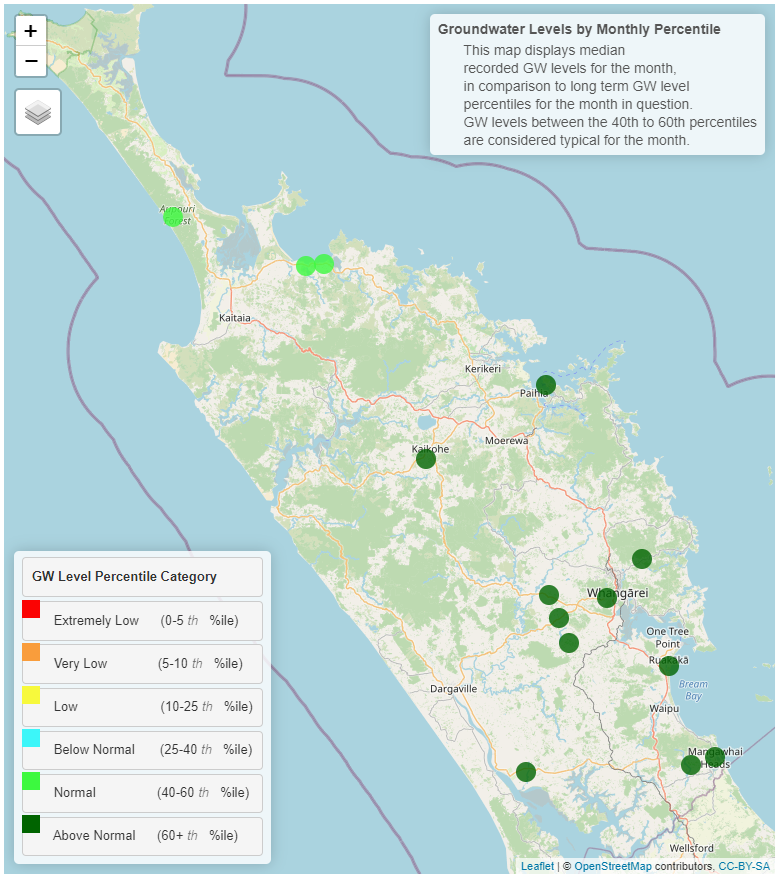
Groundwater levels in June changed slightly compared to previous months with a decrease to “normal” water levels recorded in the north, at the Aupōuri and Taipa aquifers. All other aquifers are currently at “above normal” levels.
| Aquifer | Status | Percentile |
| Aupōuri | Normal | 40-60th |
| Taipā | Normal | 40-60th |
| Russell | Above normal | 60th+ |
| Kaikohe | Above normal | 60th+ |
| Poroti | Above normal | 60th+ |
| Whangārei | Above normal | 60th+ |
| Mangawhai | Above normal | 60th+ |
| Marsden - Ruakākā | Above normal | 60th+ |
| Ruawai | Above normal | 60th+ |
Groundwater map for June 2022
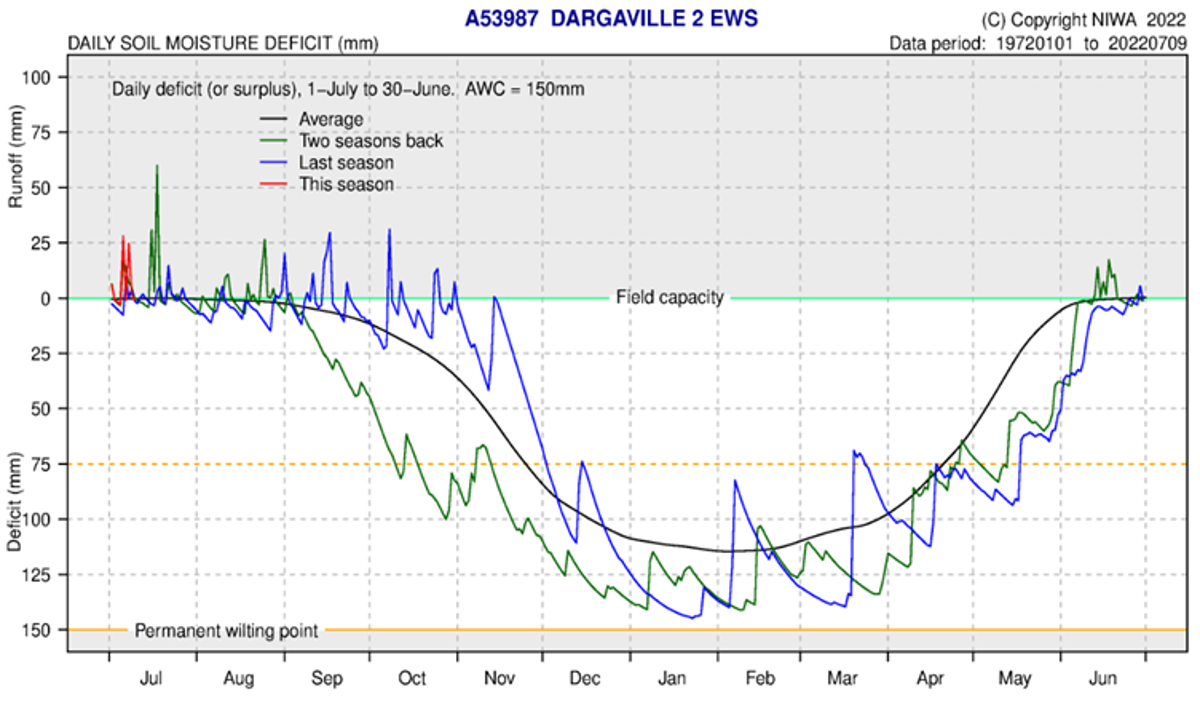
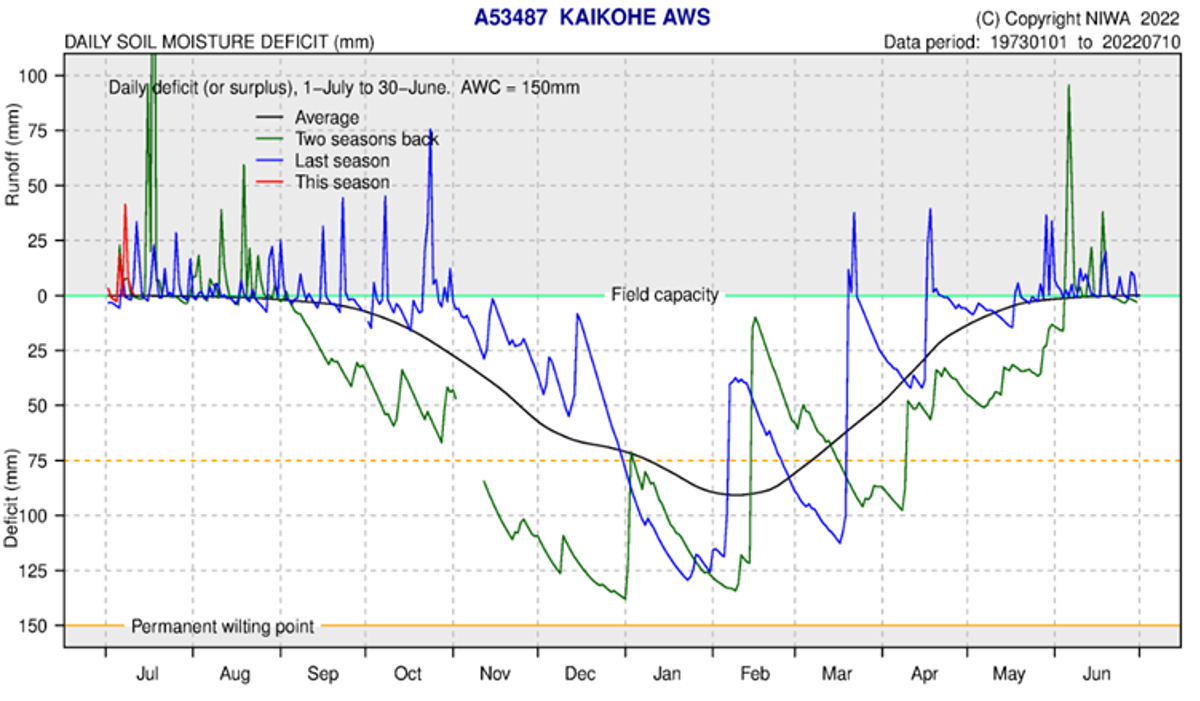
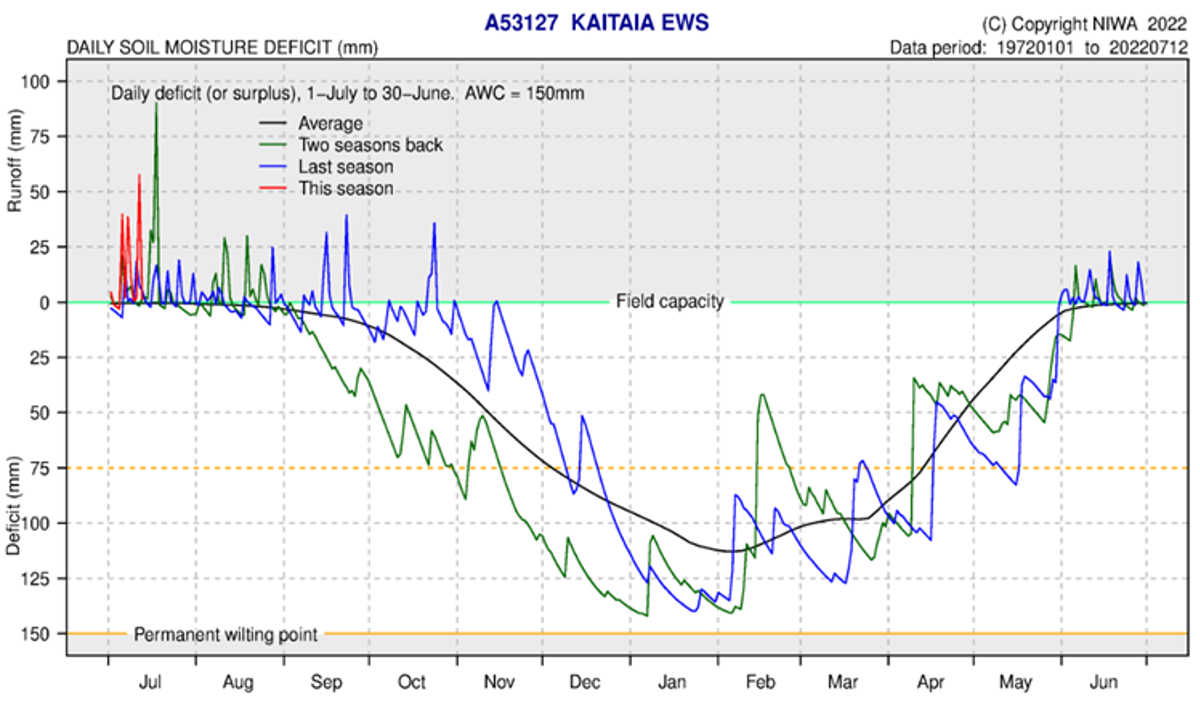
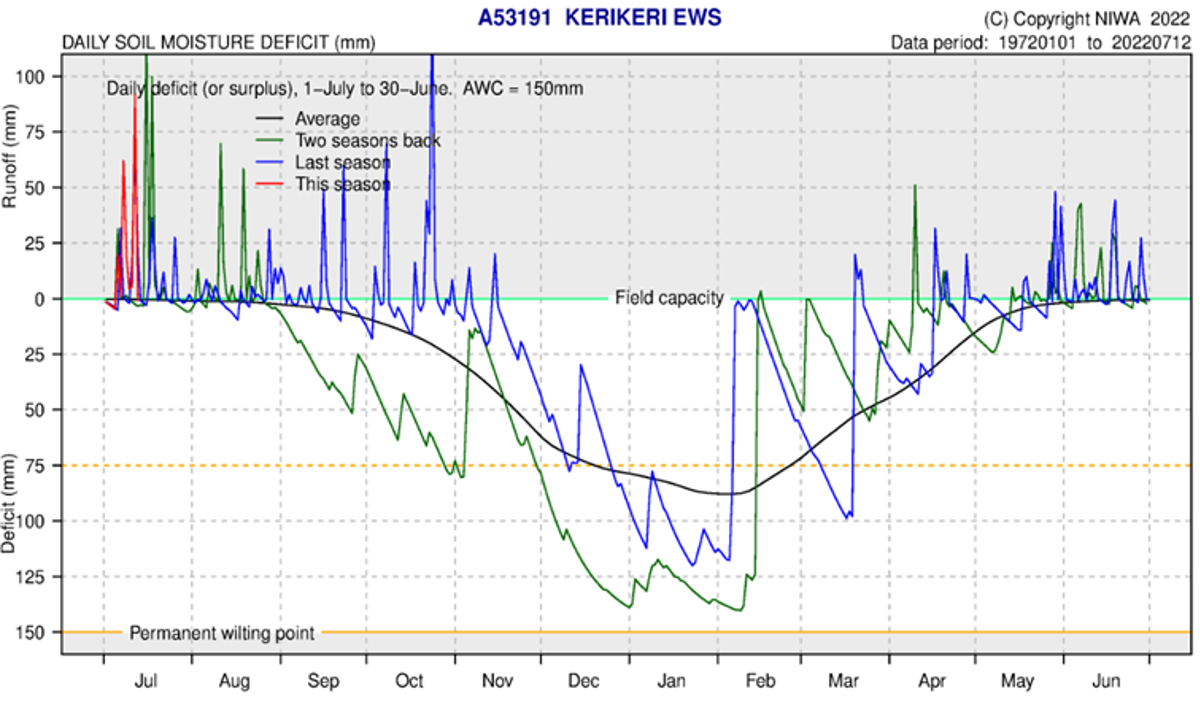
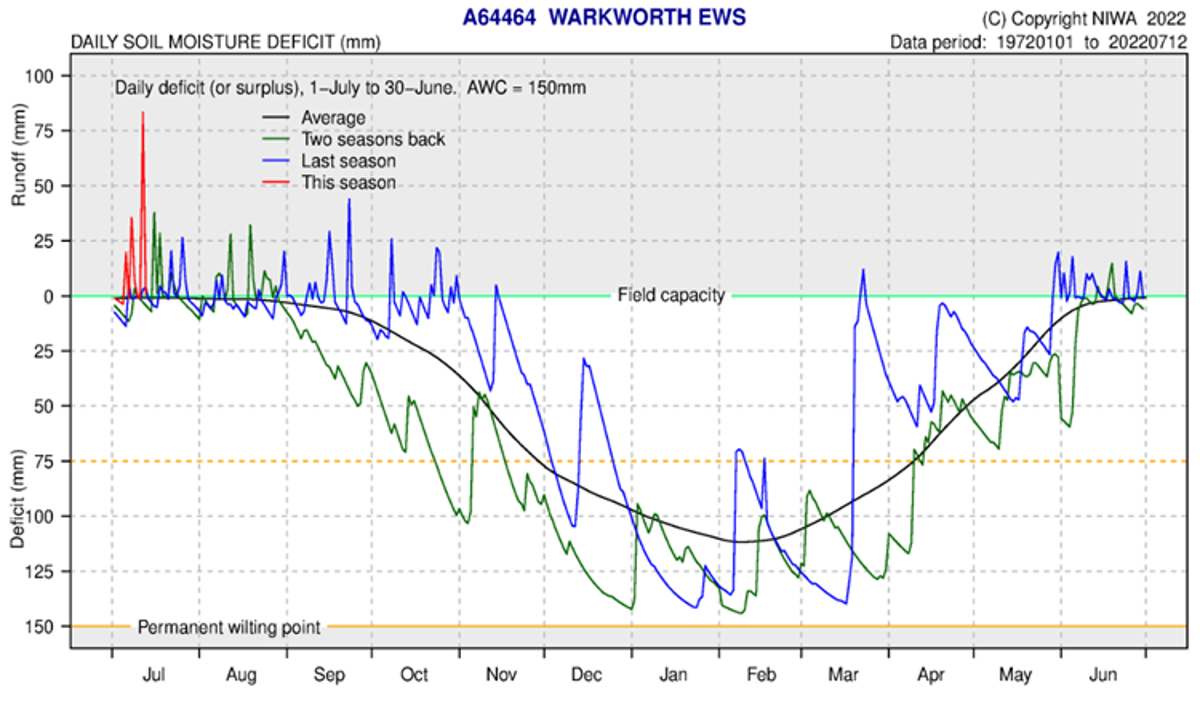
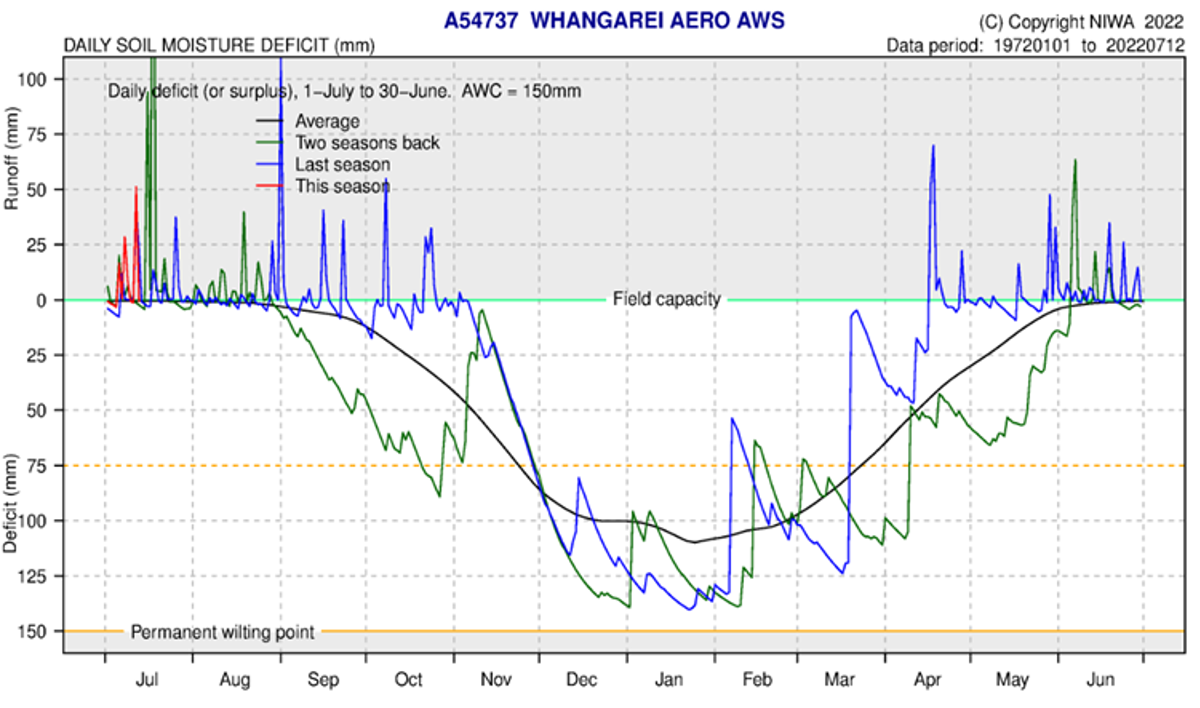
Soil moisture
In June and early July soil moisture levels have maintained soil moisture levels above field capacity across northland, with regular spikes in run off correlating with rain events. Further rainfall will result in run off and even small events could show some change in river levels. The soil moisture deficit is calculated based on incoming daily rainfall (mm), outgoing daily potential evapotranspiration (mm), and a fixed available water capacity (the amount of water in the soil 'reservoir' that plants can use) of 150 mm” (NIWA).