December 2021 climate report
24 Jan 2022, 11:13 AM
Summary
- Rainfall during December was less than normal at around 76% of rainfall typically recorded for the month
- River Flows were “Normal” or “Above Normal” for most of Northland
- Groundwater levels were “Above Normal” in most groundwater systems
- Soil moisture is “below average” at all sites for this time of year. Soil moisture is decreasing rapidly during periods of no rain, likely due to the elevate air temperatures
- NIWA long-term outlook predicts “above average” temperature and “near normal” rainfall between January and March. NIWA note that some rain events may be heavier than expected as some ex-tropical storms may continue to affect Northland’s climate.
Outlook
January to March 2022:
The NIWA long term forecast for January to March 2022 indicates that La Nina conditions have strengthened, and this is the main factor driving the weather in New Zealand at the moment. In Northland, this means we are likely to see higher than average temperatures, with periods of excessive humidity. Rainfall, soil moisture and river flow however are likely to be around average, with long dry spells likely between rain events. There is a chance that some ex-tropical cyclone activity could bring some heavy rain events. For more details please refer to NIWA’s seasonal climate outlook for January – March 2022:
See the seasonal climate outlook on NIWA's website: niwa.co.nz
NIWA Temperature, Rainfall, Soil Moisture and River Flows probabilities for the period of January 2022 to March 2022
(Expressed as % likelihood for either Above Average, Near Average or Below Average conditions).
| Temperature | Rainfall | Soil moisture | River flows | |
| Above average | 80• | 25 | 20 | 25 |
| Near average | 15 | 40• | 40• | 40• |
| Below average | 05 | 35 | 40 | 35 |
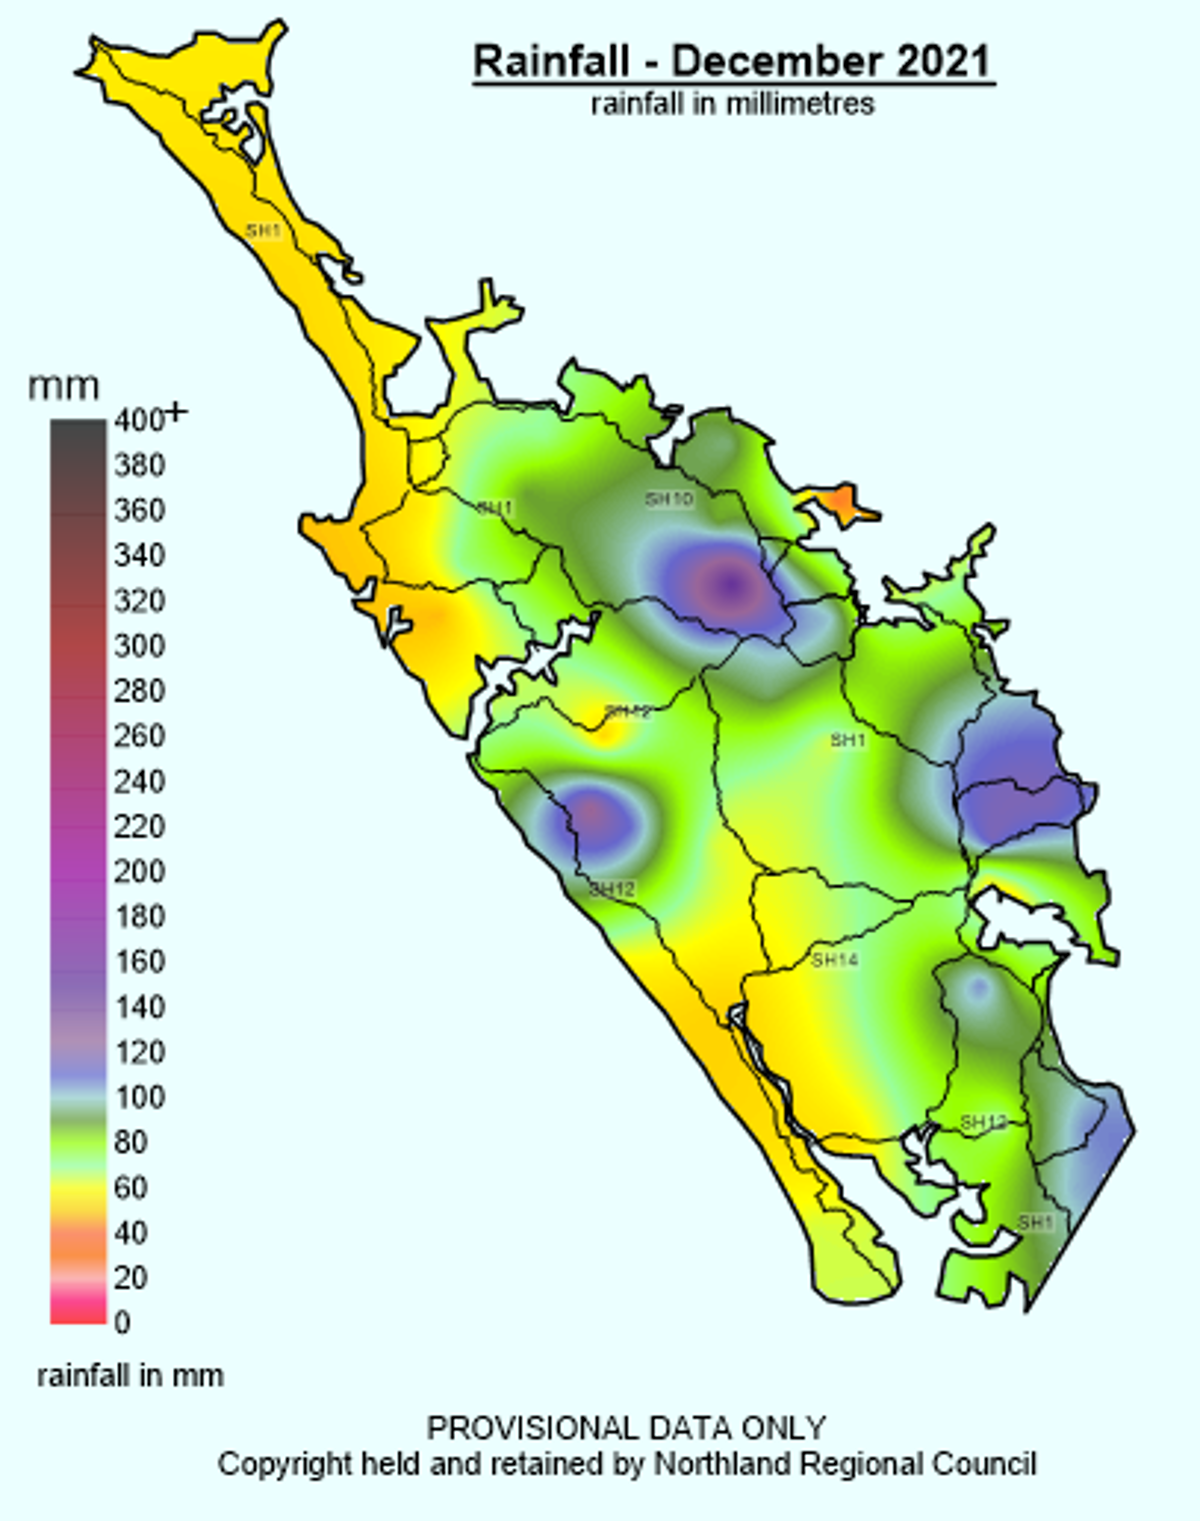
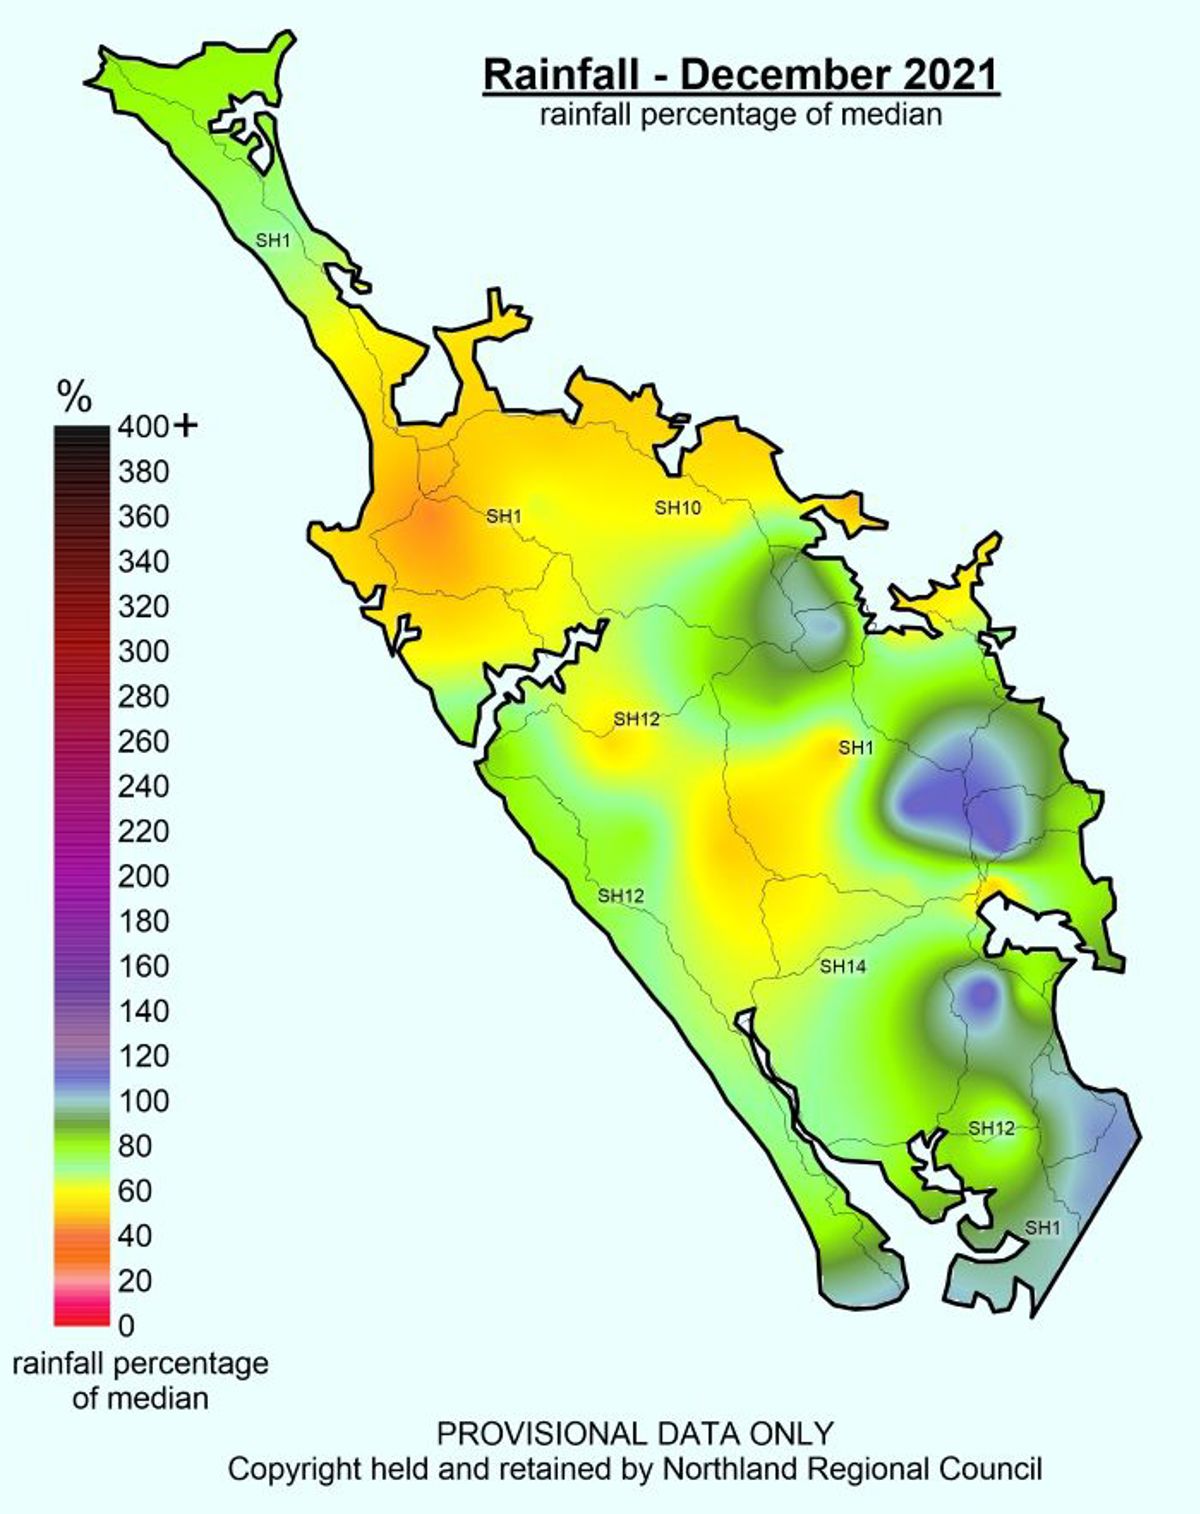
Rainfall
The rainfall in December on average across the region was 81 mm. The highest rainfall was 152.5 mm at Waitangi at Wiroa Road, with the hill country, particularly Waitangi Hills, Tutamoe Range, Whangārei Eastern Hills and areas on our southern boundary also experiencing higher rain fall amounts. The lowest was Purerua Peninsula with 42mm and Rotokakahi in the Northern Hokianga with 48.5mm. That 81mm equated to a regional percentage of 76% for December so a little on the drier side, particularly for areas in the Far North. Larmer Road, near Kaitaia, had the lowest percentage at 44% with many other sites in the north at around 50%. Highest percentages went to Glenbervie Forest north of Whangārei and Waikokopa at McDonnell south of Whangārei with 118% and 117% respectively. In the middle, Whangārei sites had around 50-60%.


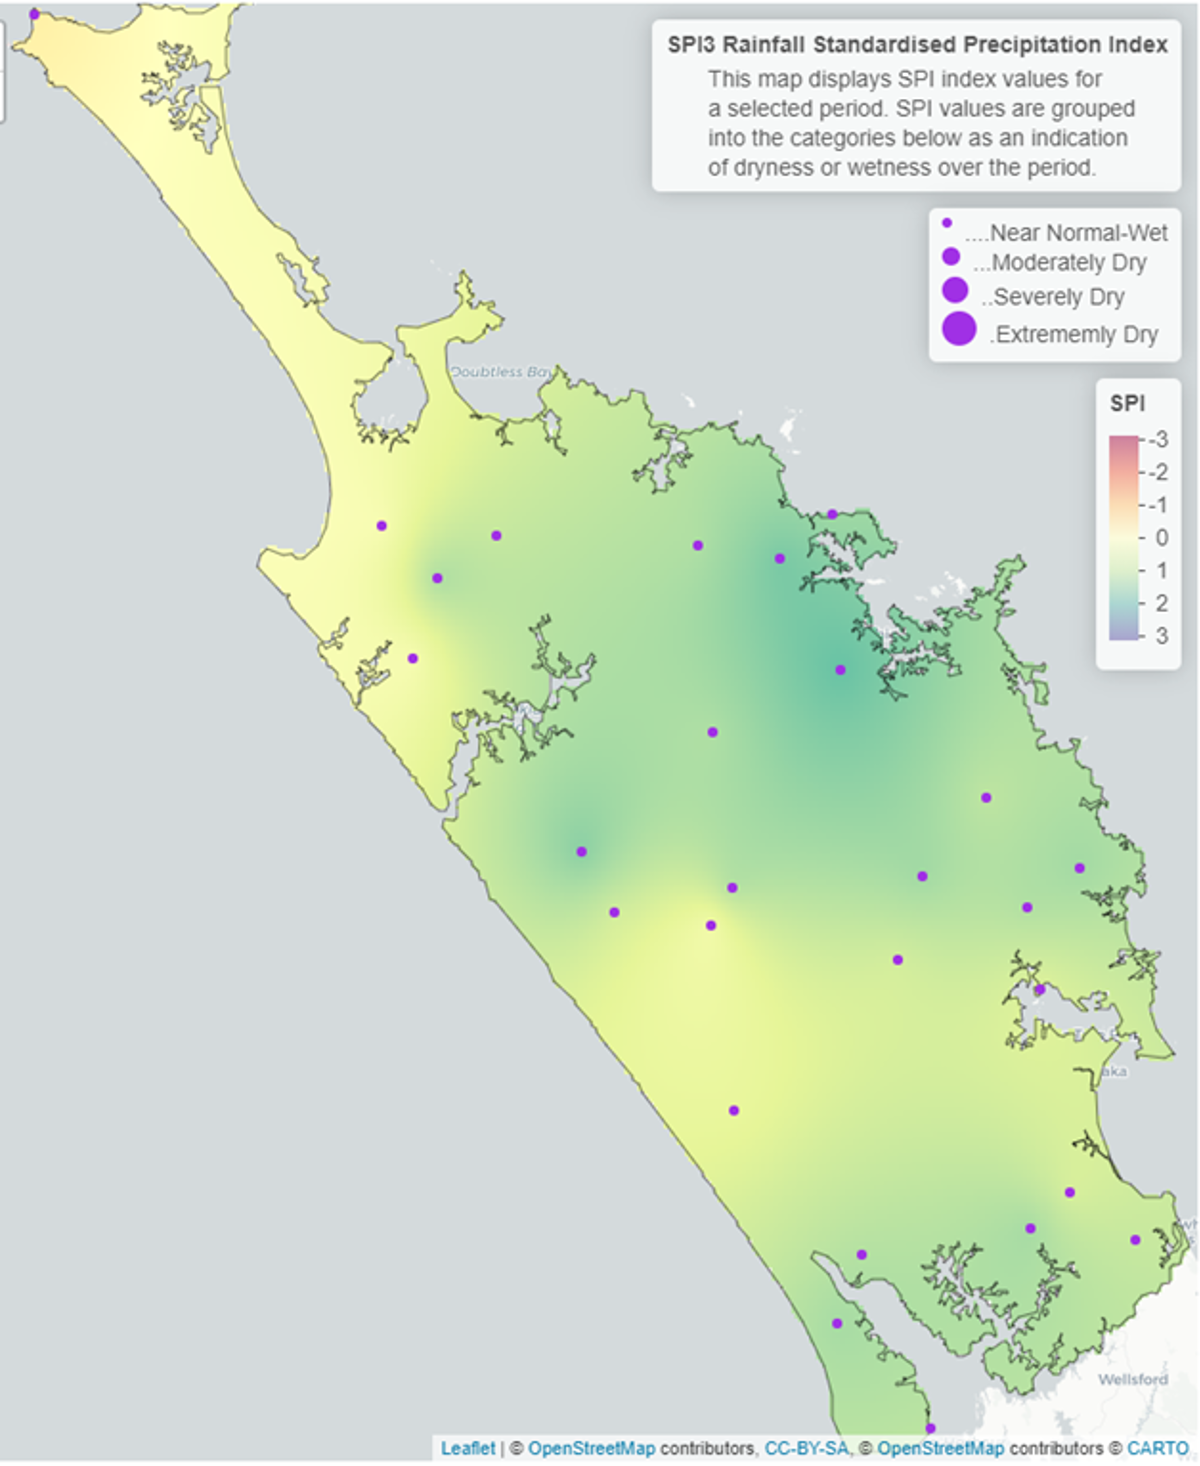
The 3-month standardised precipitation index (SPI 3) values for October – December 2021 reflect the wet October and steady rainfall through November and December, with near normal to wet conditions shown in all areas. The 6-month standardised precipitation index (SPI 6) show near normal – wet conditions from June – December 2021, see maps below. The values for the rainfall deficit for the previous periods from the end of December are shown in the table below, with most sites recording slightly lower than typical rainfall for December, however on a 3 – 12 month scale majority of sites across normal show a greater than expected rainfall for the respective period.


Rainfall deficit values (mm)
Negative values represent rainfall deficit, positive values represent rainfall in excess of “typical” rainfall.
| Site | End date | 1 Month | 3 Months | 6 Months | 12 Months |
| Kaitaia Ews | December 2021 | -30.22 | 30.28 | 63.53 | 23.57 |
| Kerikeri Ews | December 2021 | -24.33 | 318.60 | 416.32 | 426.96 |
| Kaikohe Aws | December 2021 | -7.77 | 166.38 | 206.10 | 154.19 |
| Whangārei Aero Aws | December 2021 | -23.70 | 99.56 | 220.19 | 242.16 |
| Dargaville 2 Ews | December 2021 | -15.11 | 62.44 | 15.87 | -66.92 |
| Awaroa at Wallace Road | December 2021 | 2.00 | 79.67 | 20.95 | -52.58 |
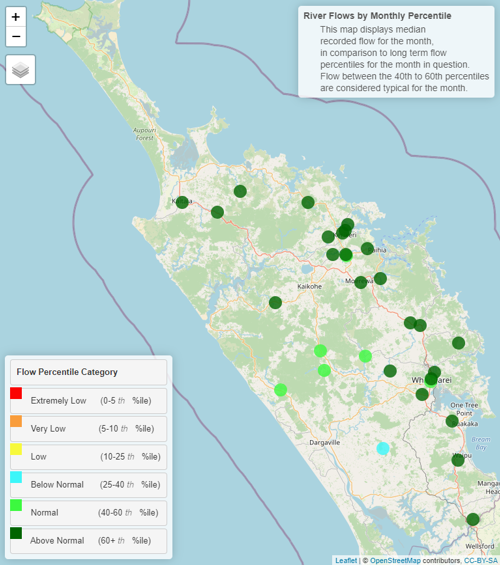
River flow
River flow for December 2021 continued to show a similar pattern to September – November with most sites recording “Above Normal” flows. Sites to the west of Northland recorded “Normal” flows, other than the Manganui River that has dropped to “Below Average” flows. Generally elevated river flow has been driven by regular rain events through the month.
Flow map December 2021
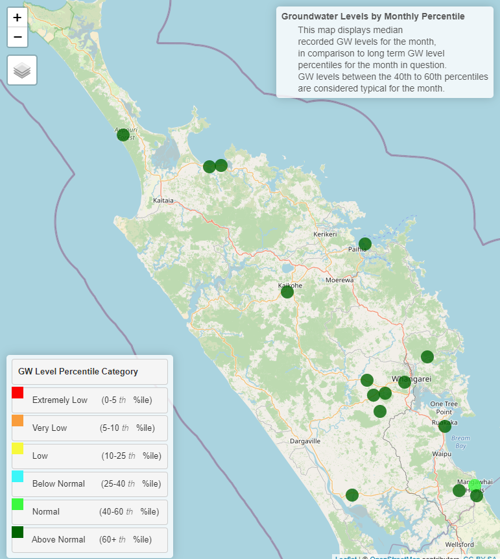
Groundwater
During December 2021 groundwater levels continued to be “Normal” or “Above Normal” at all locations. Groundwater remains elevated following a wet winter and spring. See table and map below.
Northland aquifer status table for December 2021
| Groundwater systems | Status | Percentile |
| Aupōuri | Above normal | 60th+ |
| Taipā | Above normal | 60th+ |
| Russell | Above normal | 60th+ |
| Kaikohe | Above normal | 60th |
| Poroti | Above normal | 60th+ |
| Whangārei | Above normal | 60th+ |
| Mangawhai | Normal | 40-60th |
| Marsden - Ruakākā | Above normal | 60th+ |
| Ruawai | Above normal | 60th+ |
Northland aquifer status map December2021
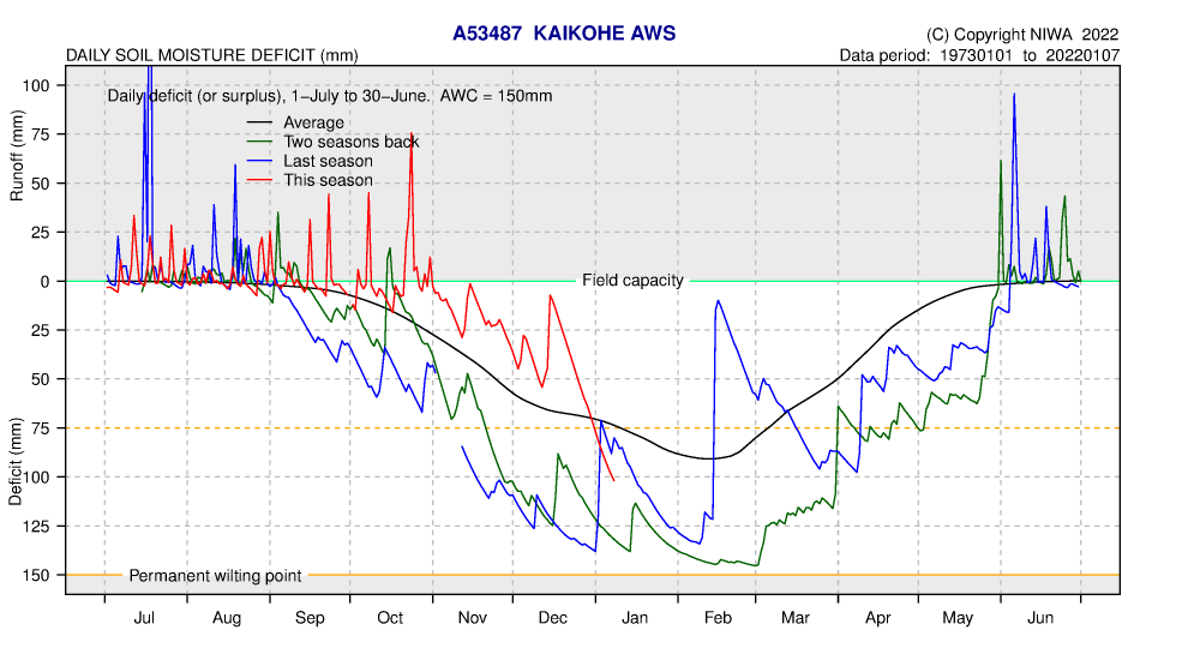
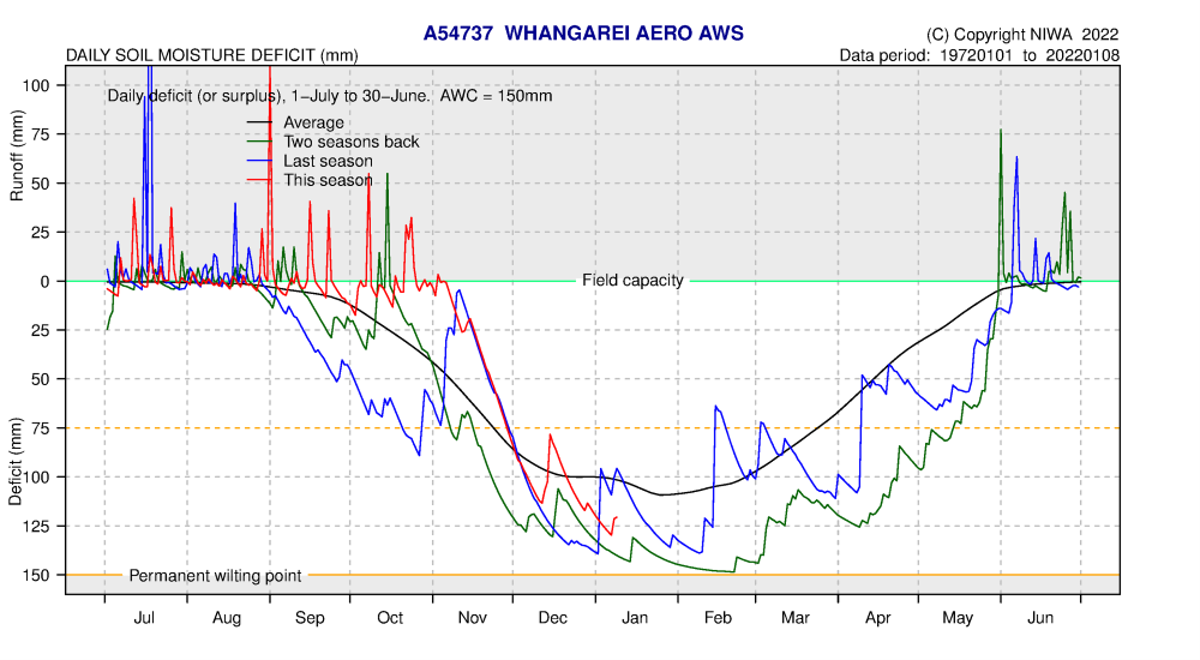
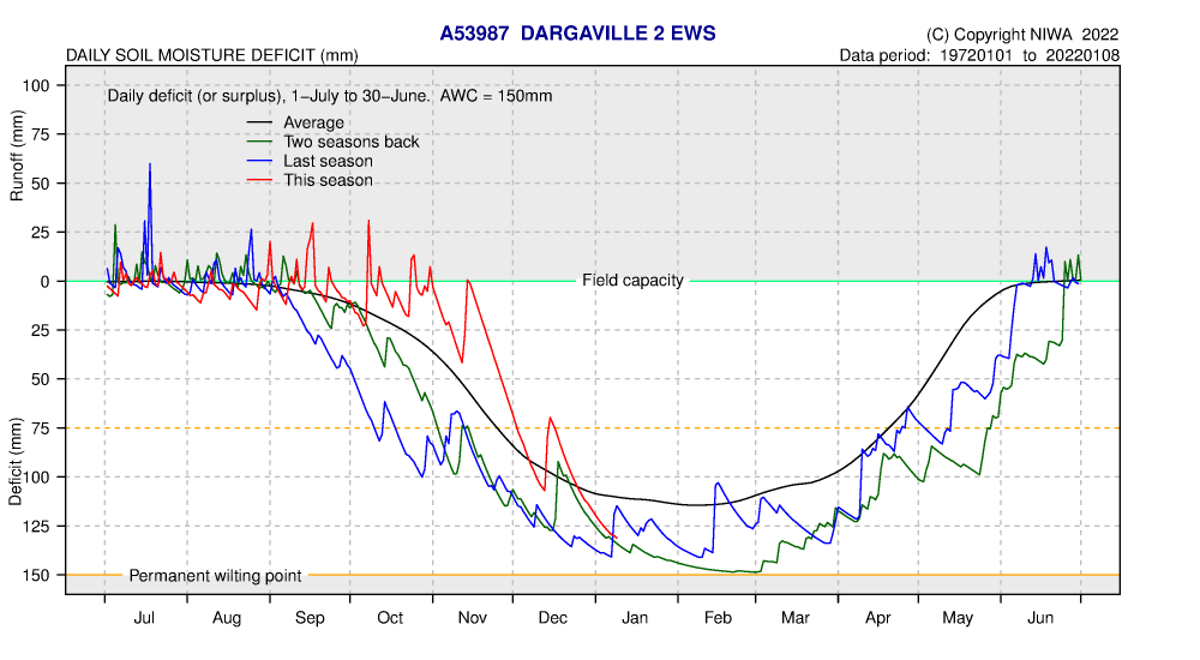
Soil moisture deficits
NIWA modelling of the water balance indicates that soil moisture conditions remained wetter than average through the bulk of December but have dropped below average toward the end of December. These conditions are similar to previous years at this time. All sites are below Field capacity indicating that minor rainfall events are not likely to cause any significant river runoff, which is the expected scenario for this time of the year. The soil moisture deficit is calculated based on incoming daily rainfall (mm), outgoing daily potential evapotranspiration (mm), and a fixed available water capacity (the amount of water in the soil 'reservoir' that plants can use) of 150 mm” (NIWA).