November 2022 climate report
6 Dec 2022, 2:13 PM
Summary
- La Nina continues to intensify and is the main driver for the upcoming summer weather.
- Temperatures are likely to be “above average” for November – February, with rainfall being “near average”.
- Rainfall in November was much higher than expected with the region receiving 314% more rainfall than expected.
- Standardized rainfall for 3- and 6-month periods have recorded “near normal to wet” conditions across Northland.
- River flows are generally “above normal” for November across Northland.
- Ground water levels in all aquifers are all “above average”.
- Soil moisture levels are at or within 25 mm of field capacity and are above average for November.
Outlook
December 2022 to February 2023
Heading into summer, La Nina and above average marine temperatures will continue to drive the climate in New Zealand for summer (December – February 2023). Temperatures are predicted to be “above average”, while rainfall, soil moisture and river flow are likely to be “near average” or “above average”. There is increased risk of cyclone activity in the Southwest Pacific due to cool La Nina conditions in the equatorial area, which may affect New Zealand. Sea surface temperatures for November were “above average” with a marine heatwave developing, these conditions are predicted to continue.
For more details, please refer to NIWA’s seasonal climate outlook for December 2022 - February 2023:
See the seasonal climate outlook on NIWA's website: niwa.co.nz
NIWA Temperature, Rainfall, Soil Moisture and River Flows probabilities for the period of December 2022 to February 2023
(Expressed as % likelihood for either Above Average, Near Average or Below Average conditions).
| Temperature | Rainfall | Soil moisture | River flows | |
| Above average | 70• | 35 | 40• | 35 |
| Near average | 25 | 40• | 45• | 45• |
| Below average | 05 | 25 | 15 | 20 |
Rainfall
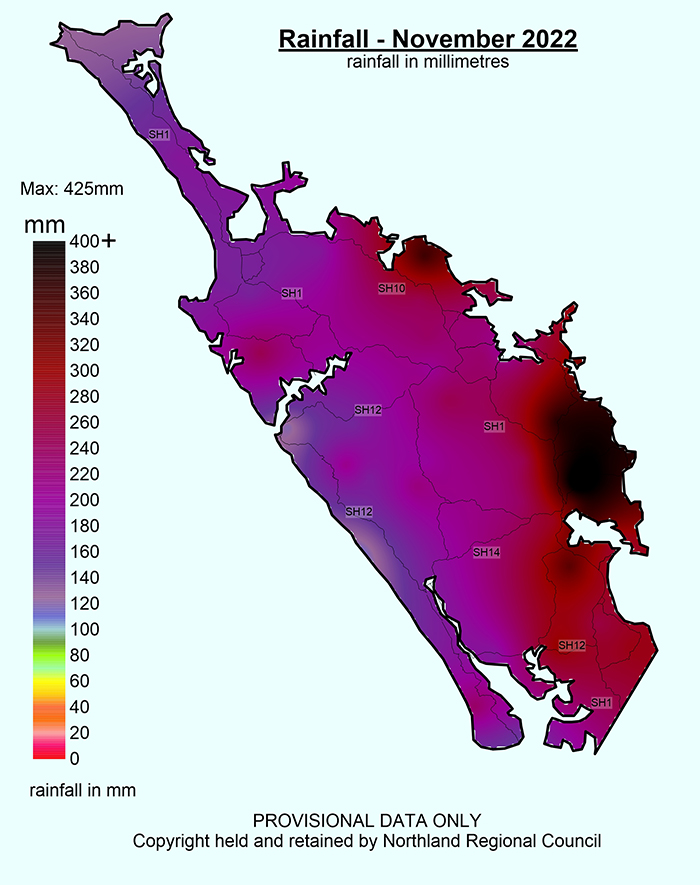
November was wetter than average with Northland experiencing 314% of its expected rainfall (241 mm), with most days having some rain particularly in the second part of the month. The east coast and southern reaches of Northland received the highest expected rainfalls with 489% in Whangārei, 429% on Pouto Peninsular and 400% in Bream Bay. The west coast was more sheltered and received the least rain with 153 % of the expected rainfall for November recorded at Kai Iwi Lakes.
Rainfall (% of Median) for November 2022 across Northland with a range of 151% to 489%
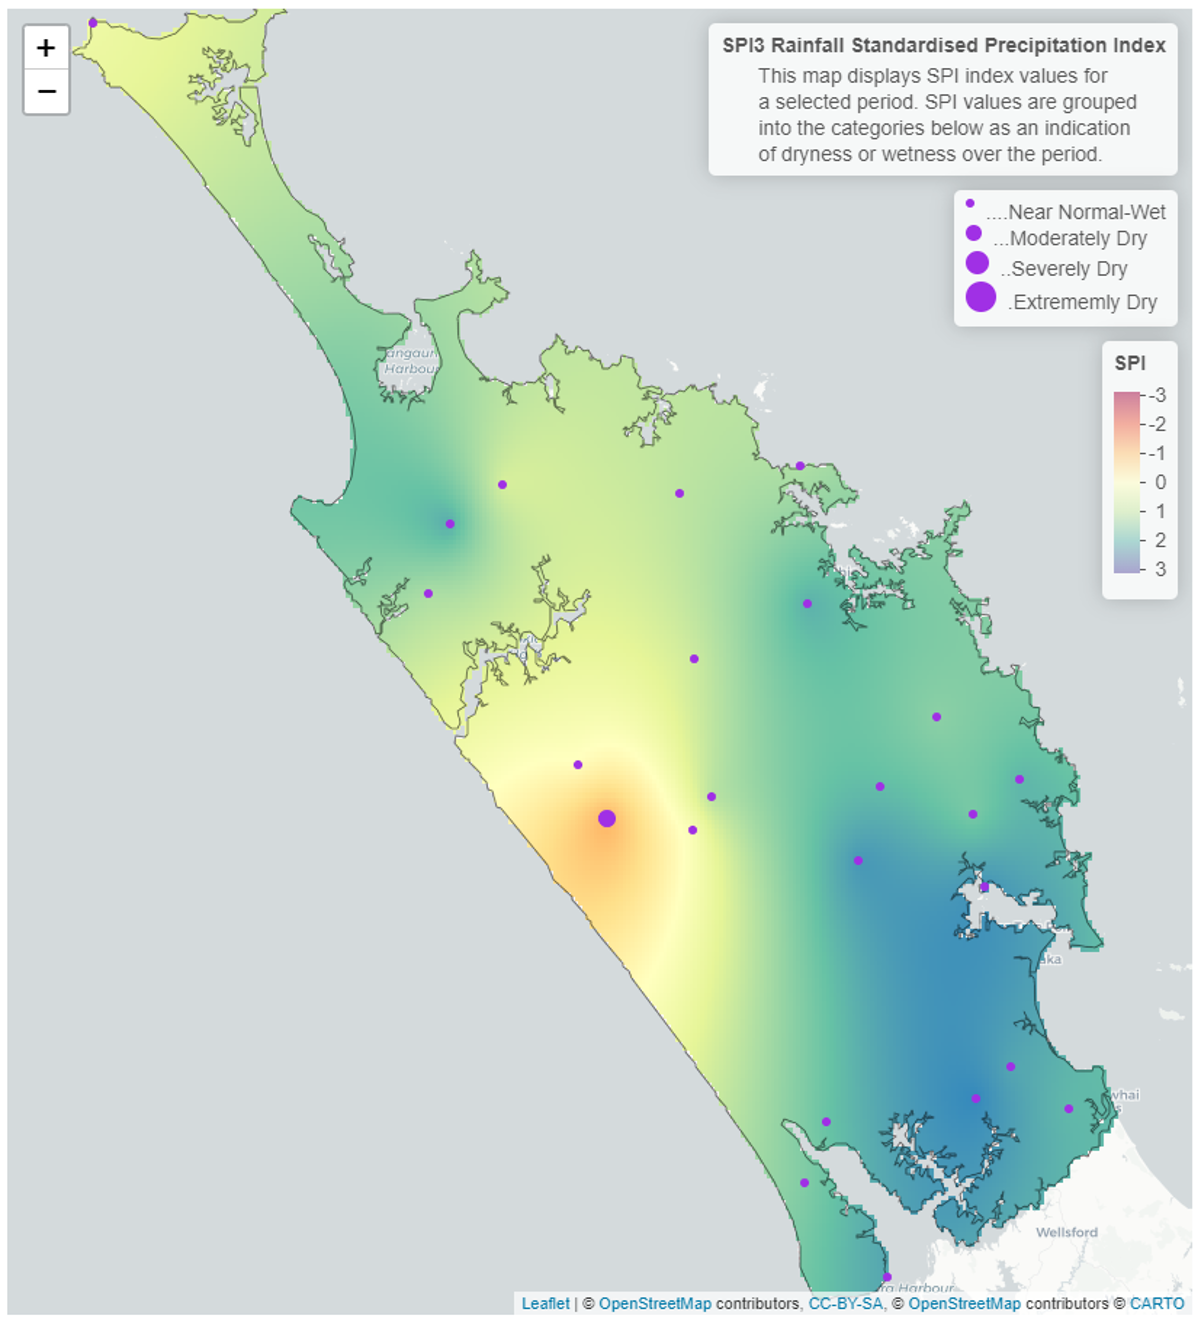
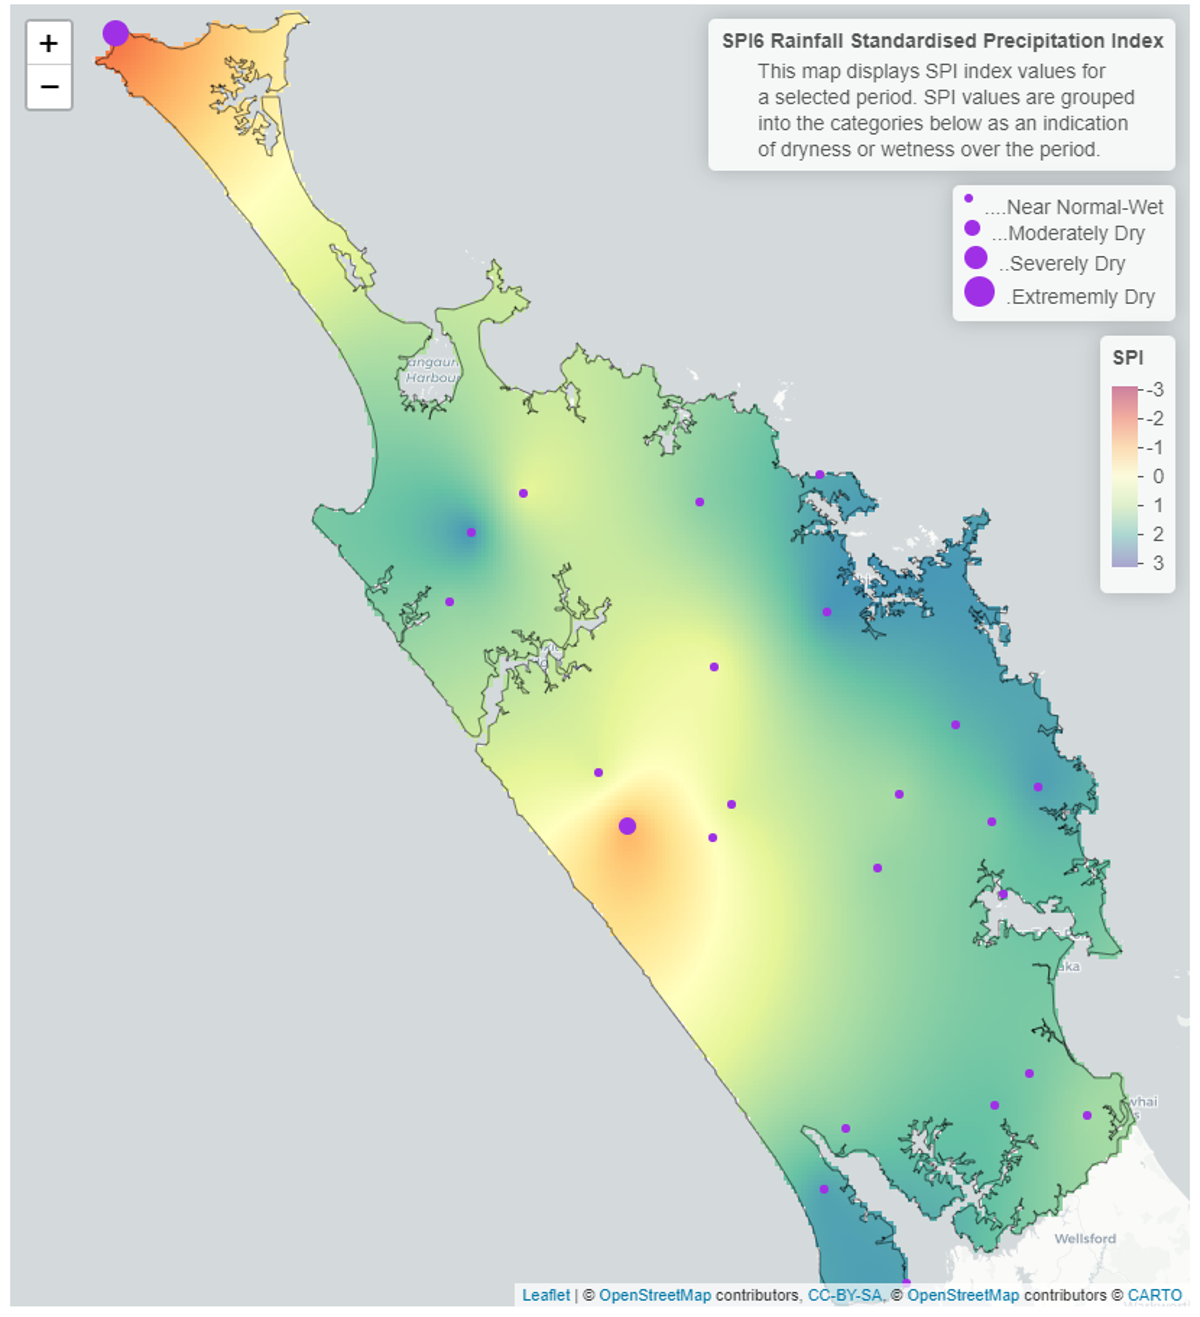
Standardised Precipitation index (SPI)
The Standardised Precipitation Index (SPI) on a three-month continues to show the same patterns seen throughout winter in Northland with rainfall at most sites being “near normal or wetter” than normal. The six-month SPI shows “near normal or wetter” conditions for most of Northland. However at Cape Reinga and Kai Iwi Lake, due to equipment faults, the areas appear to be severely dry, which should be disregarded.
3 and 6-Month SPI (Standardised Precipitation Index) Map for November 2022
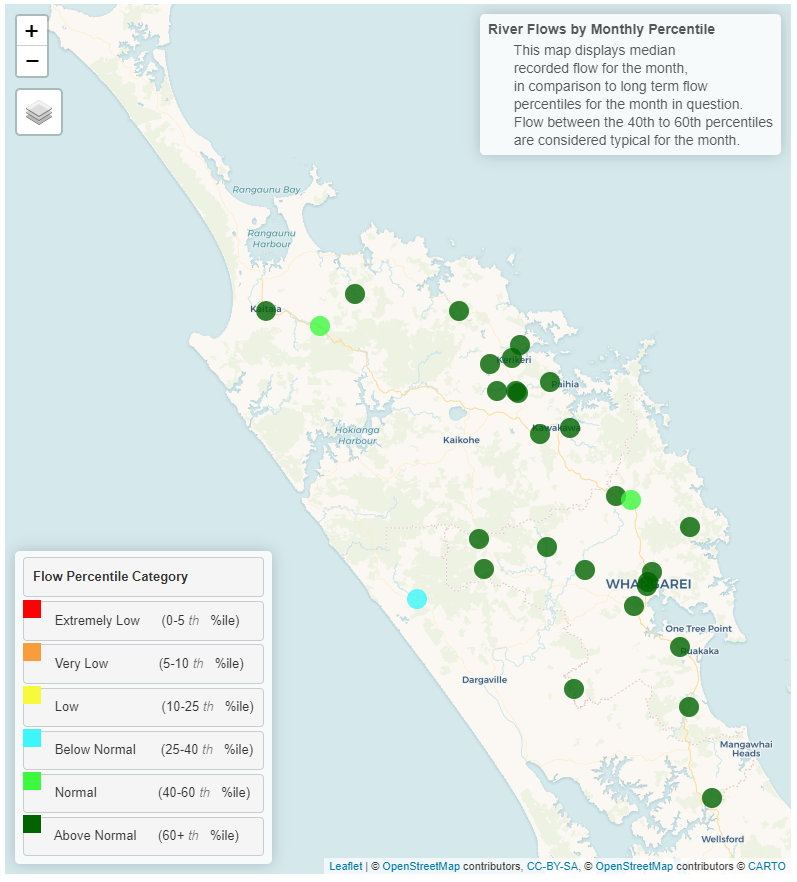
River flow
During November, river flows were driven by the far higher than average rainfalls recorded in Northland. With majoring of catchments recording “above normal” flows for November. The only outlier of this pattern was on the west coast where about average rainfalls were recorded. Where river levels were “below normal” for November.
Monthly percentile River Flows for November 2022
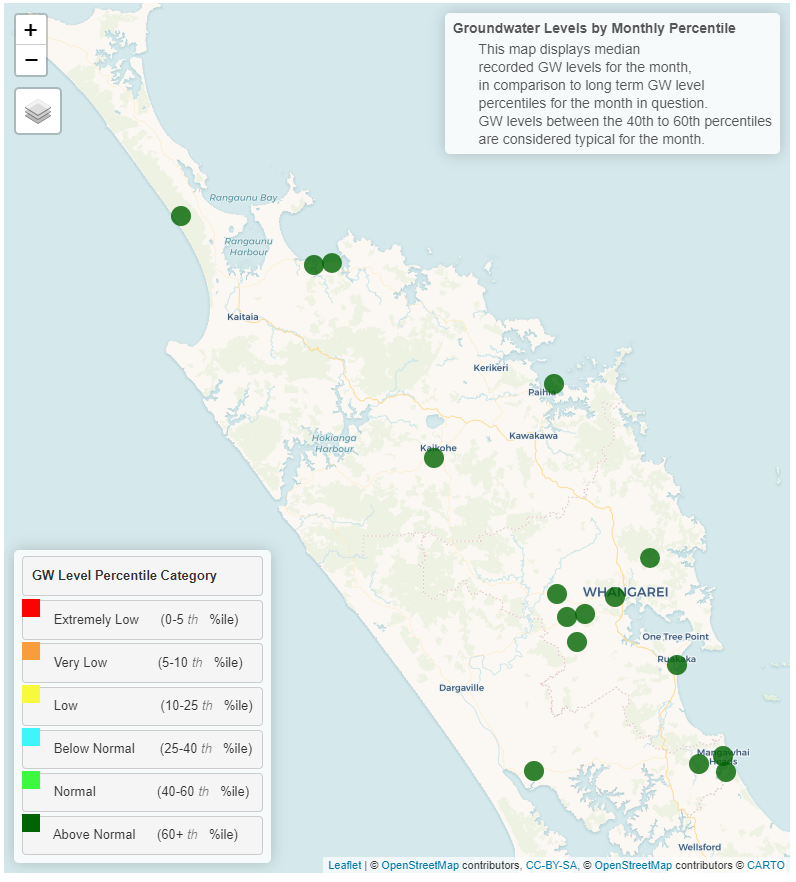
Groundwater
All the key aquifers in Northland are currently recording “Above Normal” water levels for November.
| Aquifer | Status | Percentile |
| Aupōuri | Above normal | 60th+ |
| Taipā | Above normal | 60th+ |
| Russell | Above normal | 60th+ |
| Kaikohe | Normal | 60th+ |
| Poroti | Normal | 60th+ |
| Whangārei | Normal | 60th+ |
| Mangawhai | Above normal | 60th+ |
| Marsden - Ruakākā | Above normal | 60th+ |
| Ruawai | Normal | 60th+ |
Groundwater map for November 2022
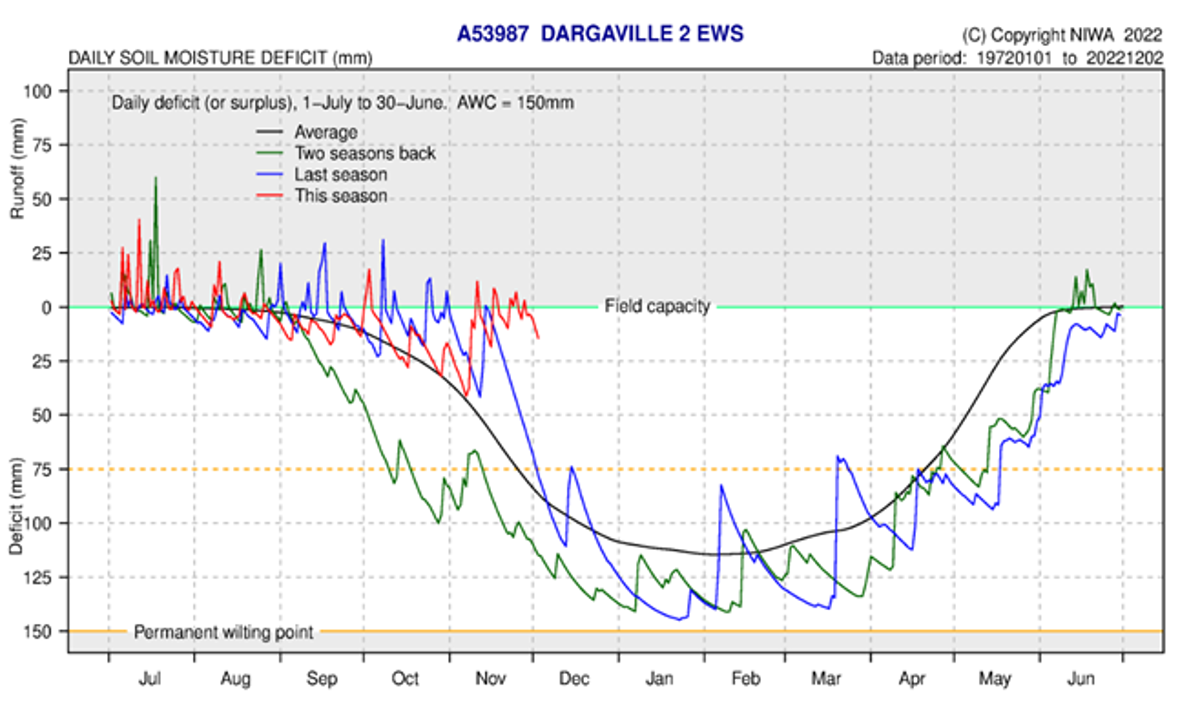
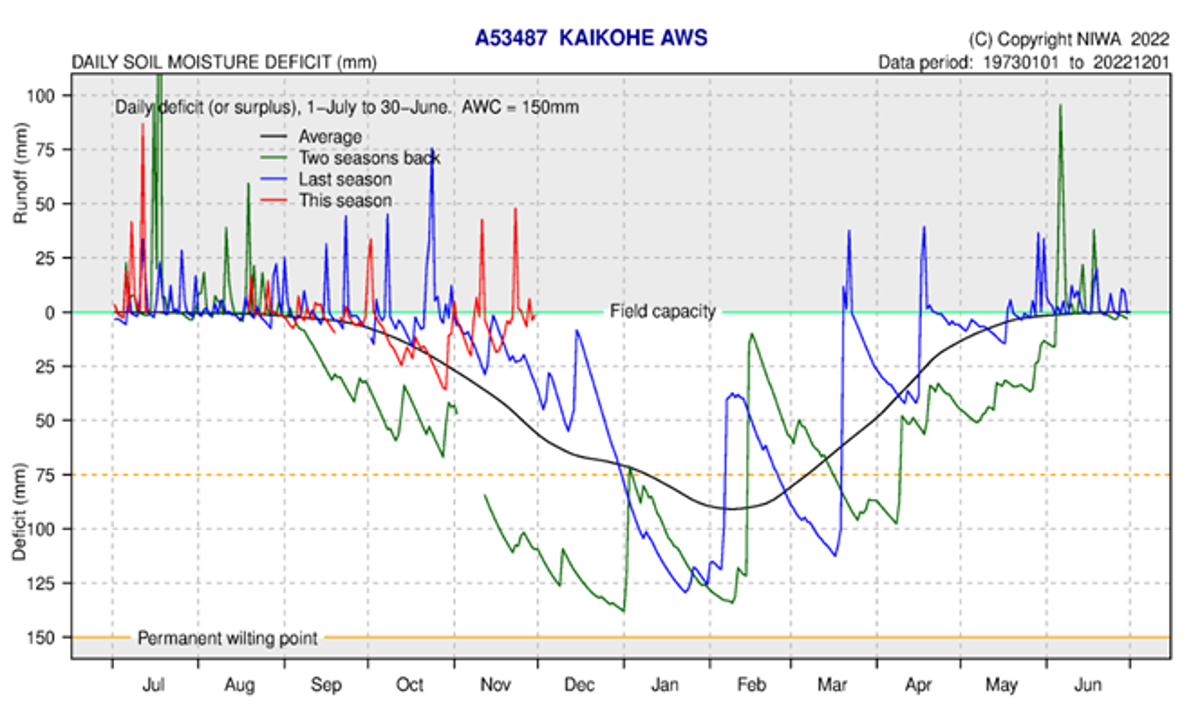
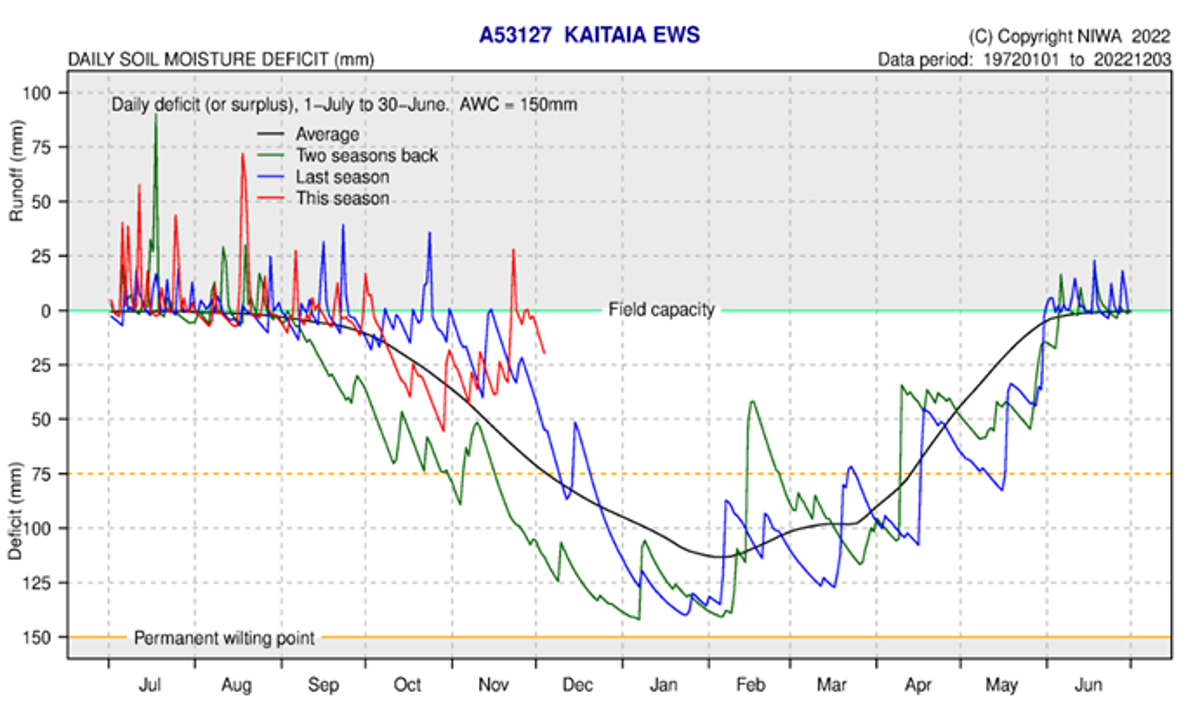
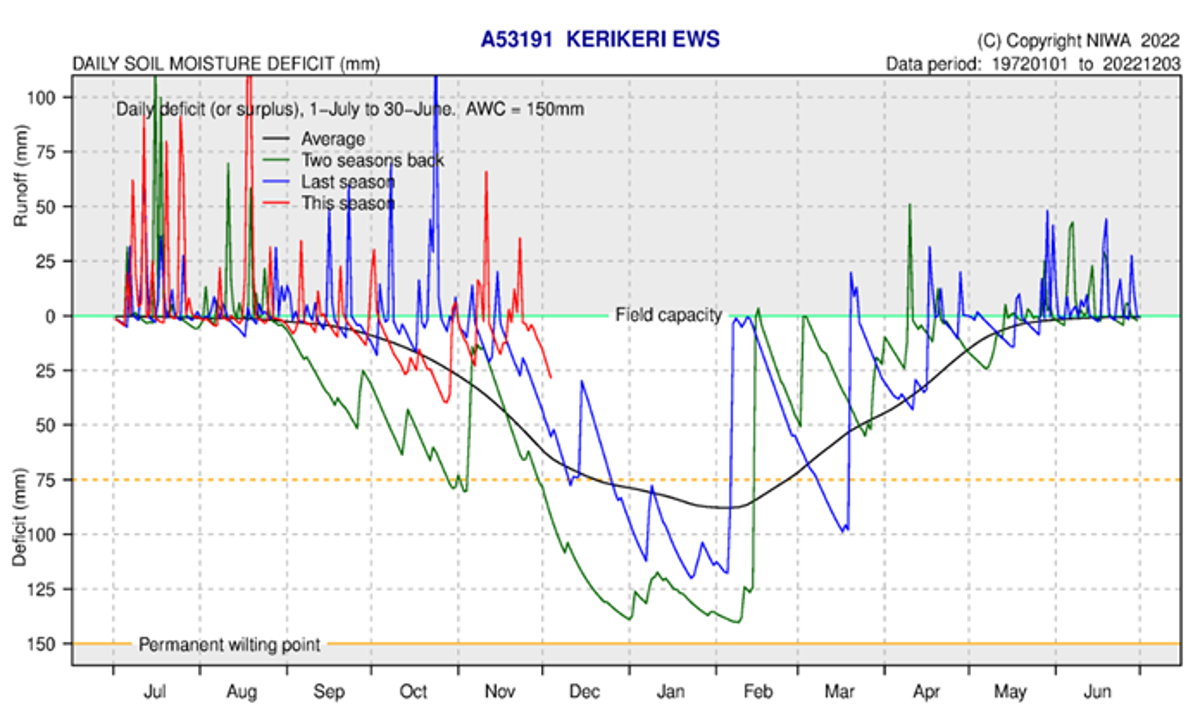
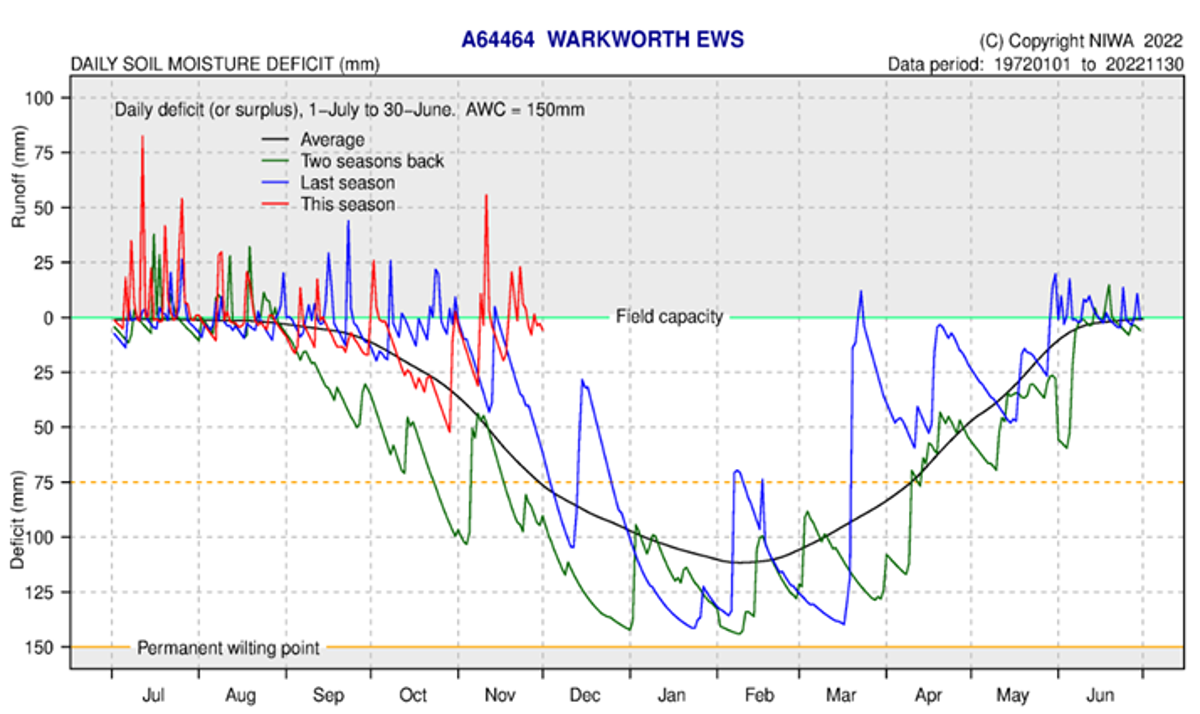
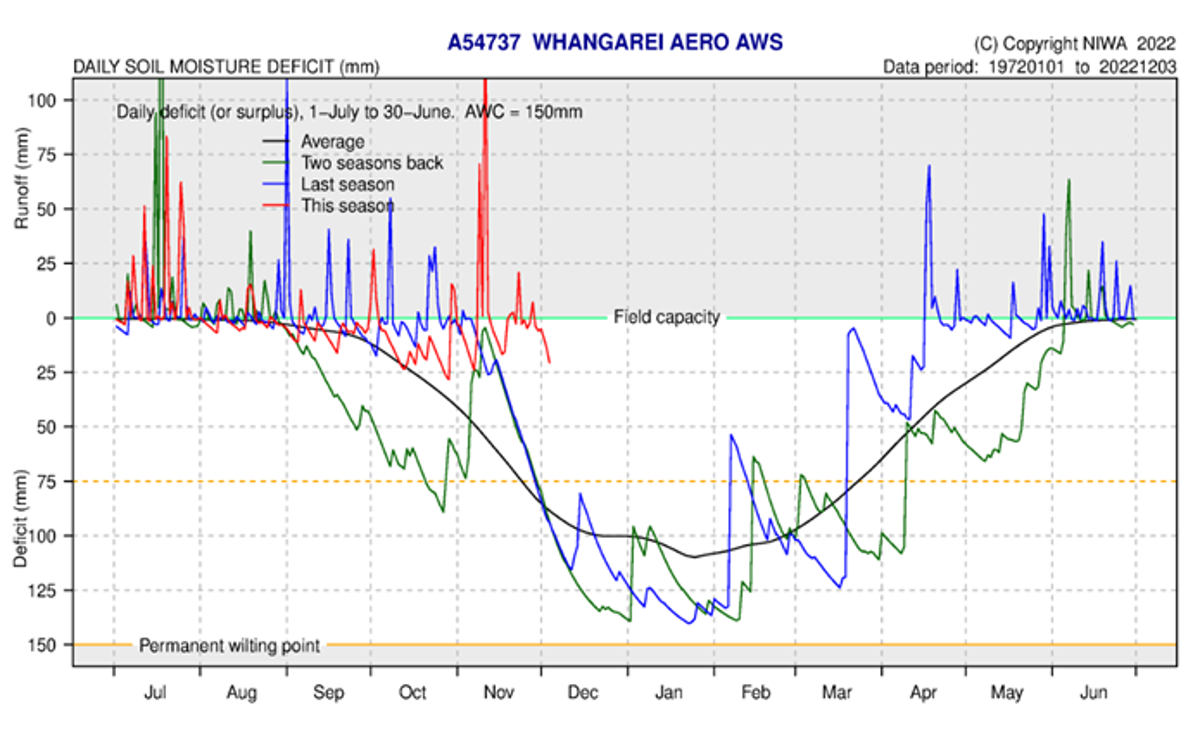
Soil Moisture
Soil moisture in the first week of November started to drop with most sites falling to a 25 – 50 mm deficit in available plant water. However, soil water levels rose back to field capacity and had several spikes of run off, which coincided with larger rain events recorded during November, with most sites at the start of December being at or within 25 mm of field capacity. The current moisture contents, at the start of December, at all sites in northland is higher than average as well as the previous two seasons. The soil moisture deficit is calculated based on incoming daily rainfall (mm), outgoing daily potential evapotranspiration (mm), and a fixed available water capacity (the amount of water in the soil 'reservoir' that plants can use) of 150 mm” (NIWA).