July 2022 climate report
8 Aug 2022, 8:51 AM
Summary
- The driving forces of the weather in Northland currently are the continuation of La Nina, and the strengthening of the Indian Ocean Dipole.
- Temperatures between August and October are likely to be higher than normal, while rainfall and river flows will be near average.
- Rainfall in July was much higher than normal, with Northland receiving 192% of what was expected. This was more concentrated to the east coast.
- The standardised precipitation index shows that rainfall in Northland at both a three (May – July) and six (February – July) month scale has been “near normal”.
- River flows in Northland are mostly “above normal” for July, other than some sites on the west coast that are lower than expected.
- Groundwater remains higher than expected with all sites either “above normal” or “normal”.
- Soil moisture levels are at field capacity and rain event in July caused 50 – 75 mm of overland flow during rain events.
Outlook
August to October 2022
Strong trade winds in the Pacific Ocean are driving cooling sub surface sea temperatures and are causing La Nina conditions to re-strengthen and is the driving force of the long-term forecast. NIWA suggests that spring is likely to experience warmer conditions, with rain events being driven from sub-tropical systems causing periodic heavy rain, with extended dry spells between events. Soil moisture and river flows are all likely to be near average or above average for this time of year.
For more details, please refer to NIWA’s seasonal climate outlook for August-October 2022:
See the seasonal climate outlook on NIWA's website: niwa.co.nz
NIWA Temperature, Rainfall, Soil Moisture and River Flows probabilities for the period of August 2022 to October 2022
(Expressed as % likelihood for either Above Average, Near Average or Below Average conditions).
| Temperature | Rainfall | Soil moisture | River flows | |
| Above average | 65• | 25 | 35 | 35 |
| Near average | 30 | 45• | 45• | 45• |
| Below average | 05 | 30 | 20 | 20 |
Rainfall
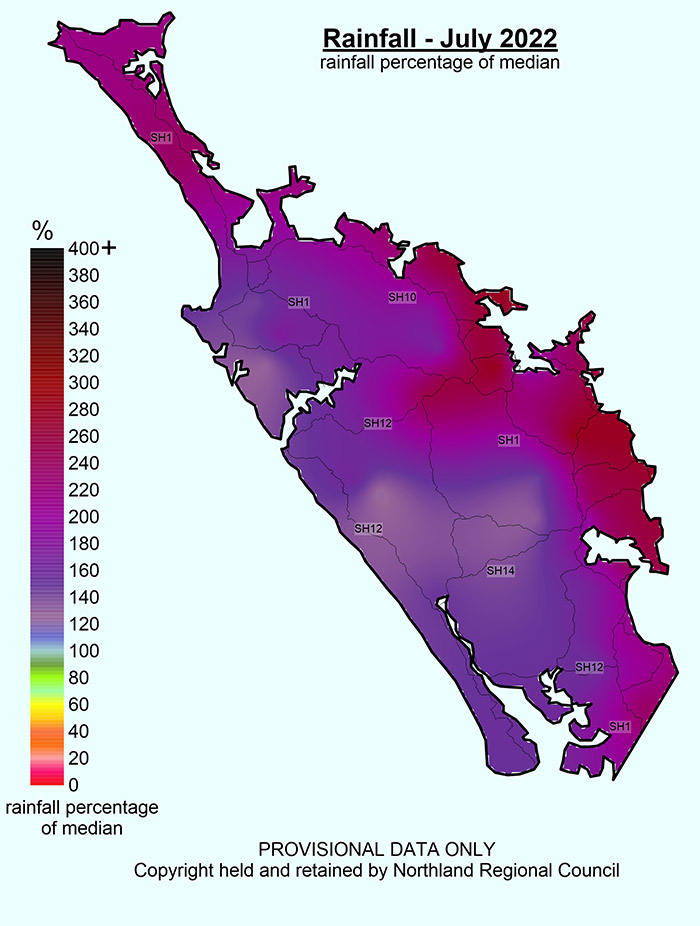
Northland experienced a very wet July. Most days had some rainfall, along with four intense rain events being driven from the east, with high river flows and flooding. The maximum total rainfall was 615.5 mm at Whakapara at Puhipuhi. Close to the maximum were totals recorded at Touwai with 595.5 mm and 576.5 mm at Wiroa Road, in the Waitangi catchment. The minimum rainfall recorded was on the west coast at Pouto Point, with 158.5 mm recorded. Overall Northland received 192% of the expected rainfall for July. Waitangi at McDonald Road had the maximum exceedance of the expected rainfall with 284%, while the lowest variation of expected rainfall was seen at Tutamoe in central Northland which received 122%.
Rainfall (% of Median) for July 2022 across Northland with a range of 284% to 122%
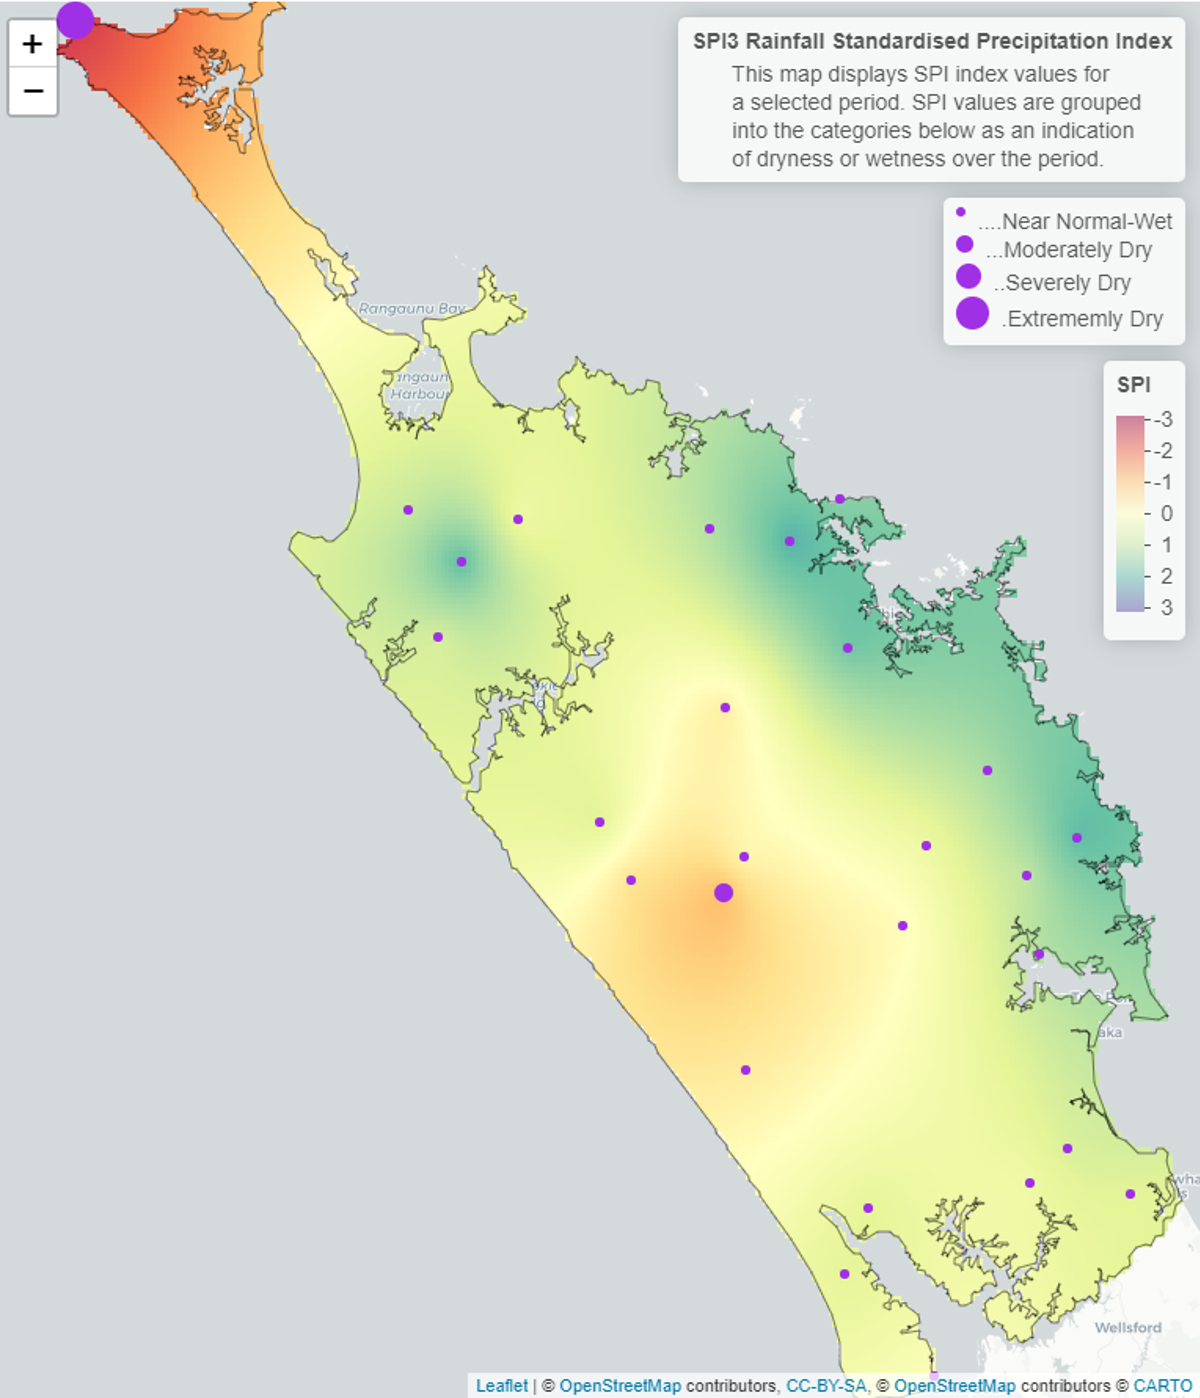
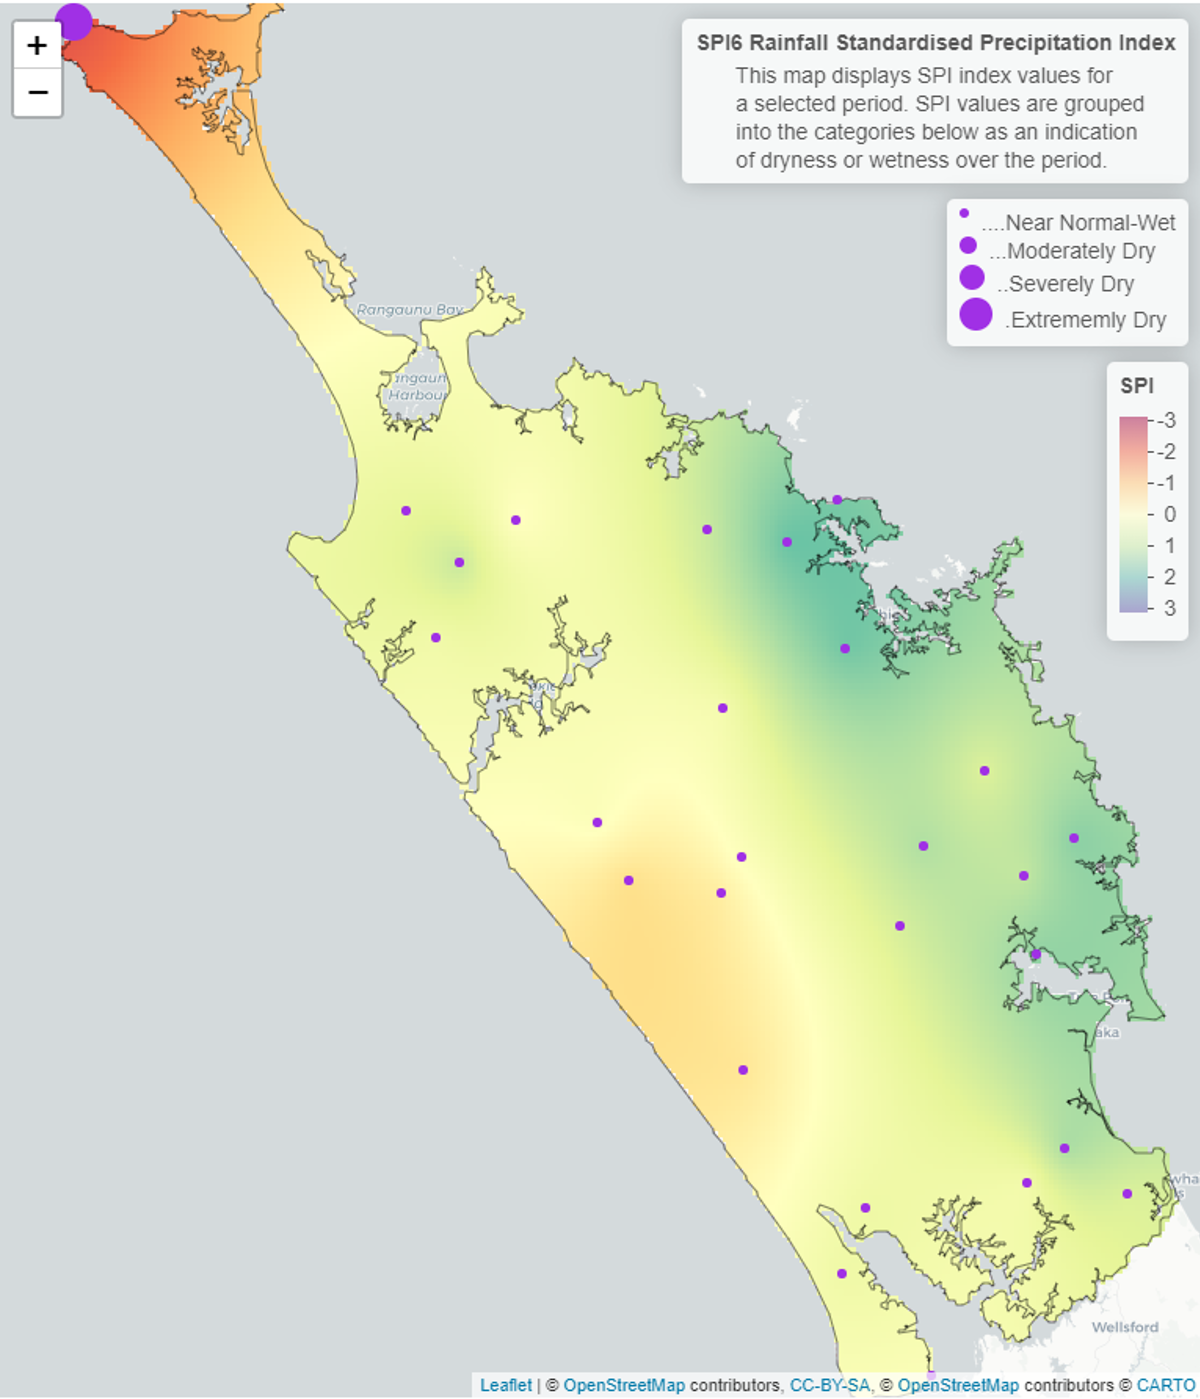
Standardised Precipitation index (SPI)
Analysing the standardized precipitation index at both a 3-month (May– July 2022) and 6-month (February – July 2022) scale shows that for most of Northland conditions were mostly normal. The east coast experienced mostly wet conditions, resulting from very high rainfall amounts recorded in July. The “extremely dry” conditions seen in at Cape Reinga, is due to instrument failure rather than a true representation of the conditions in the northern most areas.


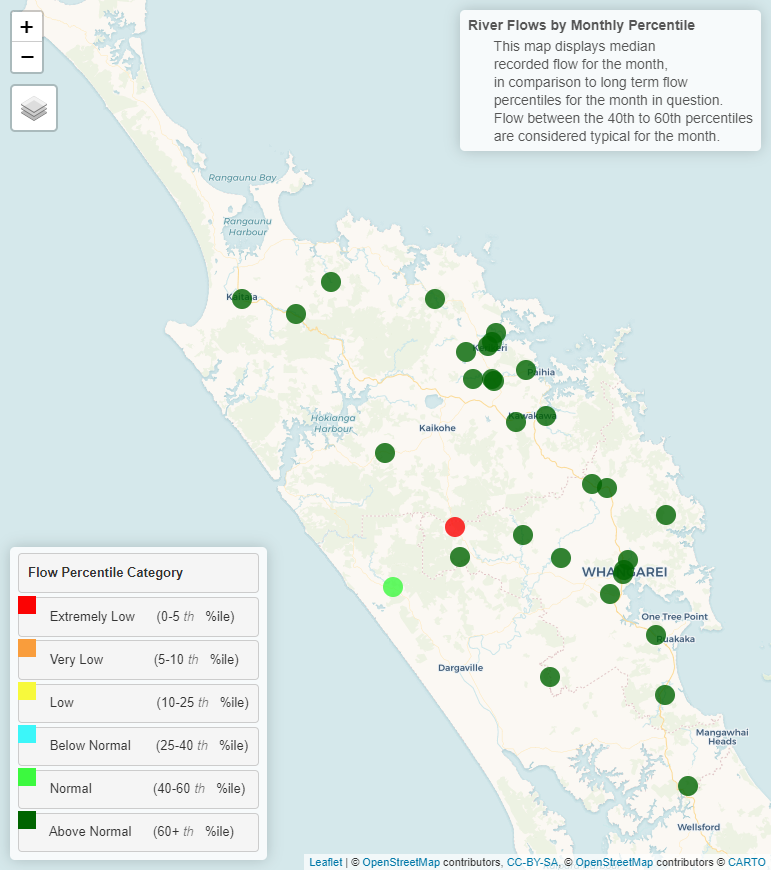
River flow
Throughout July, river flows continued to be high, as observed in June. All sites on the east coast are “above normal” as well as the north and south of Northland. However, on the west coast to the centre of Northland, river flows are lower than expected for July, this is likely caused by the smaller amounts of rainfall received in this area likely due to a rain shadow from the topography of northland and the prevailing easterly winds. River levels are likely to stay high due to saturated soils in most catchments, an inability for evaporation due to low sunshine hours causing base flows to remain high. Any rain events in the next month are likely to result in very high flows and possibly surface flooding.
Monthly percentile River Flows for July 2022
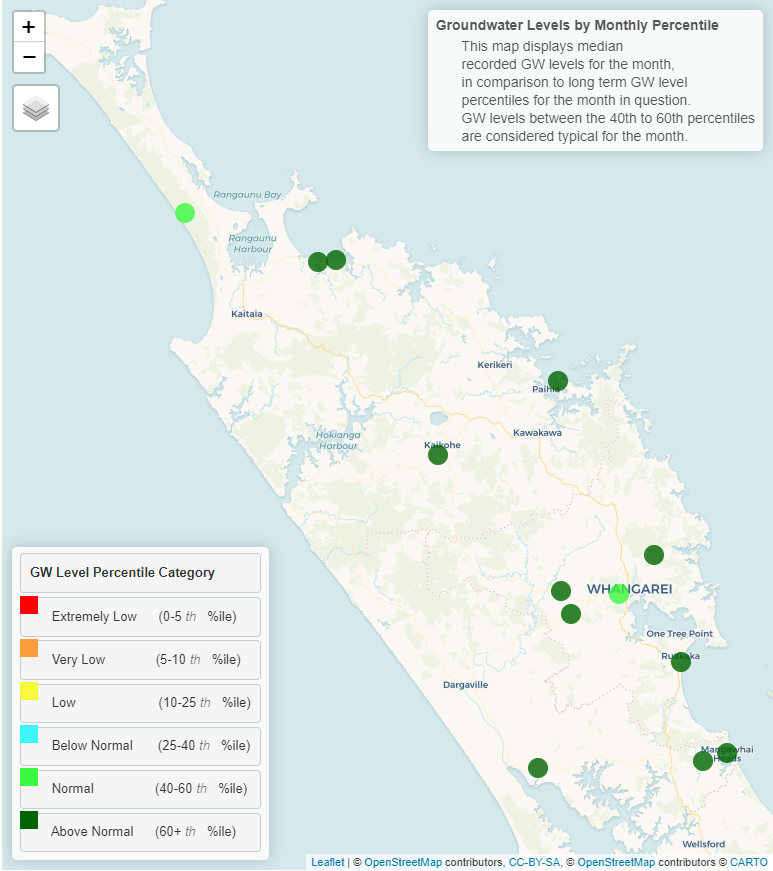
Groundwater
The groundwater levels for July were similar to June with most aquifers being at “above normal” water levels. The Aupōuri and the Whangārei aquifers were the only outliers with “normal” water levels for July.
| Aquifer | Status | Percentile |
| Aupōuri | Normal | 40-60th |
| Taipā | Normal | 60th+ |
| Russell | Above normal | 60th+ |
| Kaikohe | Above normal | 60th+ |
| Poroti | Above normal | 60th+ |
| Whangārei | Normal | 40-60th |
| Mangawhai | Above normal | 60th+ |
| Marsden - Ruakākā | Above normal | 60th+ |
| Ruawai | Above normal | 60th+ |
Groundwater map for July 2022
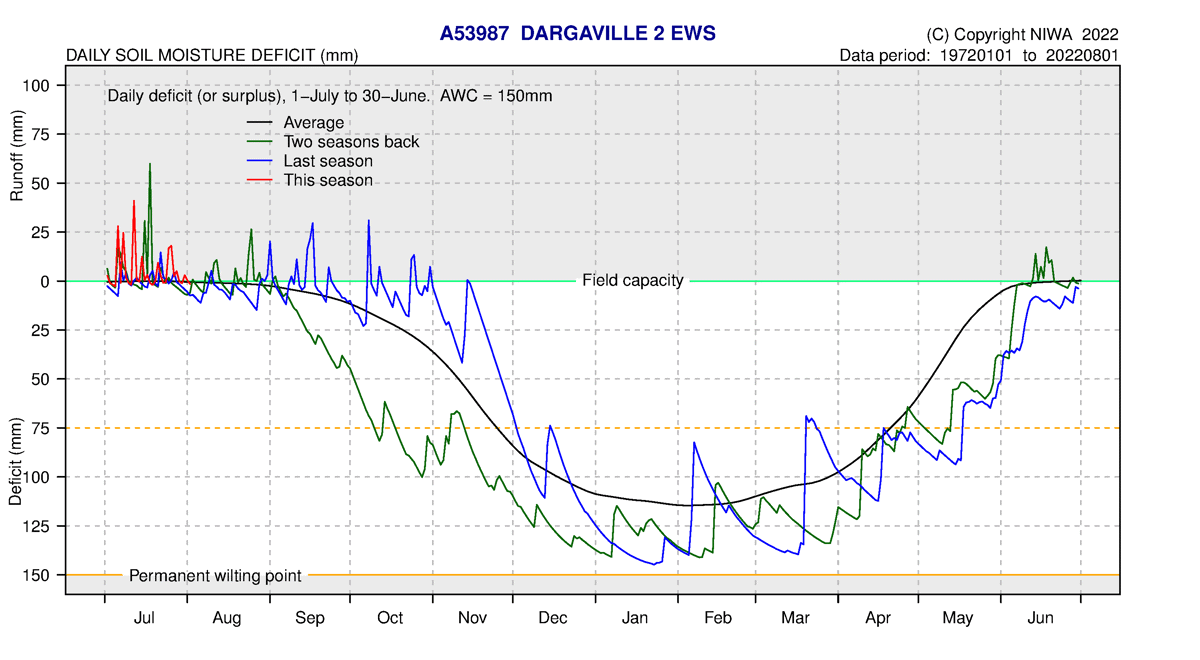
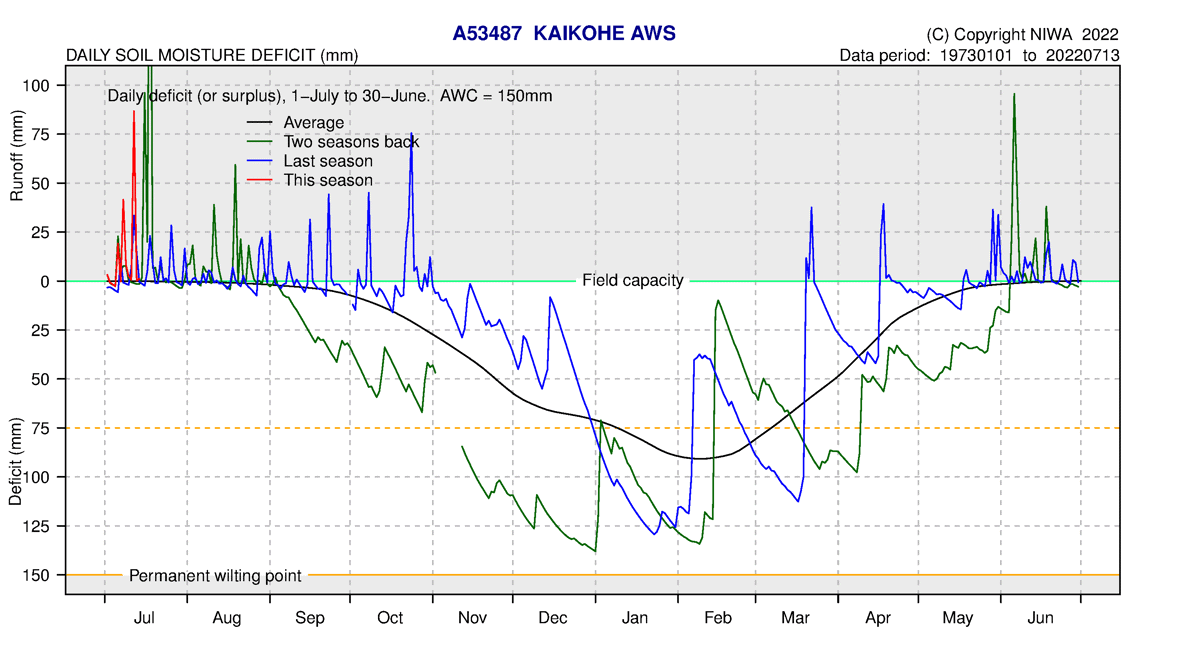
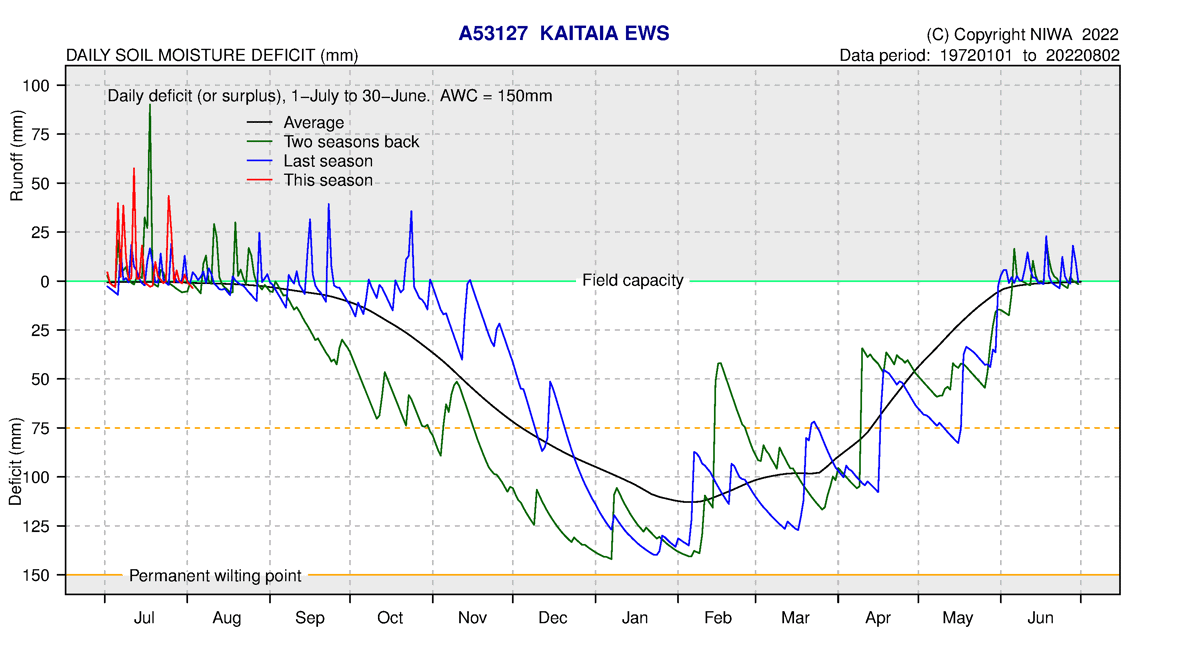
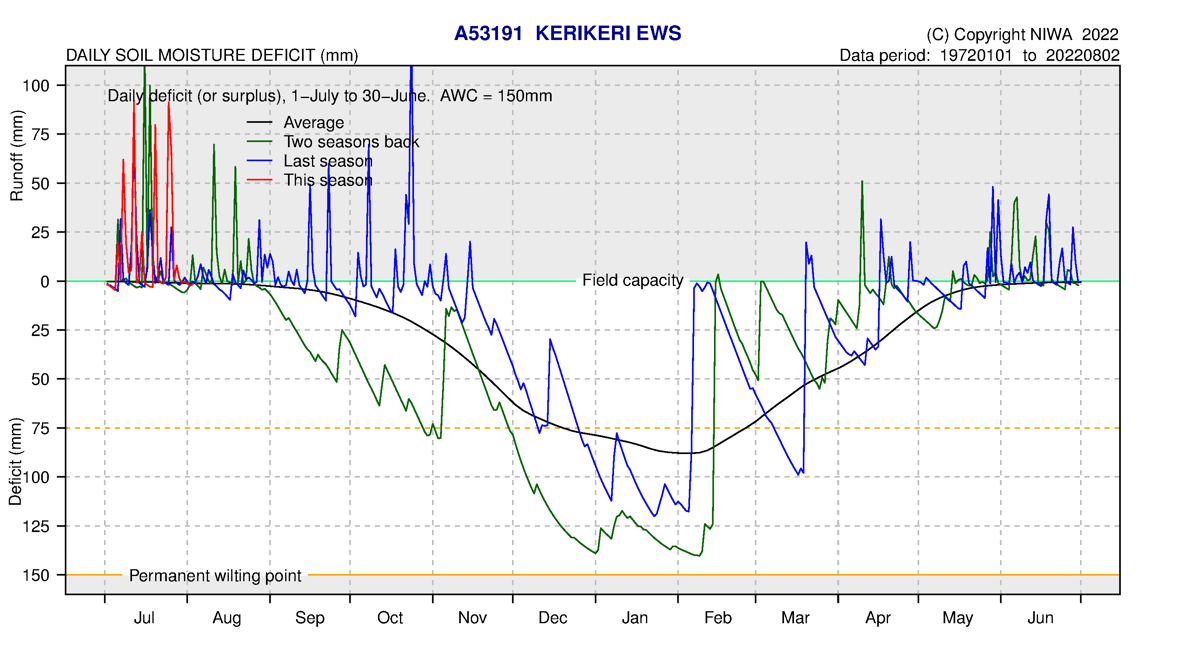
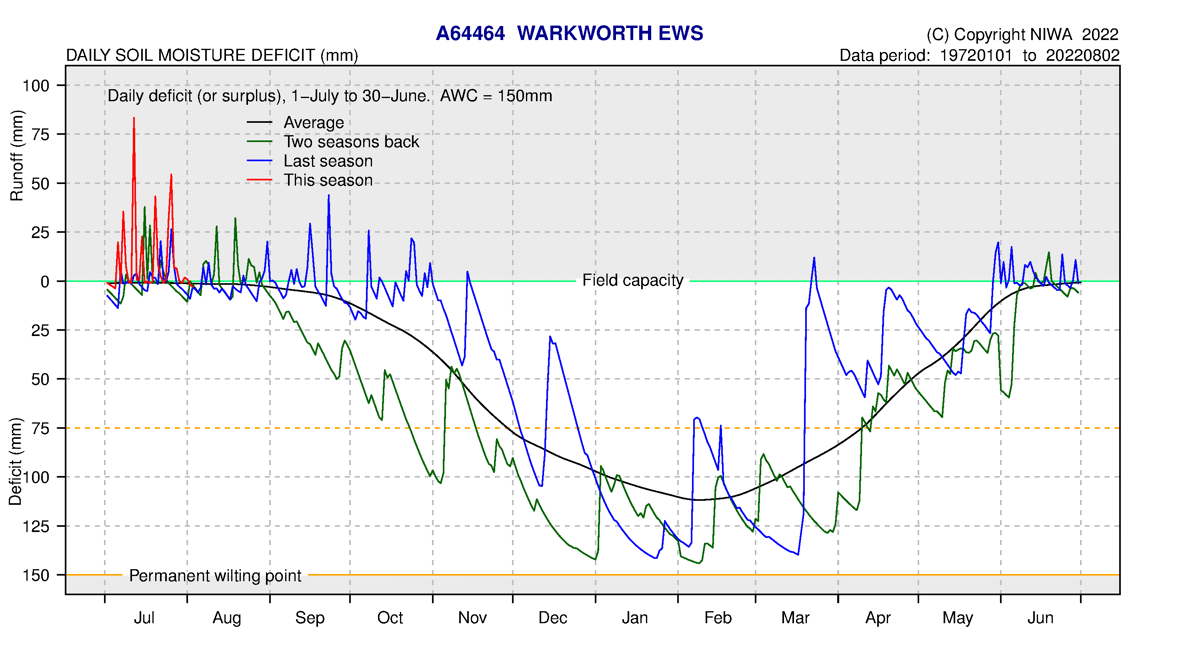
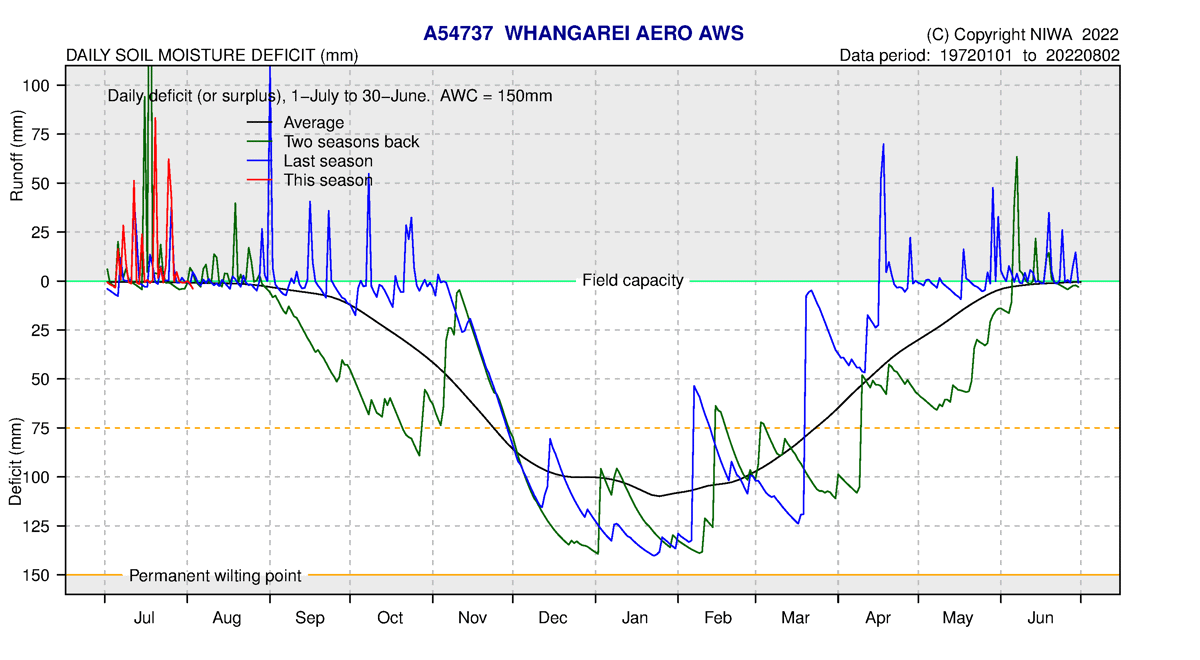
Soil Moisture
Soil moisture levels in July were at or above field capacity at all sites calculated in Northland, with spikes up to 50–75 mm run off during the large rain events recorded. Further rainfall will result in run off and even small events could show some change in river levels. The soil moisture deficit is calculated based on incoming daily rainfall (mm), outgoing daily potential evapotranspiration (mm), and a fixed available water capacity (the amount of water in the soil 'reservoir' that plants can use) of 150 mm” (NIWA).