March 2022 climate report
27 Apr 2022, 7:52 AM
Summary
- Rainfall in March was particularly dry other than 3 days of thunderstorm activity which saw storm intensity’s that exceeded 100-year events in several areas
- The standardised precipitation index, on both a three- and six-month scale, shows that rainfall was “Near Normal” compared to long term records
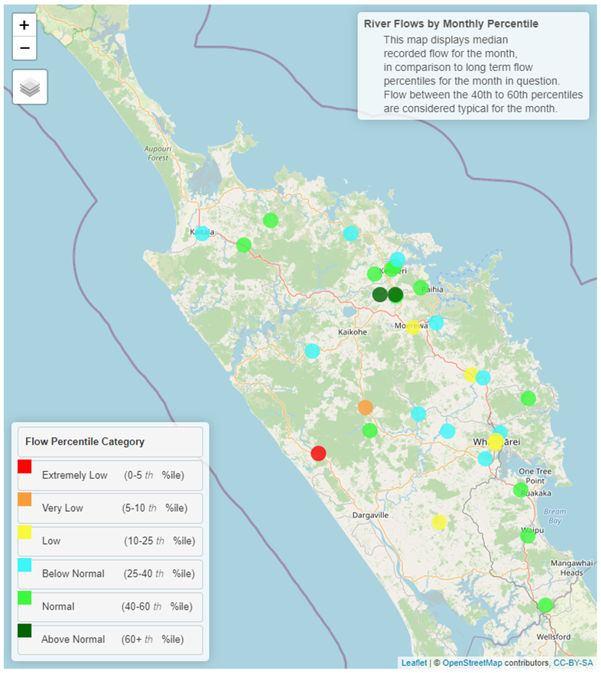
- River Flows varied in March, however most sites experienced “Normal” to “Low” flows for this time of year
- Soil moisture showed a sharp peak to field capacity in mid-March; however, this has receded quickly across most of Northland
- La Nina conditions are likely to continue with Northland continuing to experience “Above Normal” temperatures
- Between April – June rainfall and river flow are expected to be “Near Average”.
Outlook
April to June 2022:
The NIWA long term forecast for April to June 2022 indicates that La Nina conditions have a 65% chance of continuing. In Northland temperatures are likely to by above normal. While rainfall, river flow and soil moisture are expected to be near average. There is an increased chance that ex tropical cyclone activity in the first half of April, and again in early to mid-May. For more details, please refer to NIWA’s seasonal climate outlook for April - June 2022:
See the seasonal climate outlook on NIWA's website: niwa.co.nz
NIWA Temperature, Rainfall, Soil Moisture and River Flows probabilities for the period of April 2022 to June 2022
(Expressed as % likelihood for either Above Average, Near Average or Below Average conditions).
| Temperature | Rainfall | Soil moisture | River flows | |
| Above average | 70• | 35• | 25 | 20 |
| Near average | 25 | 40• | 45• | 45• |
| Below average | 05 | 25 | 30 | 35 |
Rainfall
Rainfall in March was limited except for three days of heavy thunderstorms between 21 – 23 March, most falls across Northland averaged 30-40mm an hour on the 22nd and 23rd, however on the morning of the 21st several sites experienced intense rainfall over 1 – 2 hours, resulting in some flooding. The maximum rainfall intensity on the 21st was 112 mm, in 1 hour, which was recorded at the Brynderwyn rain gauge, this event exceeded the threshold for a 1 in 250-year event (HIRDS V4, 0.4% chance of happening in any one year).
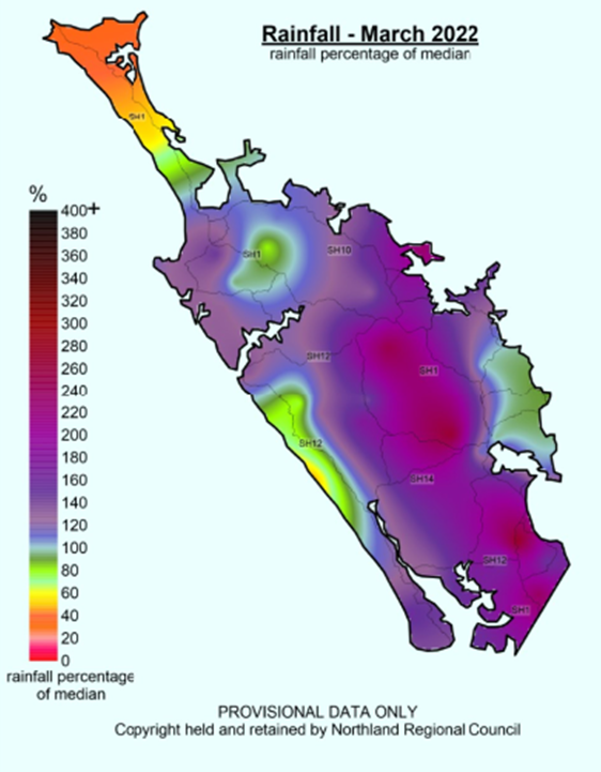
In March the average rainfall for Northland was 135 mm, concentrated to the east and south. The lowest rainfall of 17. 6 mm was recorded at Cape Reinga (MET service site), while the highest was recorded at the Brynderwyn site of 252.2 mm for the month (with 220 mm of that occurred on the 21st and 22nd). Regionally we averaged 147% of what was expected but again Cape Reinga (35%) and Kai Iwi Lakes (39%) were much lower than the rest of Northland. At the other end the Brynderwyns topped out at 277% of the expected March rainfall followed by Waipao at Draffin Road (268%), Otiria at Ngapipito (252%) and Hakaru at Topuni Creek Farm (237%).
Rainfall (% of Median) for March 2022 across Northland with a range of 277% to 35%
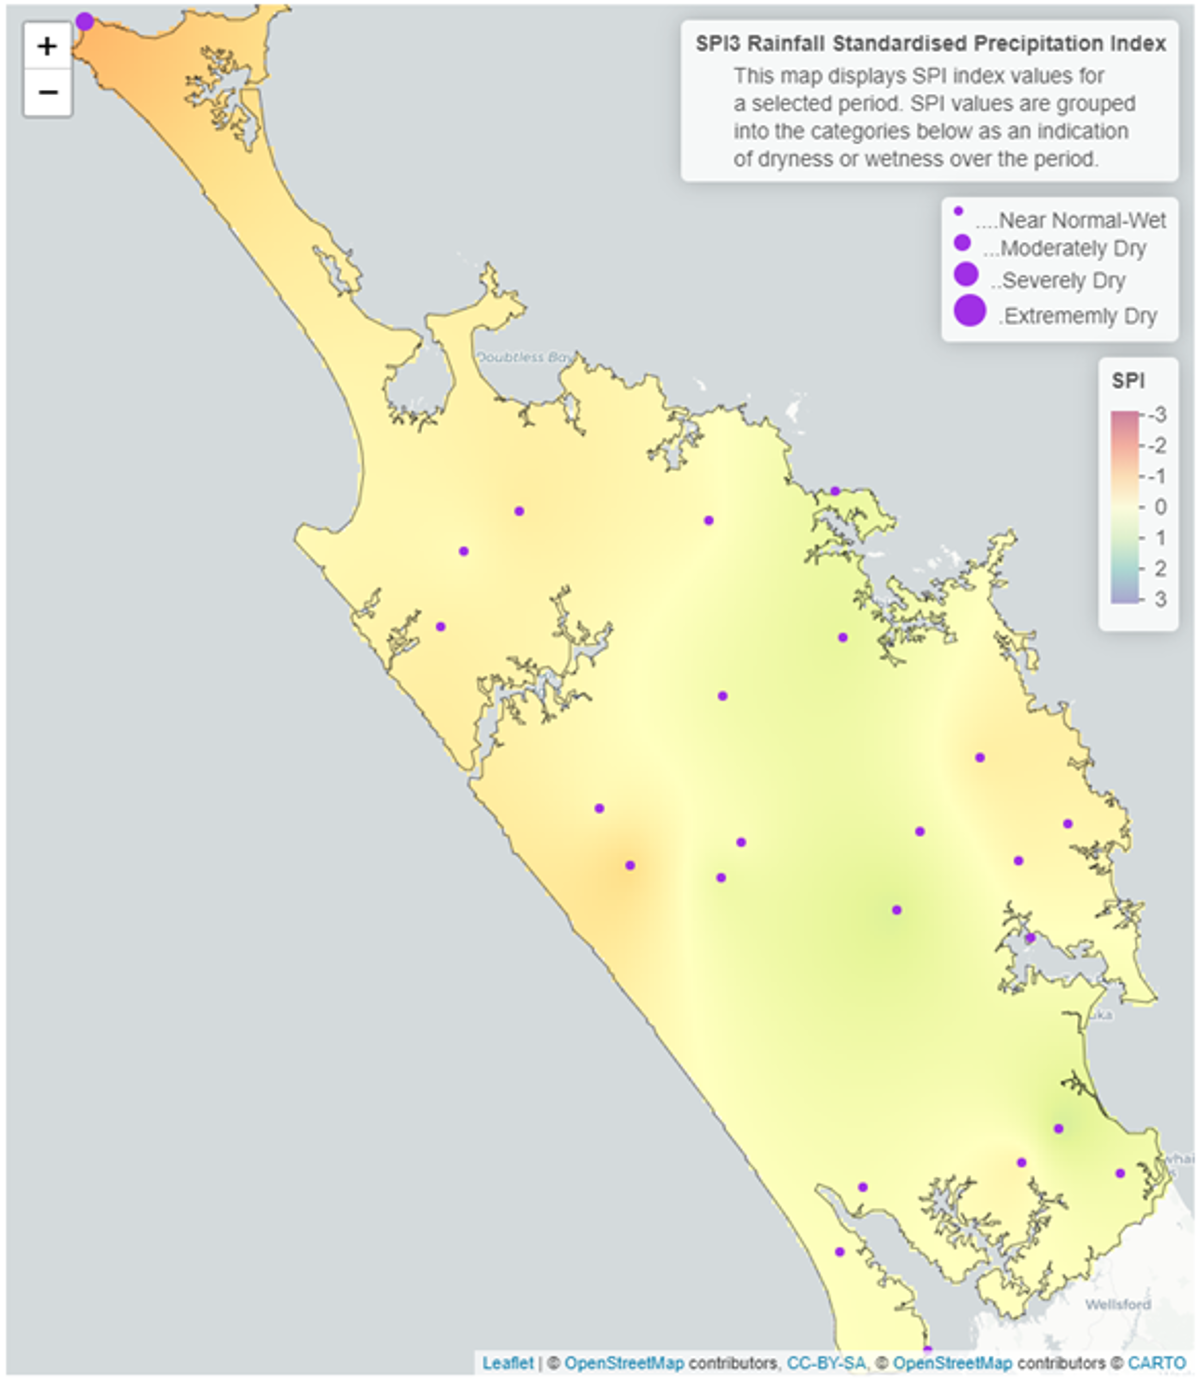
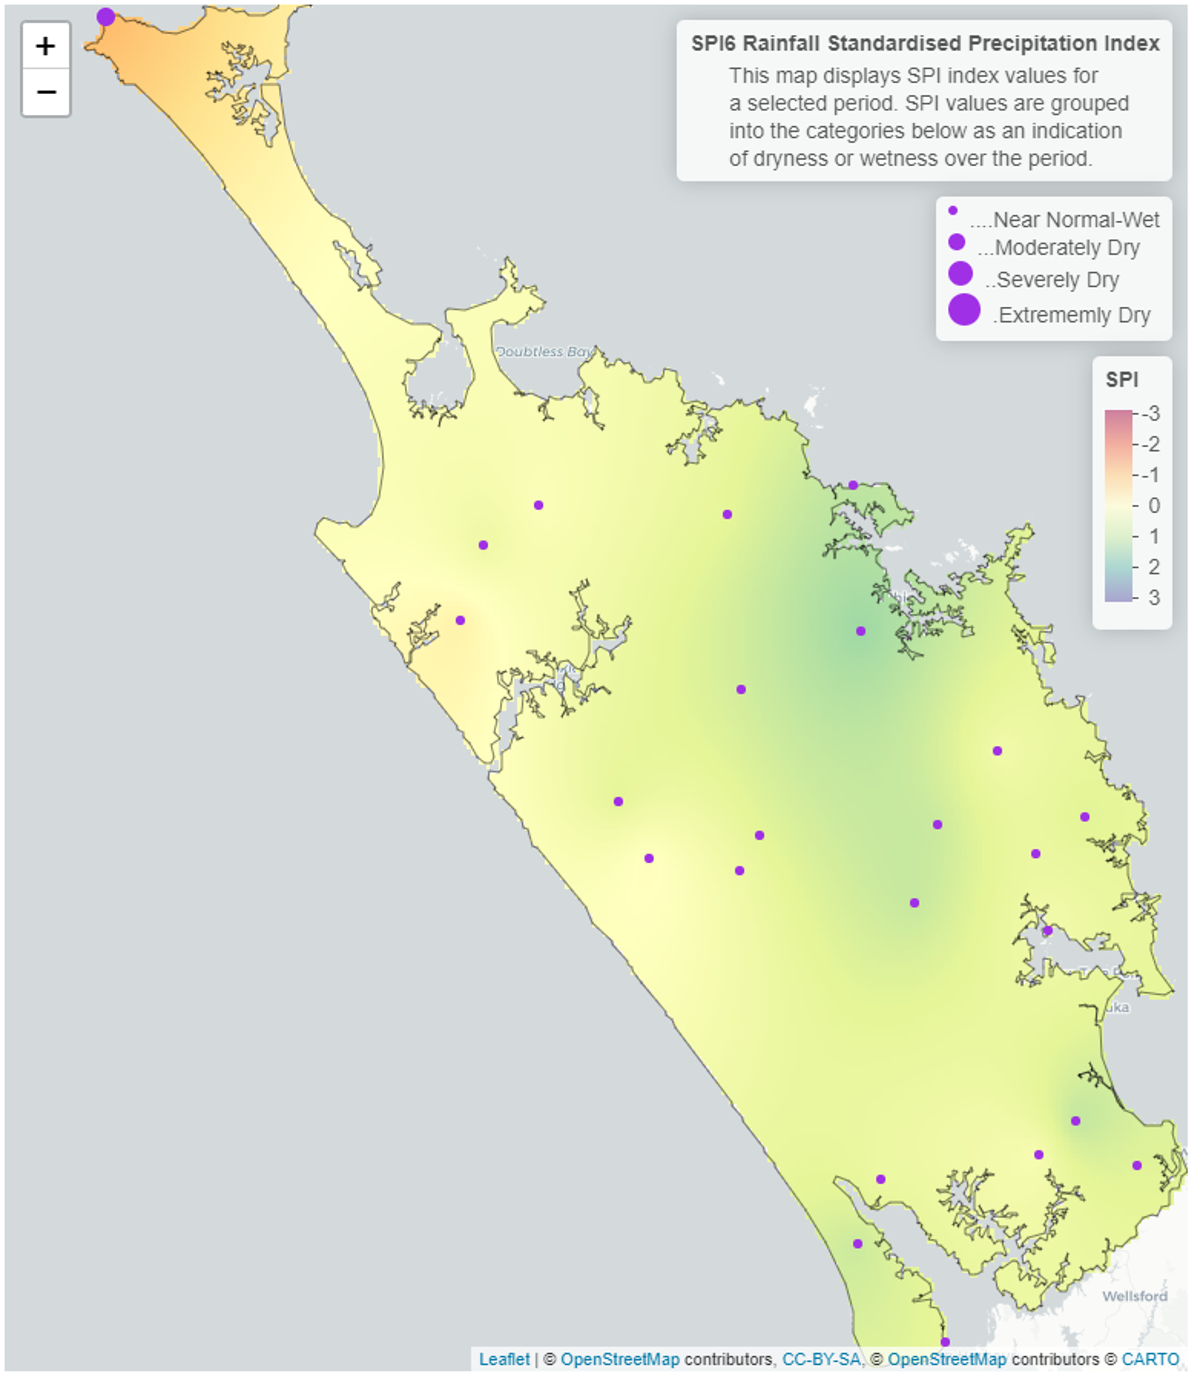
The 3-month standardised precipitation index (SPI 3) values for January - March 2022 reflect the near normal conditions occurring across most of Northland, however, the north and west were drier with moderately dry conditions, particularly in the North. The 6-month standardised precipitation index (SPI 6) shows near normal conditions from September 2021 – March 2022, with some areas drier in the Northwest.
The values for the rainfall deficit for the previous periods from the end of March are shown in the table below, with all sites showing no deficit on a one-month scale, and minor deficit on a three-month period. For a 6 to 12-month scale the majority of sites across Northland show a greater than expected or near average rainfall for the respective period.
3 and 6-Month SPI (Standardised Precipitation Index) Maps for March 2022


Monthly Median Rainfall deficit values (mm) for March 2022
Negative values represent rainfall deficit, positive values represent rainfall in excess of “typical” rainfall.
| Site | End date | 1 Month | 3 Months | 6 Months | 12 Months |
| Kaitaia Ews | March 2022 | 4.55 | -15.92 | 14.36 | -10.69 |
| Kerikeri Ews | March 2022 | 31.10 | 84.74 | 403.34 | 477.51 |
| Kaikohe Aws | March 2022 | 101.87 | 94.95 | 261.33 | 206.77 |
| Whangārei Aero Aws | March 2022 | 38.73 | 36.11 | 135.67 | 294.45 |
| Dargaville 2 Ews | March 2022 | 25.11 | -16.04 | 46.40 | -36.73 |
| Awaroa at Wallace Road | March 2022 | 31.00 | 44.50 | 124.17 | -12.68 |
River flow
River flows varied widely across Northland in March. Along the east coast from Kaitaia to Kaiwaka the flows we mostly either “Normal”, or “Below Normal” of their expected flows. Both sites on the Waitangi River however were “Above Normal”. While further south there were a scattering of sites which were “Low” compared to the long-term patterns for March. On the West coast sites range between “Low” – “Extremely Low” which is not surprising following the very low rainfalls seen on the west coast during the summer and start of autumn.
Monthly percentile River Flows for March 2022
Groundwater
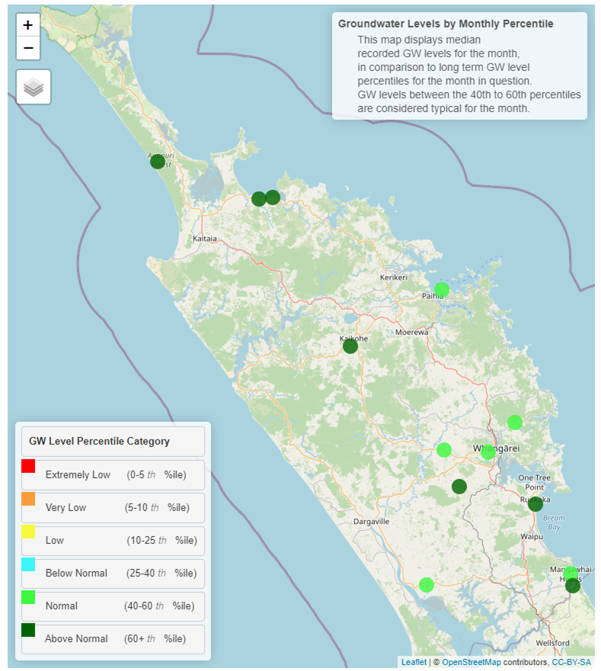
Following similar patterns to February, the groundwater levels in March were either “Above Normal” or “Normal” throughout Northland. The Russel aquifer has seen a rise in water level to a normal level for this time of year, while it has been below normal all summer. Groundwater remains elevated following a wet winter and several high intensity rain events recharging the region.
| Aquifer | Status | Percentile |
| Aupōuri | Above normal | 60th+ |
| Taipā | Above normal | 60th+ |
| Russell | Normal | 25-40th |
| Kaikohe | Above normal | 60th+ |
| Poroti | Normal | 40-60th |
| Whangārei | Normal | 40-60th |
| Mangawhai | Normal | 40-60th |
| Marsden - Ruakākā | Above normal | 60th+ |
| Ruawai | Normal | 40-60th |
Groundwater map for March 2022
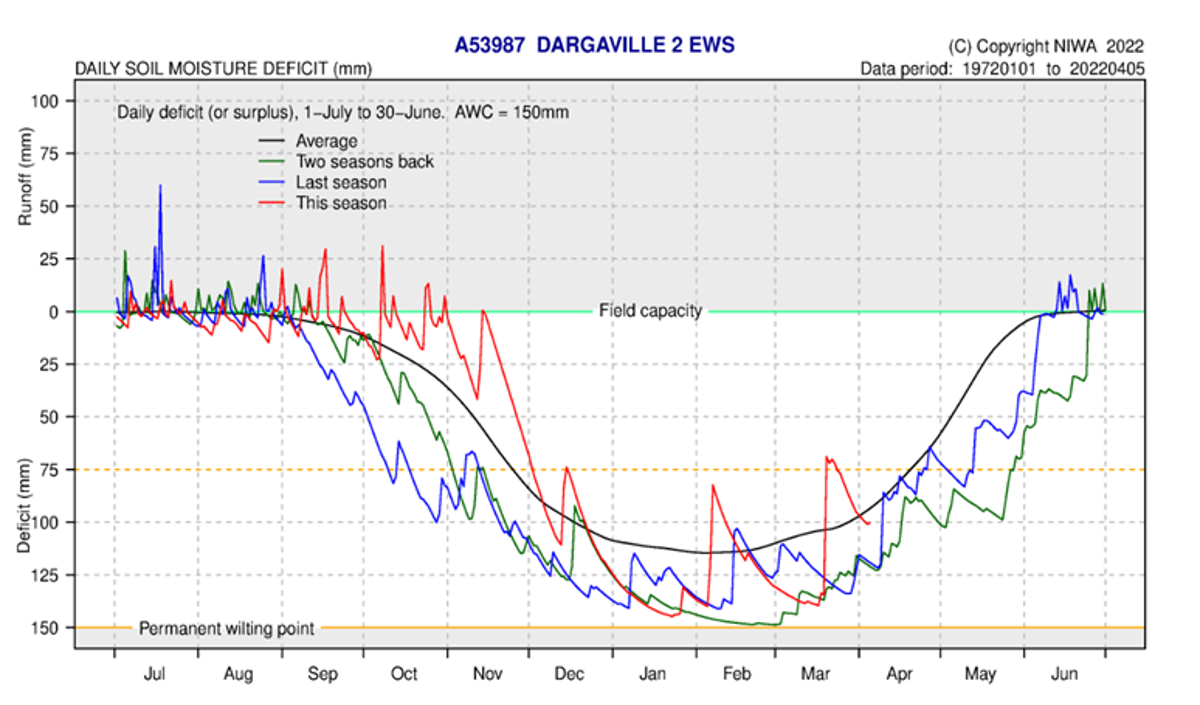
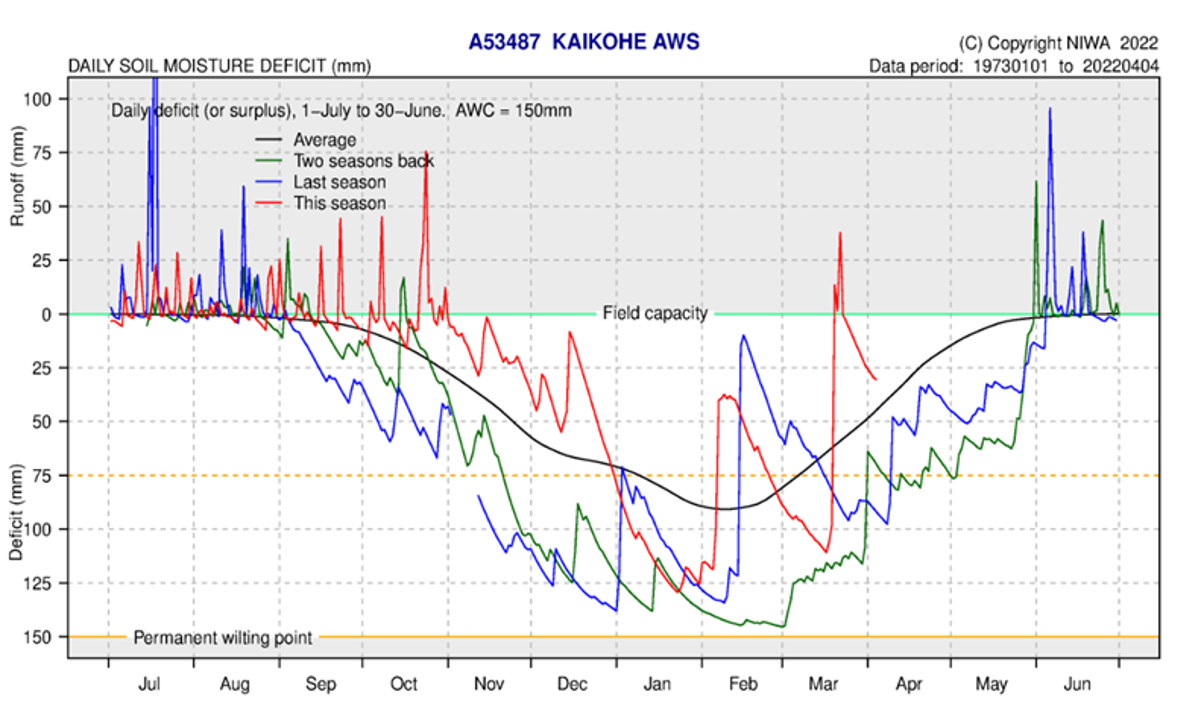
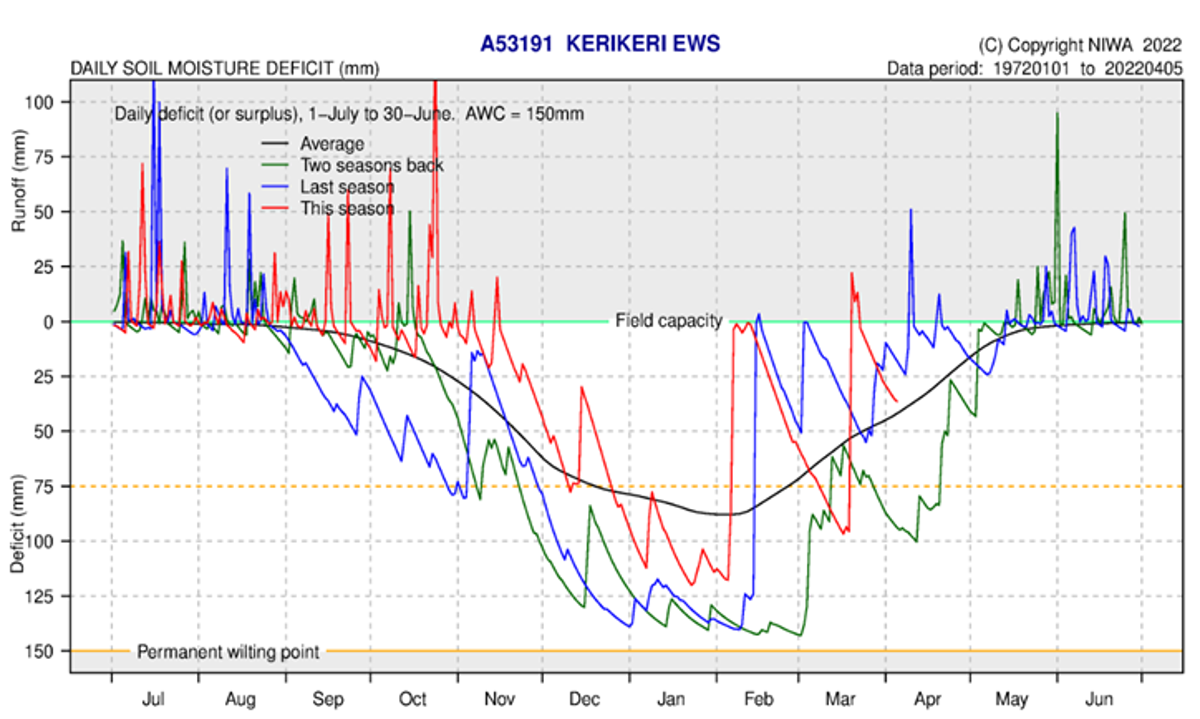
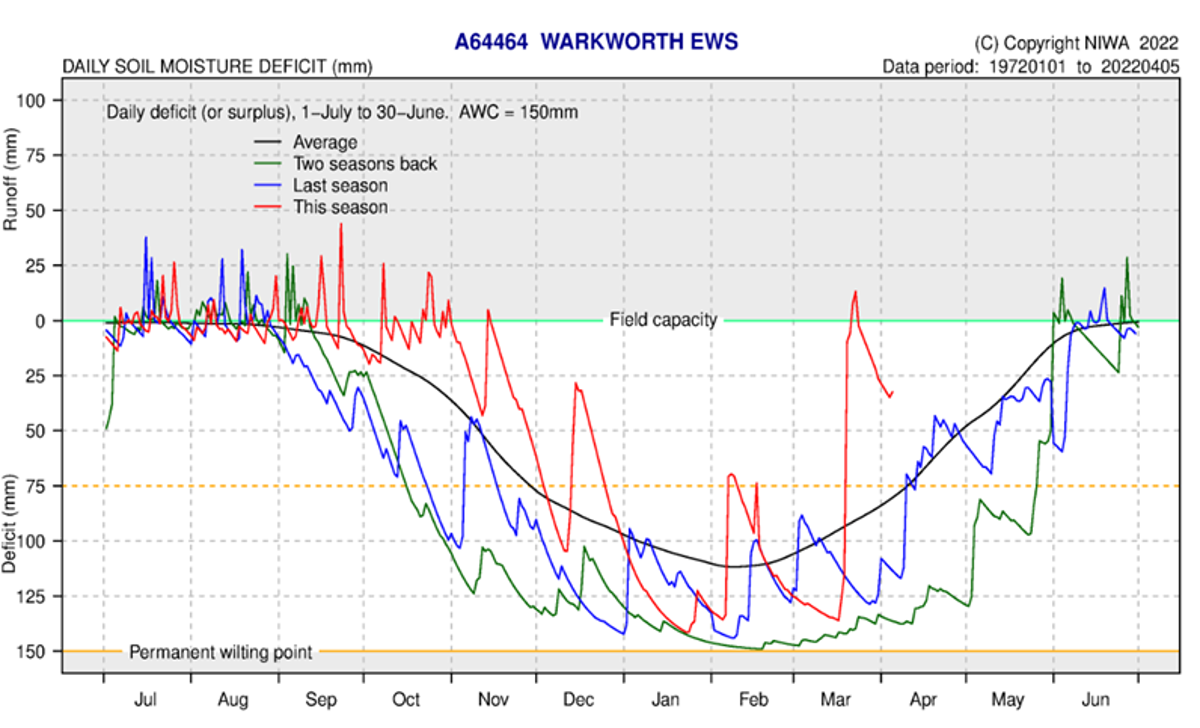
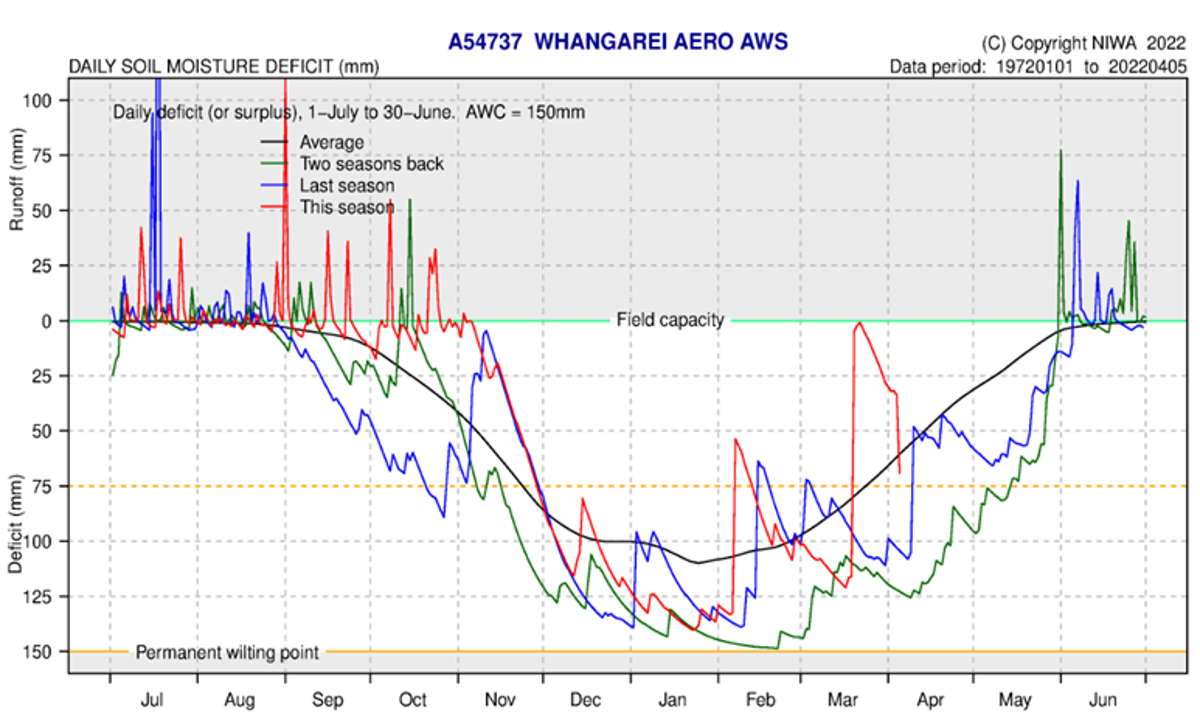
Soil moisture deficits
Soil moisture levels in March were driven by the rain events in February and in March. Across the first few weeks of March all sites showed a recession reaching between 100 – 125 mm deficit before a sharp rise on the 21st of March. All sites recorded soil moisture levels rising past 75 mm, where water is readily available to plants. .
In the south and east of Northland soil moisture reached, and in some areas, exceeded field capacity for a few days (which would have been observed in many places by surface flooding). These levels have again quickly dropped with soil moisture deficit in the first week of April varying between 100 mm in Dargaville and Kaitaia through to approximately 25 mm in Kaikohe and Kerikeri. Surprisingly the model has shown a sharp decrease in Whangārei in the first week of April, this could be due to a few days of warmer temperature and very isolated areas of rainfall.
All sites are below field capacity, indicating that minor rainfall events are not likely to cause any significant river runoff, however large events similar to the March event will raise field capacity as well as have a portion that will not enter the soil environment and travel as overland flow into local rivers.
"The soil moisture deficit is calculated based on incoming daily rainfall (mm), outgoing daily potential evapotranspiration (mm), and a fixed available water capacity (the amount of water in the soil 'reservoir' that plants can use) of 150 mm” (NIWA).