August 2021 climate report
21 Sep 2021, 8:34 AM
Summary
- August 2021 rainfall was fairly typical of rainfall for this month historically
- River flows were a real mixed bag during August with flows ranging between lower than normal to above normal, likely due to the occurrence of quite geographically isolated rain events through the month
- Groundwater levels are low in the Ruawai and Mangawhai aquifers due to rainfall deficit over extended periods in these areas. These will be worth watching in coming months as lower rainfall in these areas is likely to be a continuing pattern
- Soil moisture is near average and at field capacity, as expected for this time of year
- The long-range quarterly climate outlook from NIWA predicts that Northland may be on the drier side for this period. We need to be watchful of areas in the south-west that are already flashing dry signals
Outlook
September to November:
The NIWA long-range outlook for September to November 2021 calls for an equal likelihood of either near normal or below normal rainfall, but lower than normal soil moisture and river flows, likely influenced by higher than normal temperatures and increased evapotranspiration. NIWA note that the continuation of La Nina conditions is quite likely. The upshot of this is that the weather patterns we have observed over the last year are likely to continue, meaning that there is a risk of south-western areas remaining dry. The likelihood of ex tropical cyclones landing in our neck of the woods is increased in La Nina conditions, but we can expect to get a better outlook for this closer to summer.
NIWA Temperature, Rainfall, Soil Moisture and River Flows probabilities for Spring; September to November 2021
| Temperature | Rainfall | Soil moisture | River flows | |
| Above average | 60• | 20 | 25 | 20 |
| Near average | 35 | 40• | 35 | 30 |
| Below average | 05 | 40• | 40• | 50• |
Rainfall
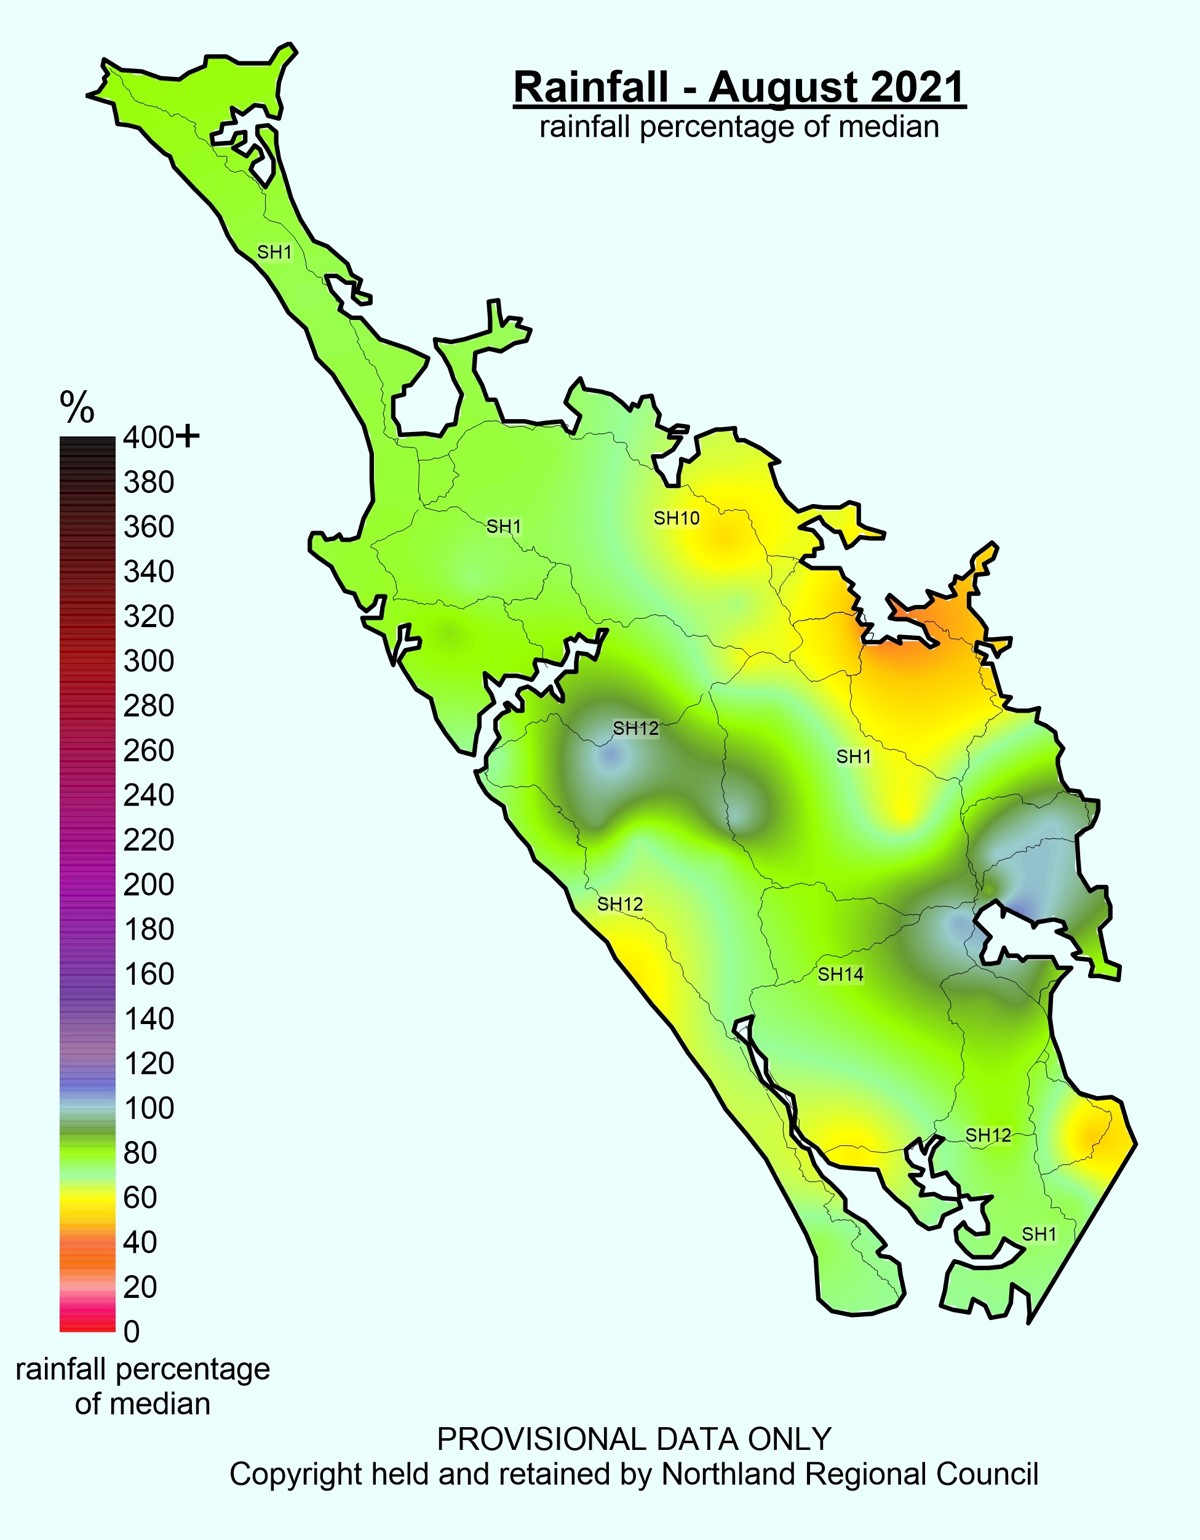
August 2021 was slightly drier than typical in most areas of the region, and close to typical in the catchments surrounding Whangārei and in the elevated ranges around Tutamoe. Overall, the monthly rainfall can be considered fairly typical when compared to historical months of August. Two severe weather warnings were issued by MetService during the month on the 27/08/21 and 31/08/21, with no significant flooding from either of these events.
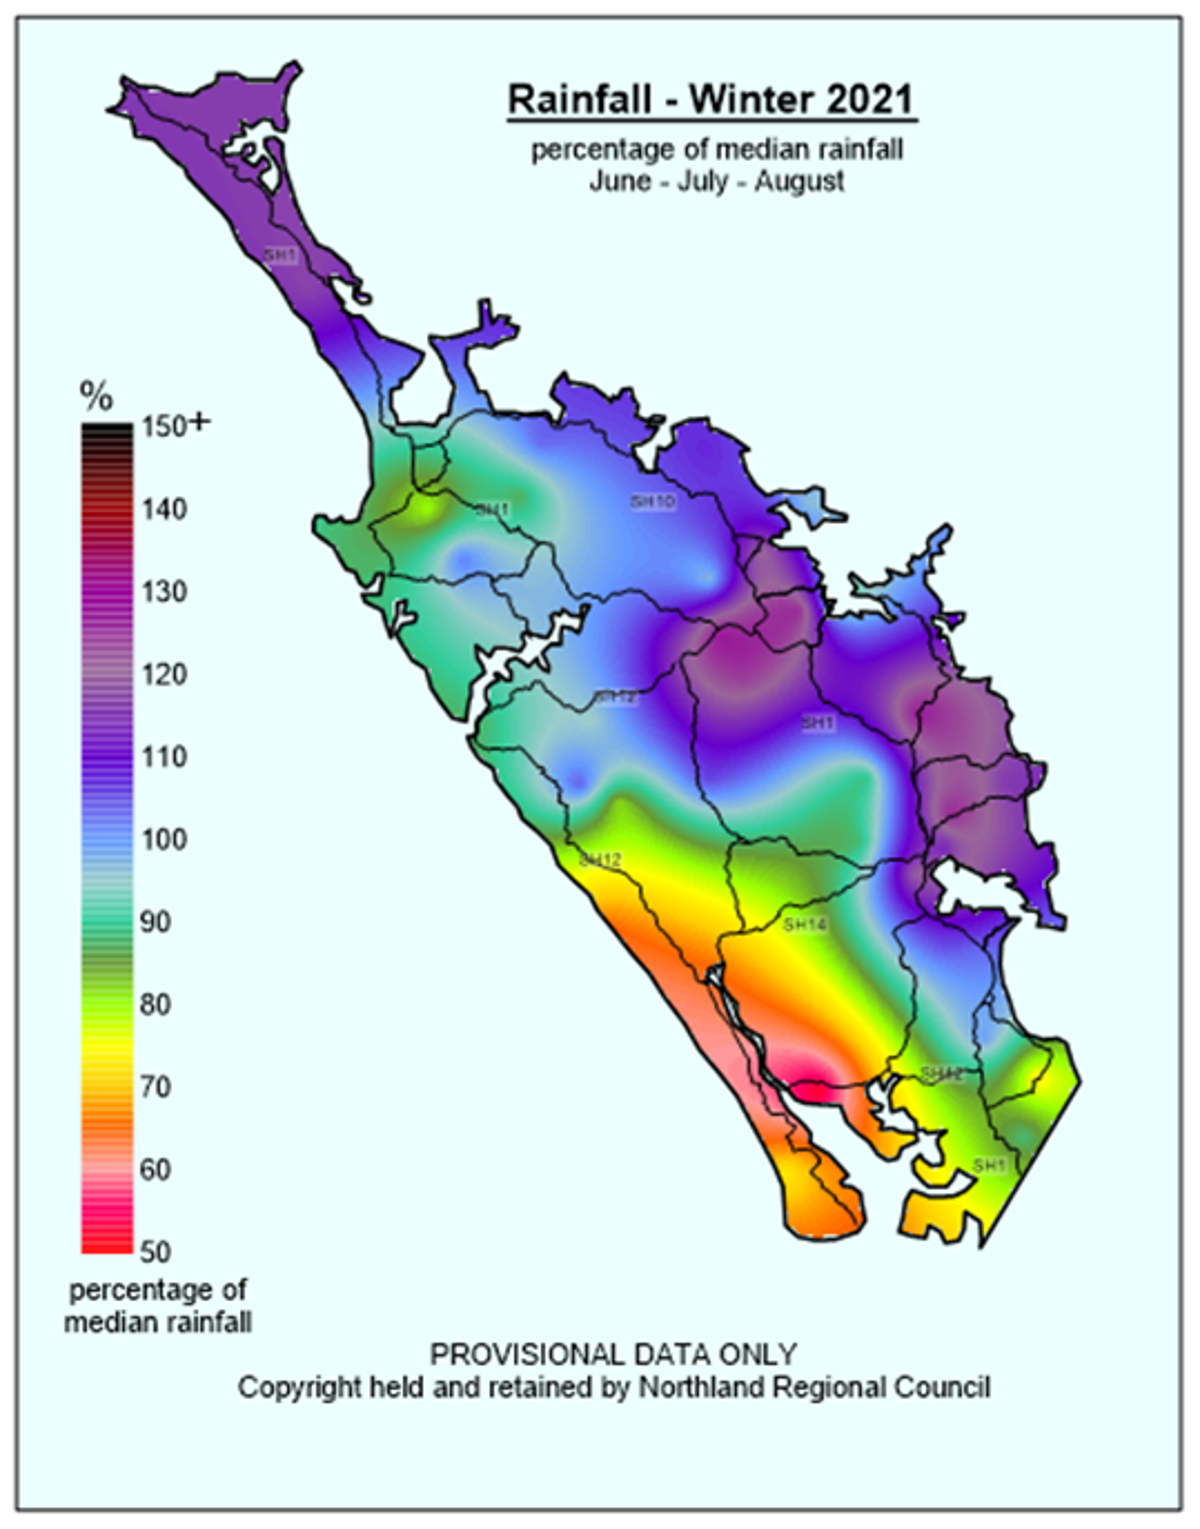
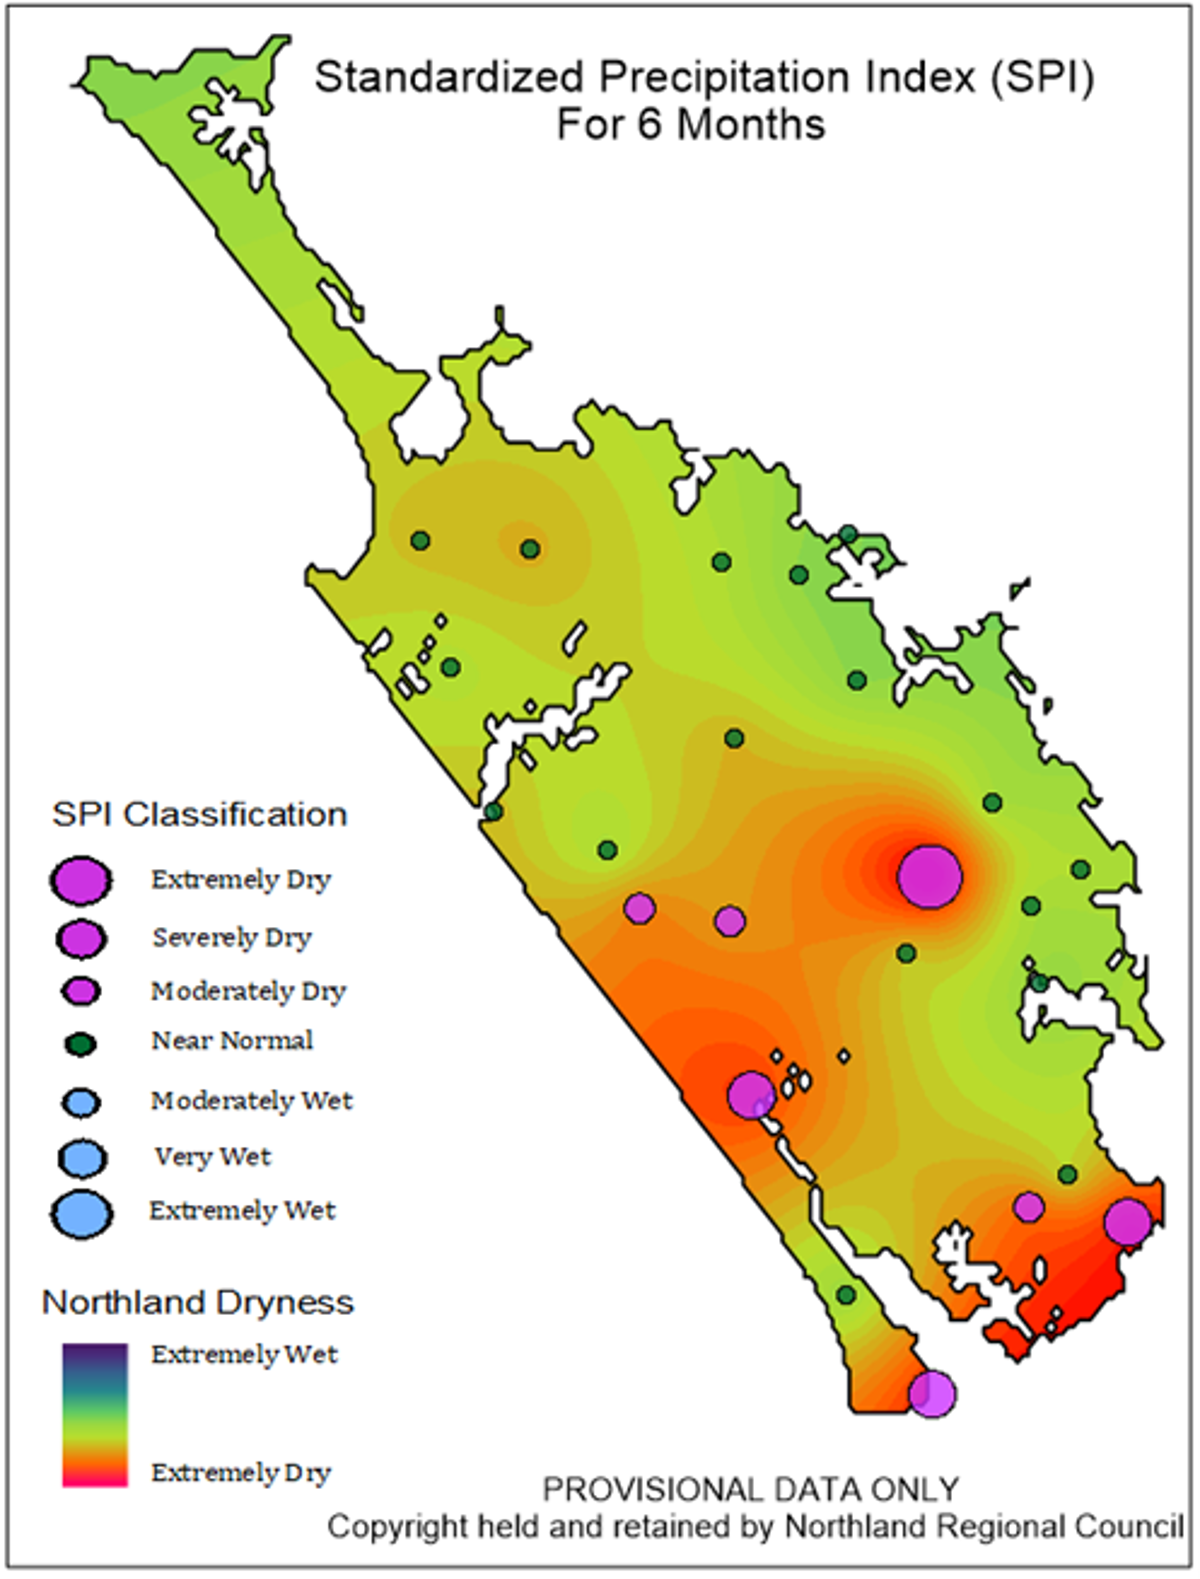
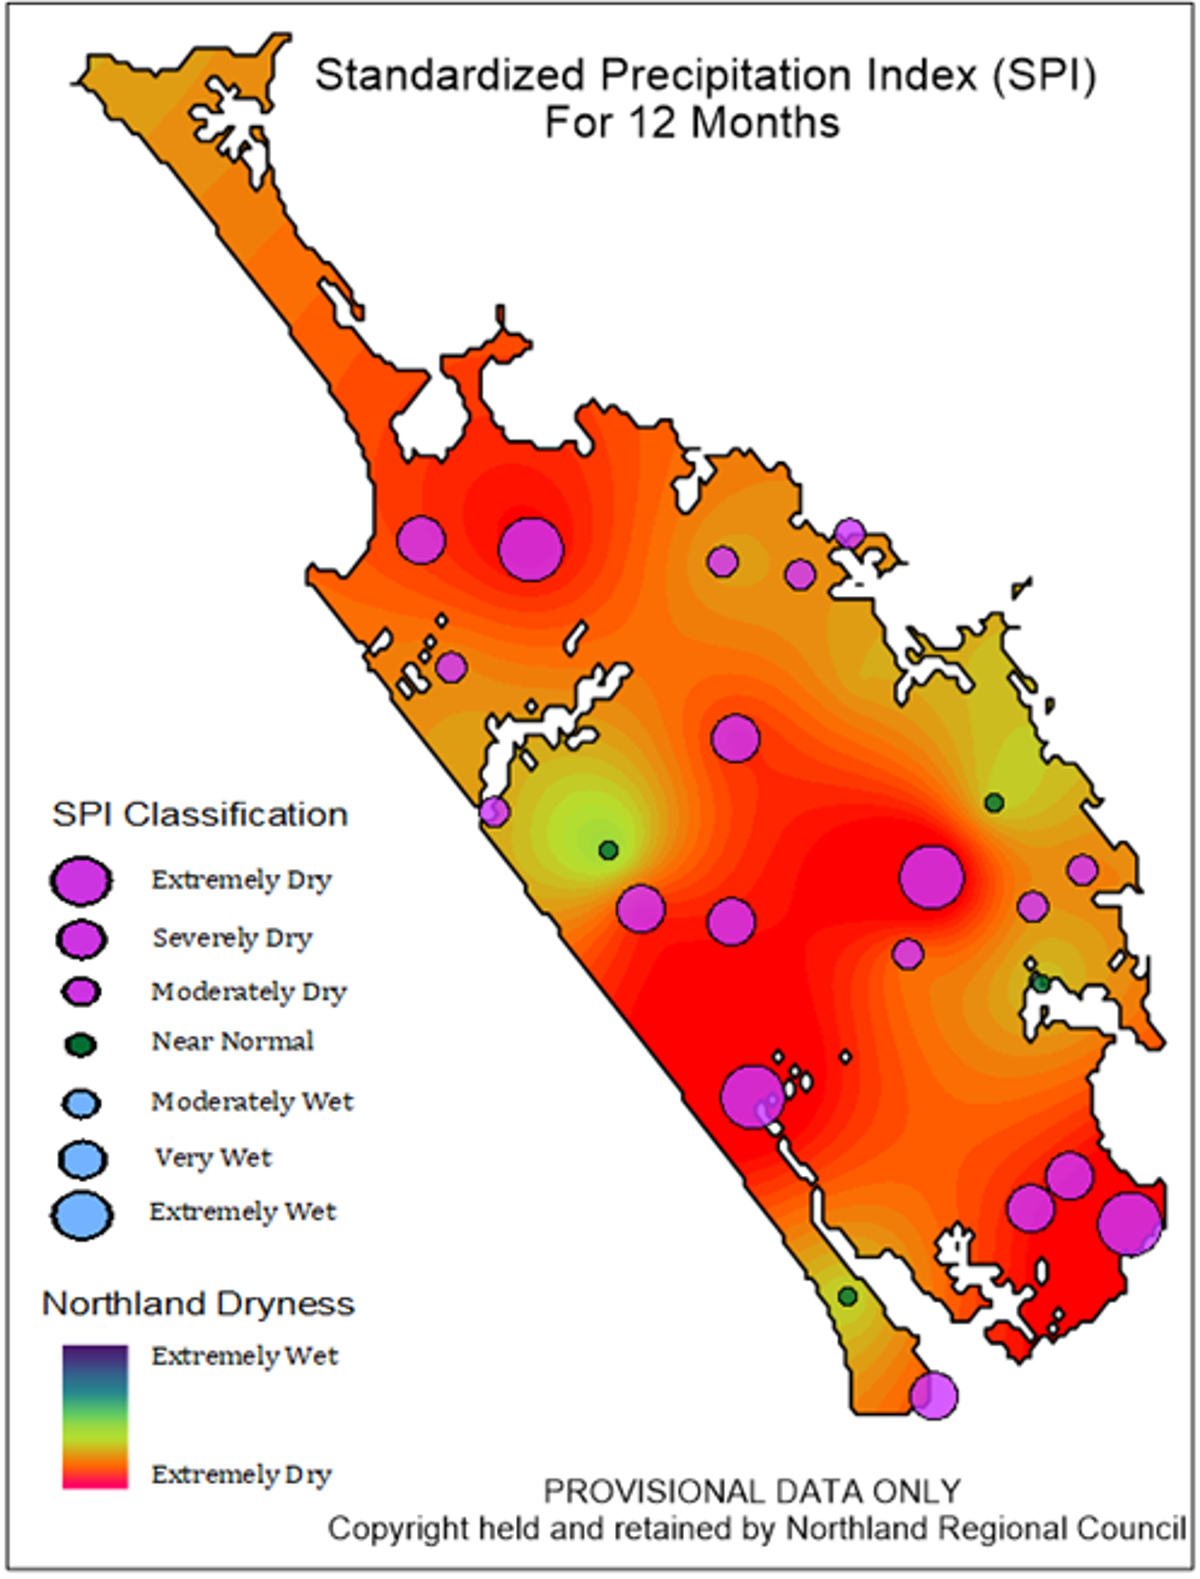
The winter rainfall and the SPI maps below show a delineation in rainfall between the east and west, particularly between the east and the south-west of the region. The south-west has been consistently drier than normal for some time now due to the prevailing north-easterly weather systems. Rain typically misses the south-west during these weather events and is a symptom of continuing La Nina climate conditions. This is particularly evident in the 6-month SPI analysis as shown in the map below and should be used as a flag that there is some risk in this area over summer if we continue to get dry conditions here over Spring as per the NIWA long range forecast.
Rainfall % median maps for August 2021 and Winter 2021


SPI Index map for 6 and 12 months to the end of August 2021


Rainfall deficit values (mm)
| Site | End date | 1 Month | 3 Months | 6 Months | 12 Months |
| Kaitaia Ews | August 2021 | -33.26 | -36.89 | -92.69 | -231.34 |
| Kerikeri Ews | August 2021 | -41.47 | 84.07 | 8.16 | -144.24 |
| Kaikohe Aws | August 2021 | -30.10 | 36.67 | -126.57 | -306.73 |
| Whangārei Aero Aws | August 2021 | 18.74 | 92.63 | 42.27 | -67.21 |
| Hokianga Harbour at Omapere/Opononi | August 2021 | -43.50 | -50.52 | -62.36 | -127.30 |
| Dargaville 2 Ews | August 2021 | -30.74 | -112.94 | -153.71 | -306.08 |
River flow
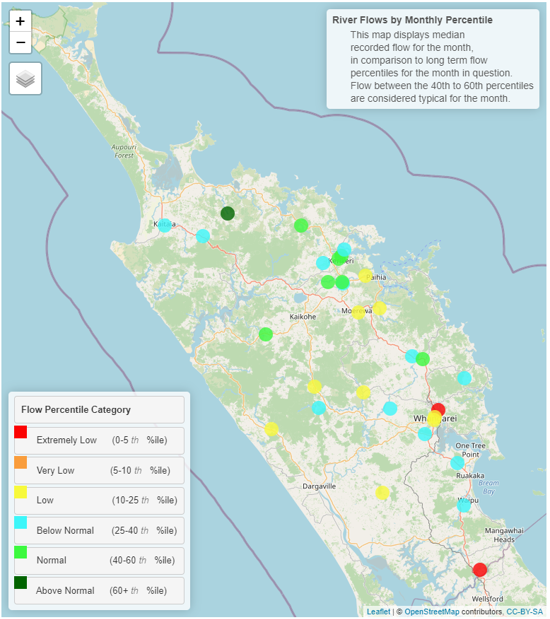
River flows during August 2021 were a mixed bag from “Low” (10-25th percentile) ranging to “Normal” (40-60th percentile). Some outliers were the Oruru River which was classified as “Above Normal” and the Hatea and Hakaru Rivers which were classified as “Extremely Low”. These “Extremely Low” results may be erroneous due to error in flow ratings, so will be investigated. The variable nature of these flow percentiles during August is most likely due to the isolated nature of rainfall events during the month which had some impact on certain areas, but little in others even within close geographical proximity.
Flow map August 2021
Groundwater
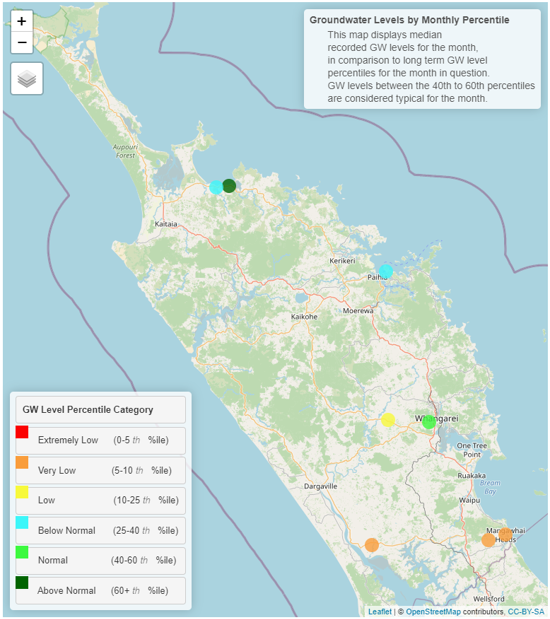
During August 2021 Groundwater levels were “Normal” in the Whangārei groundwater system, but below normal in most other locations. Tapia and Russell systems are classified as “Below Normal” for the month, while Poroti, Mangawhai and Ruawai are classified as “Low” or “Very Low” (see below for percentiles). The pattern here reflects rainfall conditions in these low groundwater areas over the last ~6 months, with rainfall deficit in these southern areas of the region clearly having an impact on groundwater levels. Note that there is some data unavailable during this month due to field work not undertaken during the Covid 19 lockdown.
Northland aquifer status table for August 2021
| Groundwater systems | Status | Percentile |
| Aupouri | Data unavailable | Data unavailable |
| Taipa | Below normal | 25-40th |
| Russell | Below normal | 25-40th |
| Kaikohe | Data unavailable | Data unavailable |
| Whangārei | Normal | 40-60th |
| Poroti | Low | 10-25th |
| Mangawhai | Very low | 5-10th |
| Rauwai | Very low | 5-10th |
Northland aquifer status map
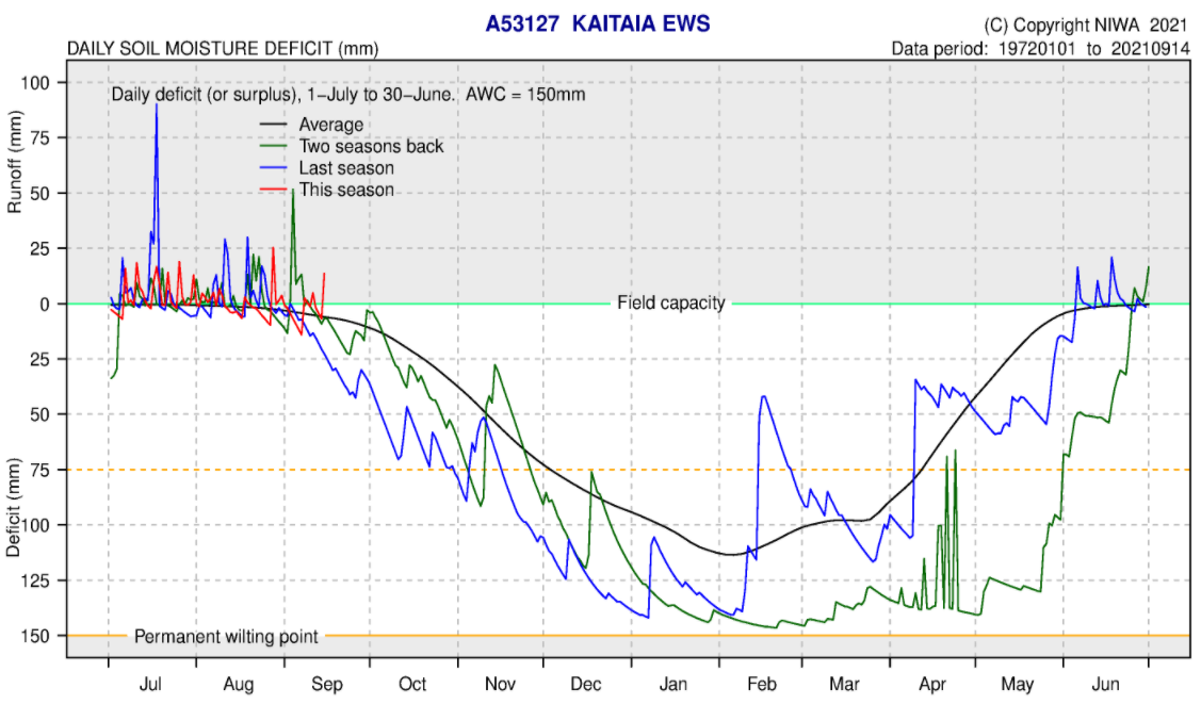
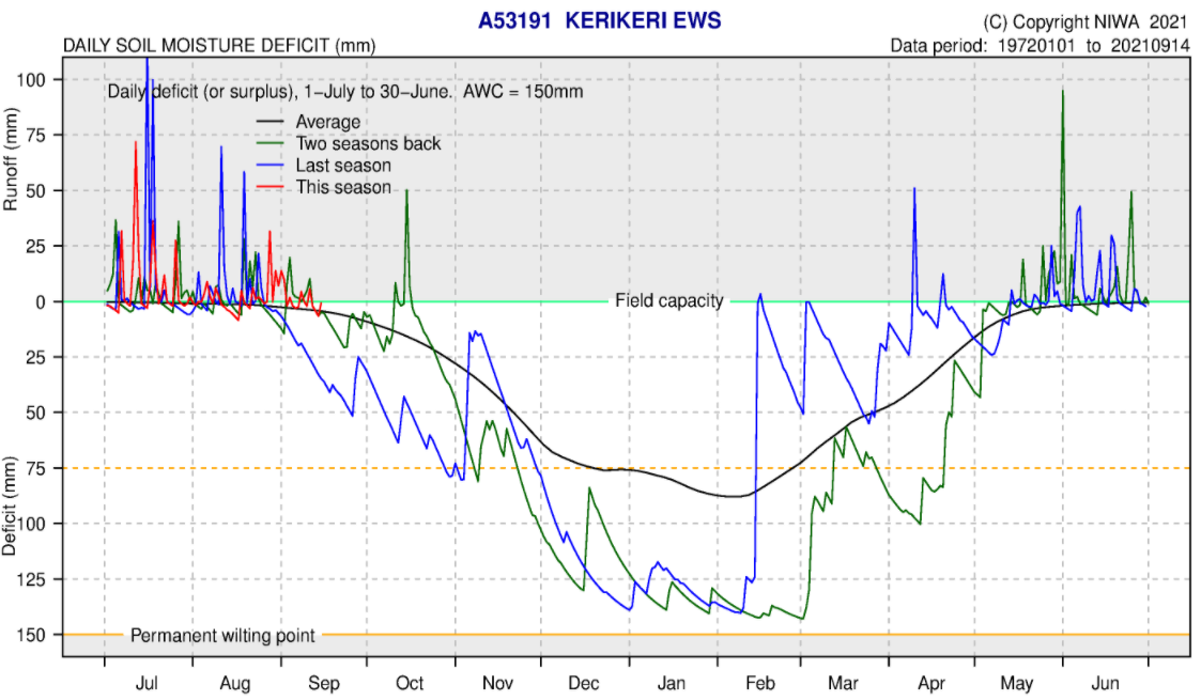
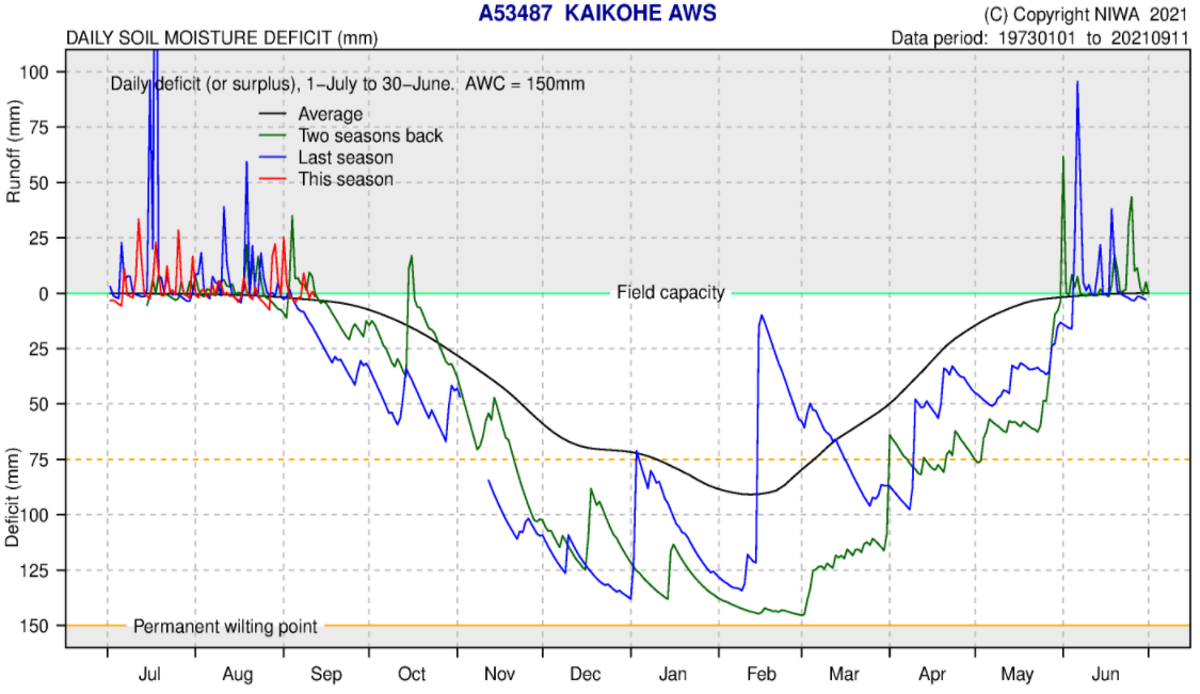
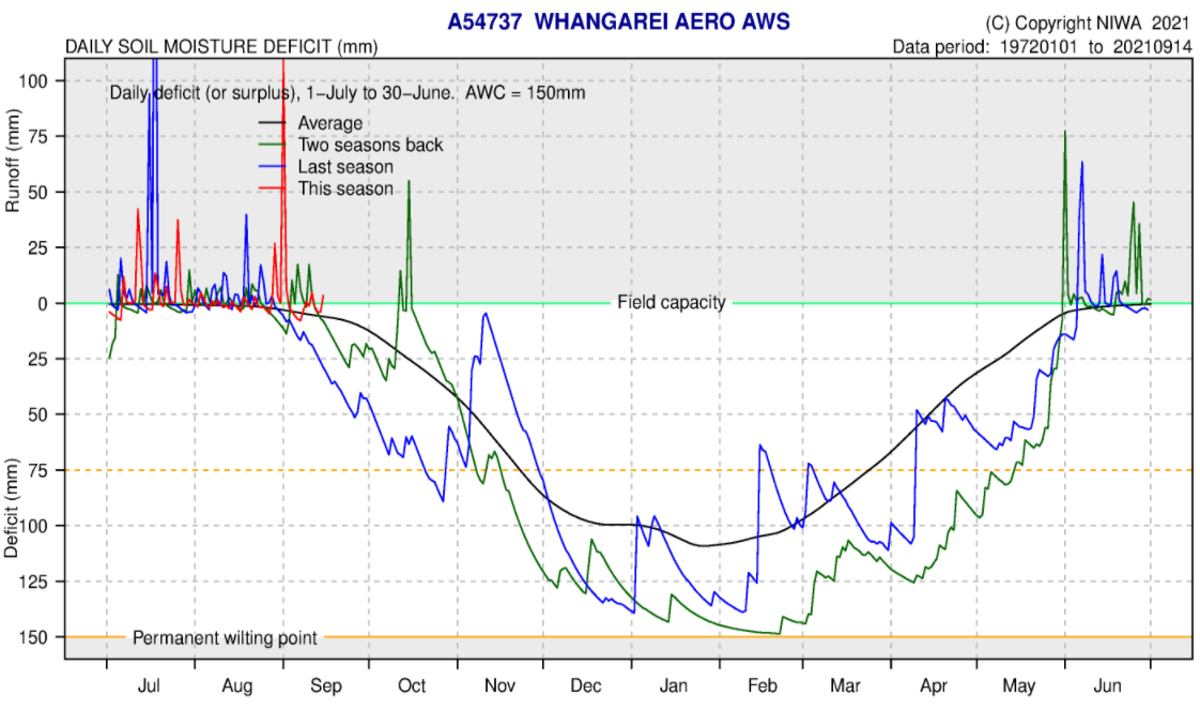
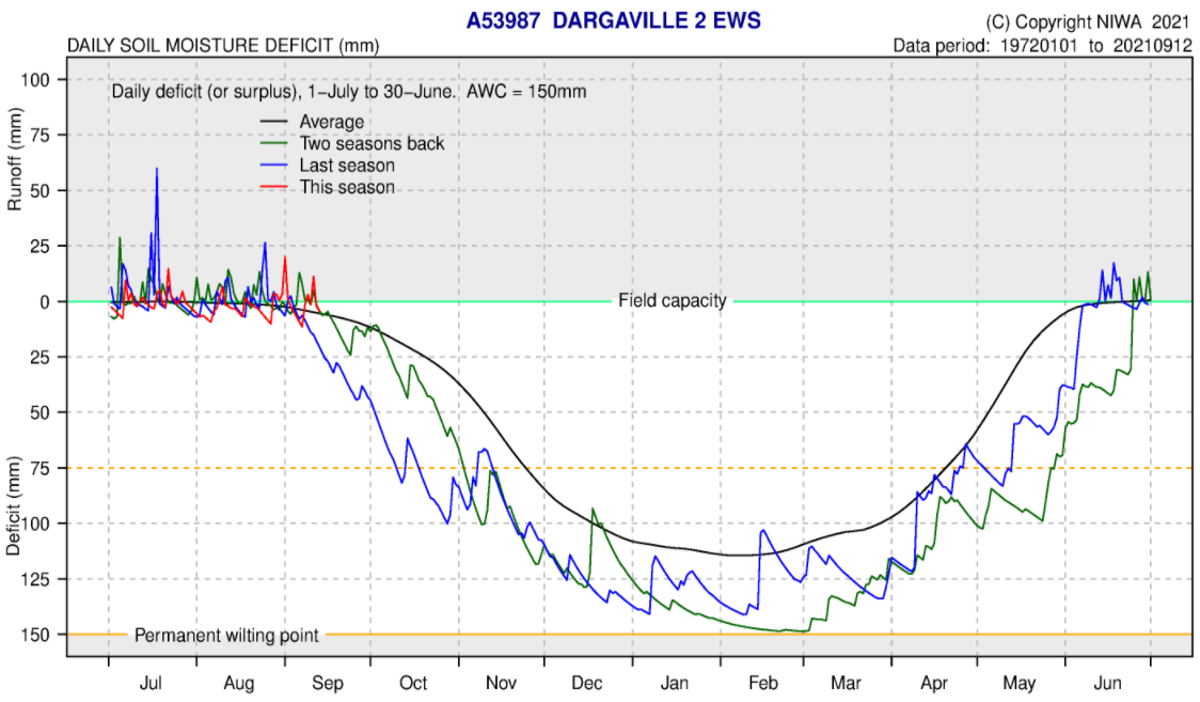
Soil moisture deficits
NIWA water balance modelling indicates soil moisture deficit is near normal at all NIWA climate stations, and close to or at field capacity. “SMD is calculated based on incoming daily rainfall (mm), outgoing daily potential evapotranspiration (PET, mm), and a fixed available water capacity (the amount of water in the soil 'reservoir' that plants can use) of 150 mm” (NIWA).